Categories
Bucknell/Local Interest Digital Humanities General GIS GIS in History Map Apps Slideshow

PhillyHistory + augmented reality as a smartphone app

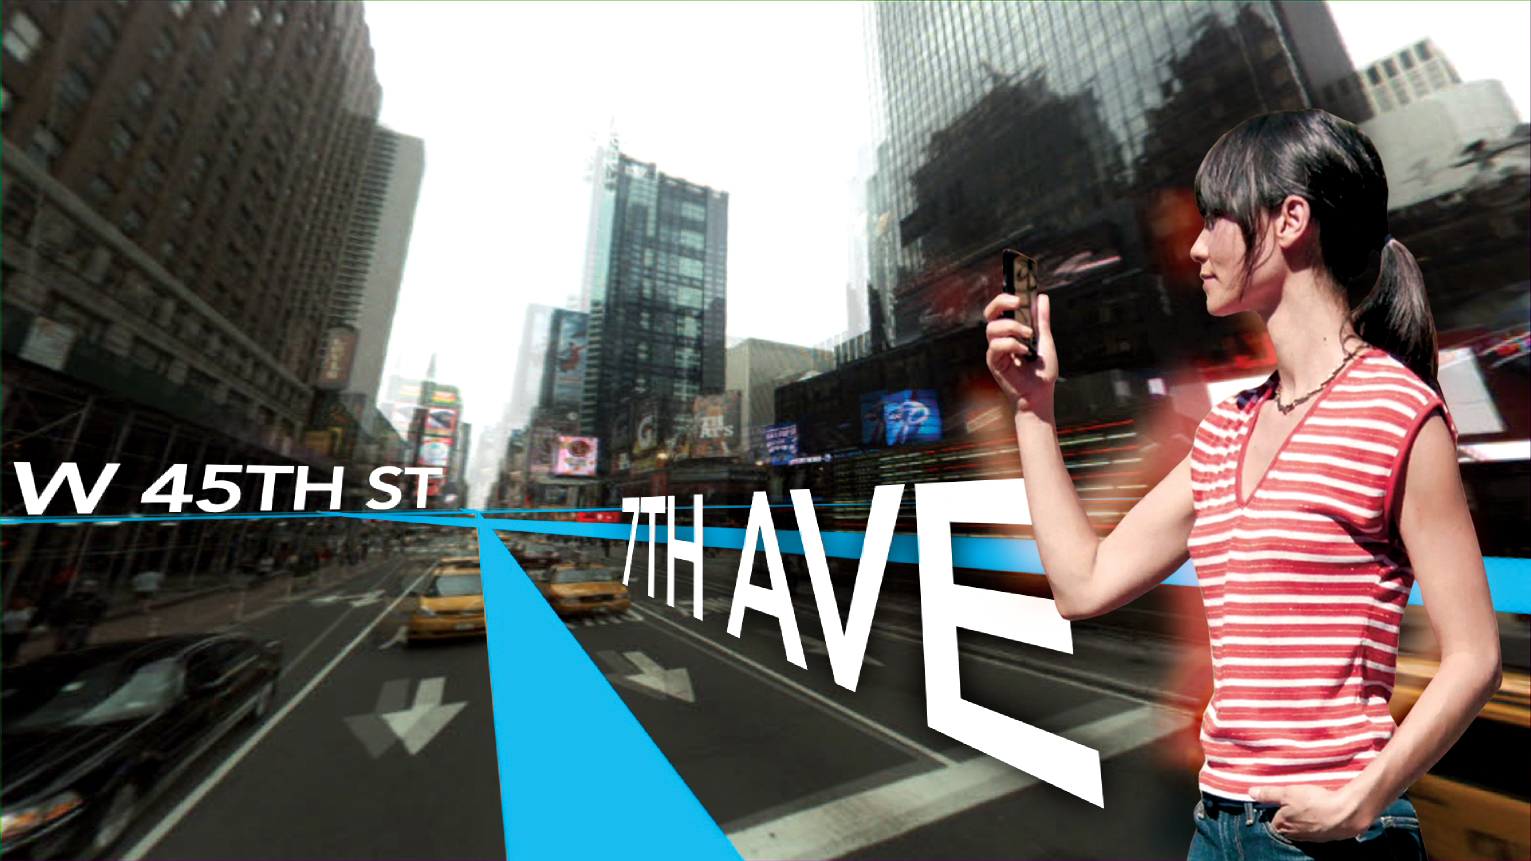
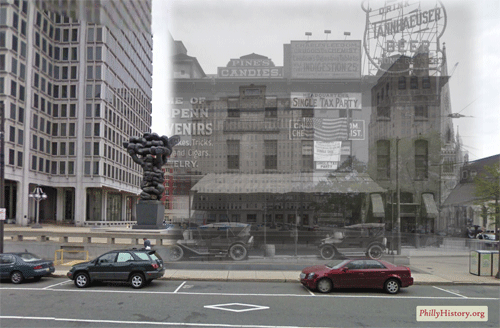
This is the first in a series of posts about several exciting new projects that my old friends and Philly GIS happy hour buddies are up to at Azavea.  The first is funded by an NEH Digital Humanities Start-Up Grant that was awarded to the Philadelphia Department of Records to create a smartphone app that will enable users to view historic photos from PhillyHistory.org draped over the current modern-day landscape.

If the research proved successful, users would be able to point their smartphones, using the camera view, at a building or other location and see historic images of that same location.  The photos would be accompanied by descriptive information from PhillyHistory.org with additional explanatory text provided by local historians.  This combination of technology and history could be a powerful tool for showing the lengthy and interesting history of Philadelphia.

Click here to read more about the project.  Azavea expects to make the app (for iPhones and phones running Android) available as a free download sometime in the next few months.  A white paper about the project will also be released this spring and could hopefully serve as both inspiration and a springboard for faculty and/or student projects at Bucknell (where we have a wealth of historical images and GIS data for Lewisburg). Click here to read a blog post from Azavea Atlas about other examples of the use of augmented reality in cultural institutions.
Categories
General GIS GIS in Geography Slideshow

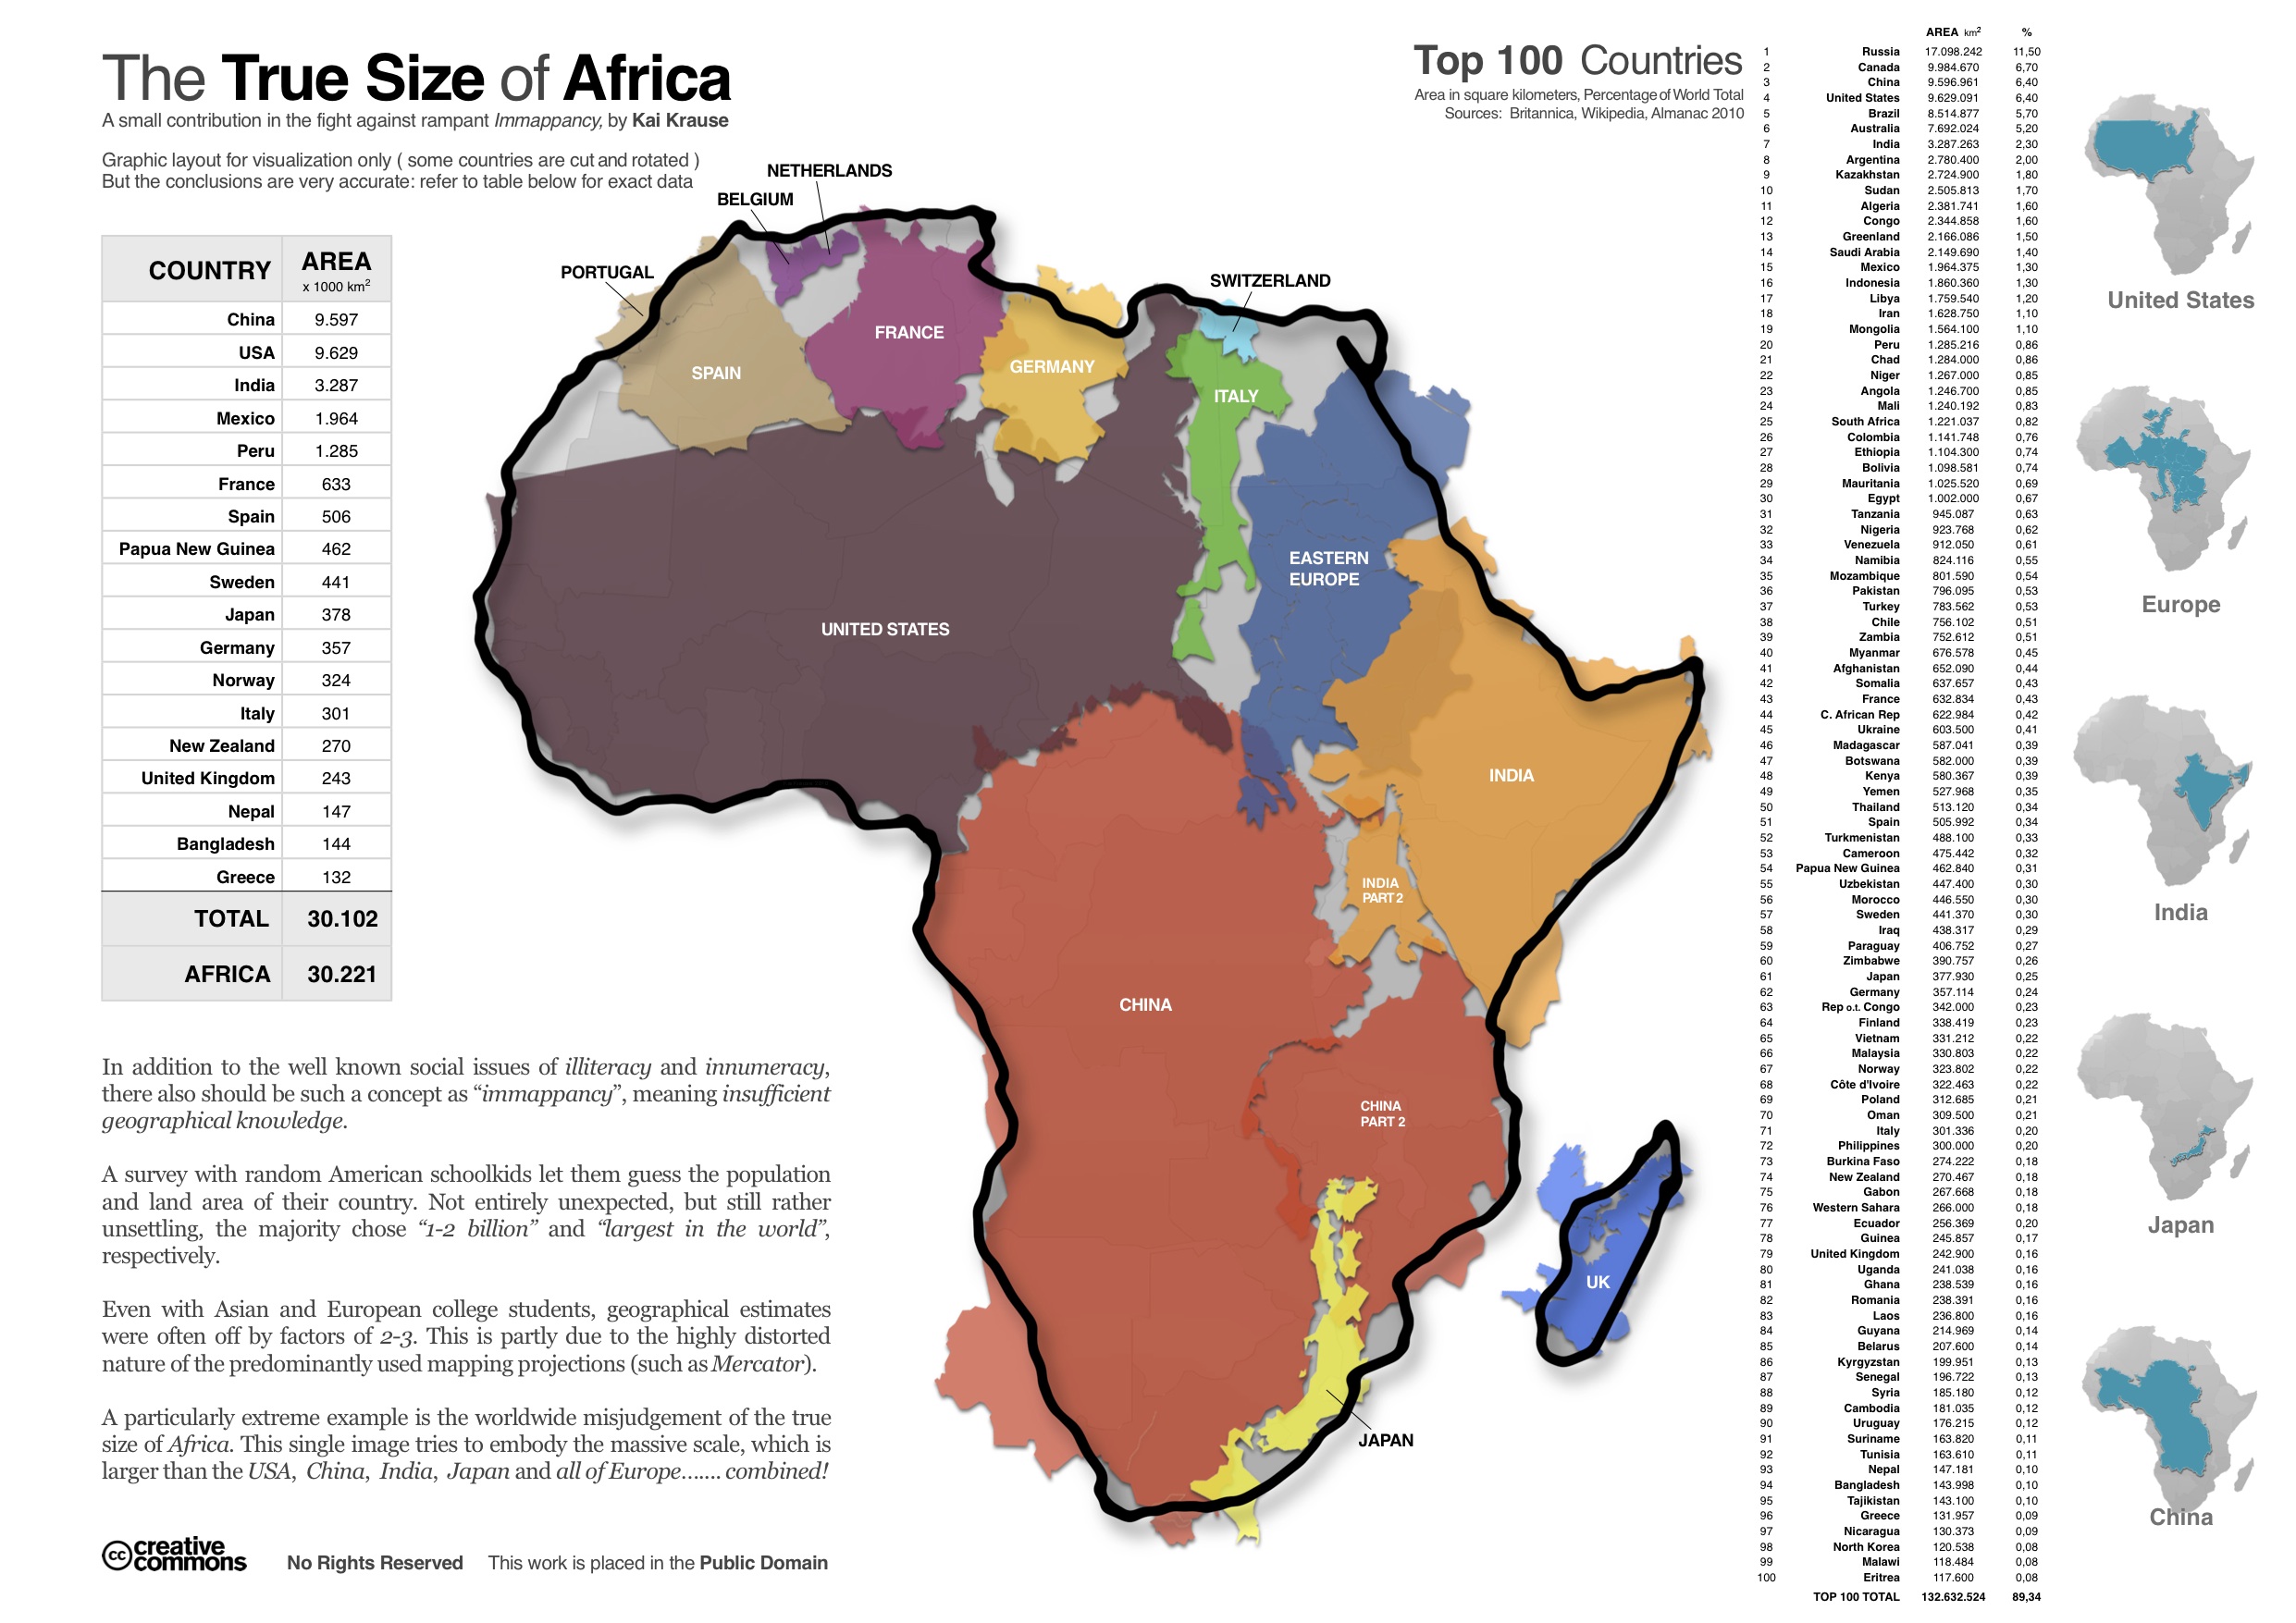
More about scale: the true size of Africa

Here’s another in a series (see here and here) of interesting maps that address scale. Created by Kai Krause, the map aims to show the true size of Africa by visualizing all of the countries and regions that could fit inside the continent – including the U.S., China, India, Japan and all of Europe.  Krause calls the map “a small contribution in the fight against rampant immapancy” – or insufficient geographical knowledge.

Categories
Bucknell/Local Interest Crisis-Mapping General GIS GIS in Political Science GIS in Public Health Slideshow Videos

Penn State releases episode 3 of “Geospatial Revolution” series

A new episode of Penn State’s “Geospatial Revolution” project was released today.  With the tagline “the location of anything is becoming everything” the Geospatial Revolution series is produced by Penn State’s public broadcasting group and described as an “an integrated public service media and outreach initiative about the world of digital mapping and how it is changing the way we think, behave, and interact.”  The new episode – part 3 in a 4 part series – focuses on using GIS for public safety and military/defense purposes. Episode 4 is due out on May 1, 2011. See below for the full-length videos for episodes 1, 2 and 3.  Videos are also available for individual chapters within each episode.

Episode 1:

  • Chapter 1 –  Welcome to the Geospatial Revolution
  • Chapter 2-  A look at what GPS is and how it works
  • Chapter 3 – A timeline of mapping and geospatial technology from stones to phones, including mobile technologies
  • Chapter 4 – A look at how crisis mapping and global crowd-sourcing was critical to aid and rescue during the 2010 Haiti earthquake

httpv://www.youtube.com/watch?v=poMGRbfgp38

Episode 2:

  • Chapter 1 – Creating an interactive city
  • Chapter 2 – Powering business
  • Chapter 3 – Finding a healthy future

httpv://www.youtube.com/watch?v=GXS0bsR0e7w

Episode 3:

  • Chapter 1 – Mapping the road to peace
  • Chapter 2 – Waging modern war
  • Chapter 3 – Serving and protecting
  • Chapter 4 – Staying safe

httpv://www.youtube.com/watch?v=OePOK6nzcaY

Categories
Bucknell/Local Interest Environment General GIS GIS in Geology Marcellus Shale Slideshow

NYT map graphic on toxic contamination from natural gas wells

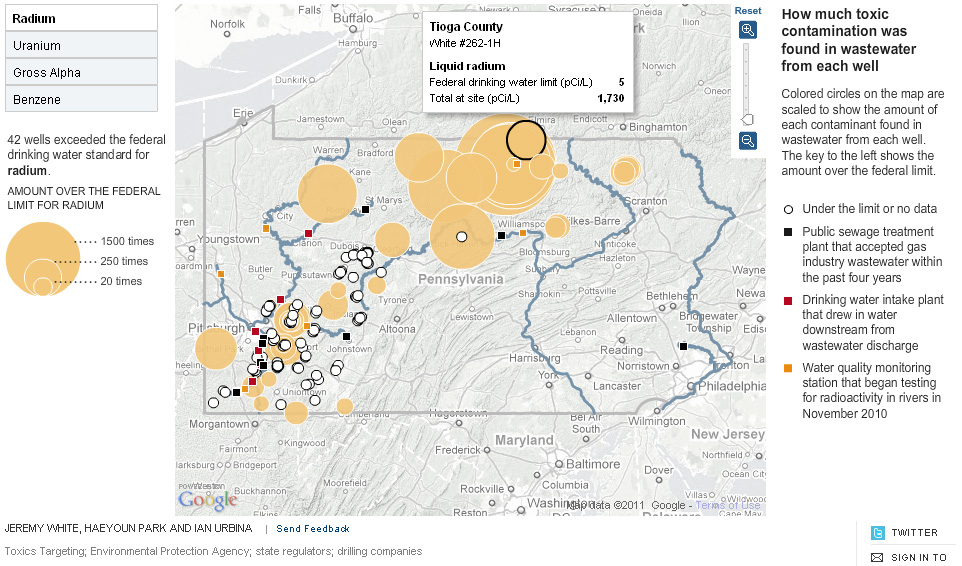
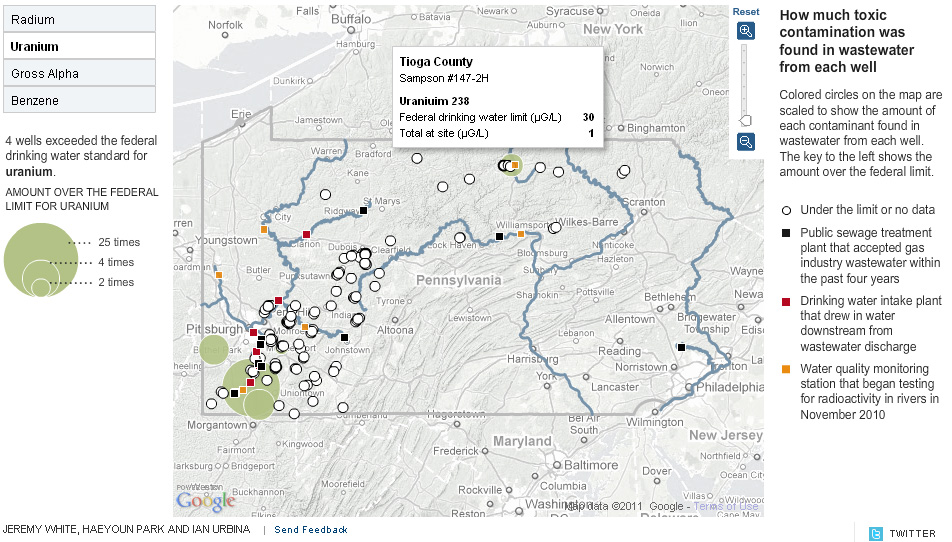
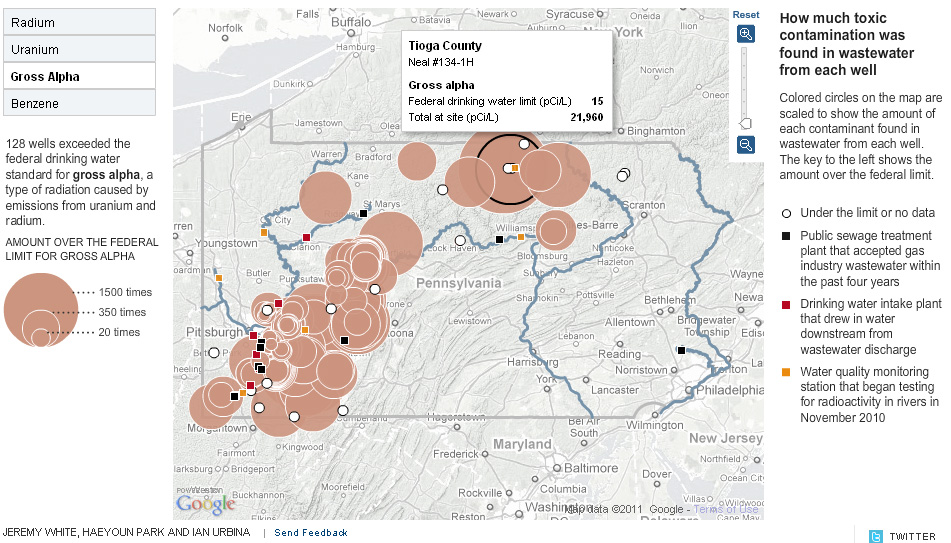
The New York Times has put out a new interactive map graphic that visualizes toxic contamination found in the wastewater from natural gas wells in PA.  The data – from 149 wells – is visualized by the type of contaminant (radium, uranium, gross alpha and benzene) and the amount by which each well exceeded the federal drinking water standard.  Below are some screenshots from the interactive graphic.

Radium contamination:


Uranium contamination:


Gross alpha contamination:


Benzene contamination:


Categories
Bucknell/Local Interest General GIS GIS in Environmental Studies GIS in Geography Slideshow

Bucknell student uses ArcGIS in research on sleeping sickness

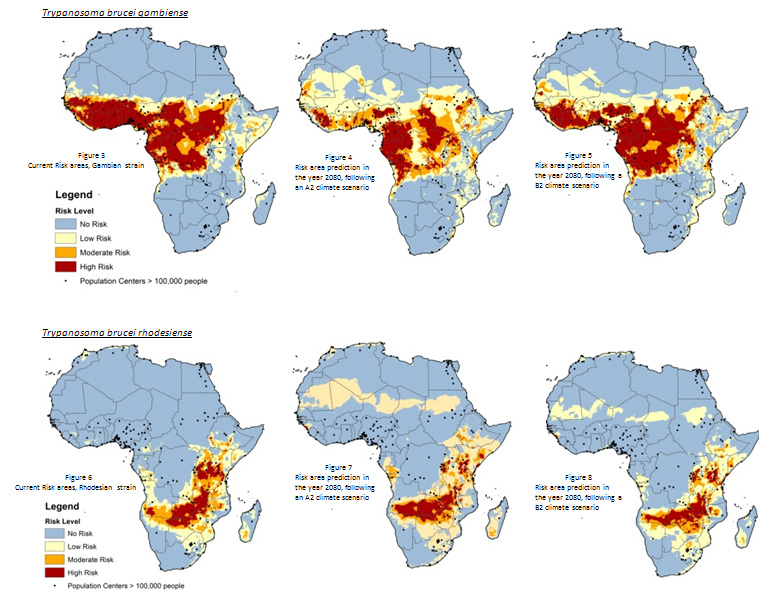
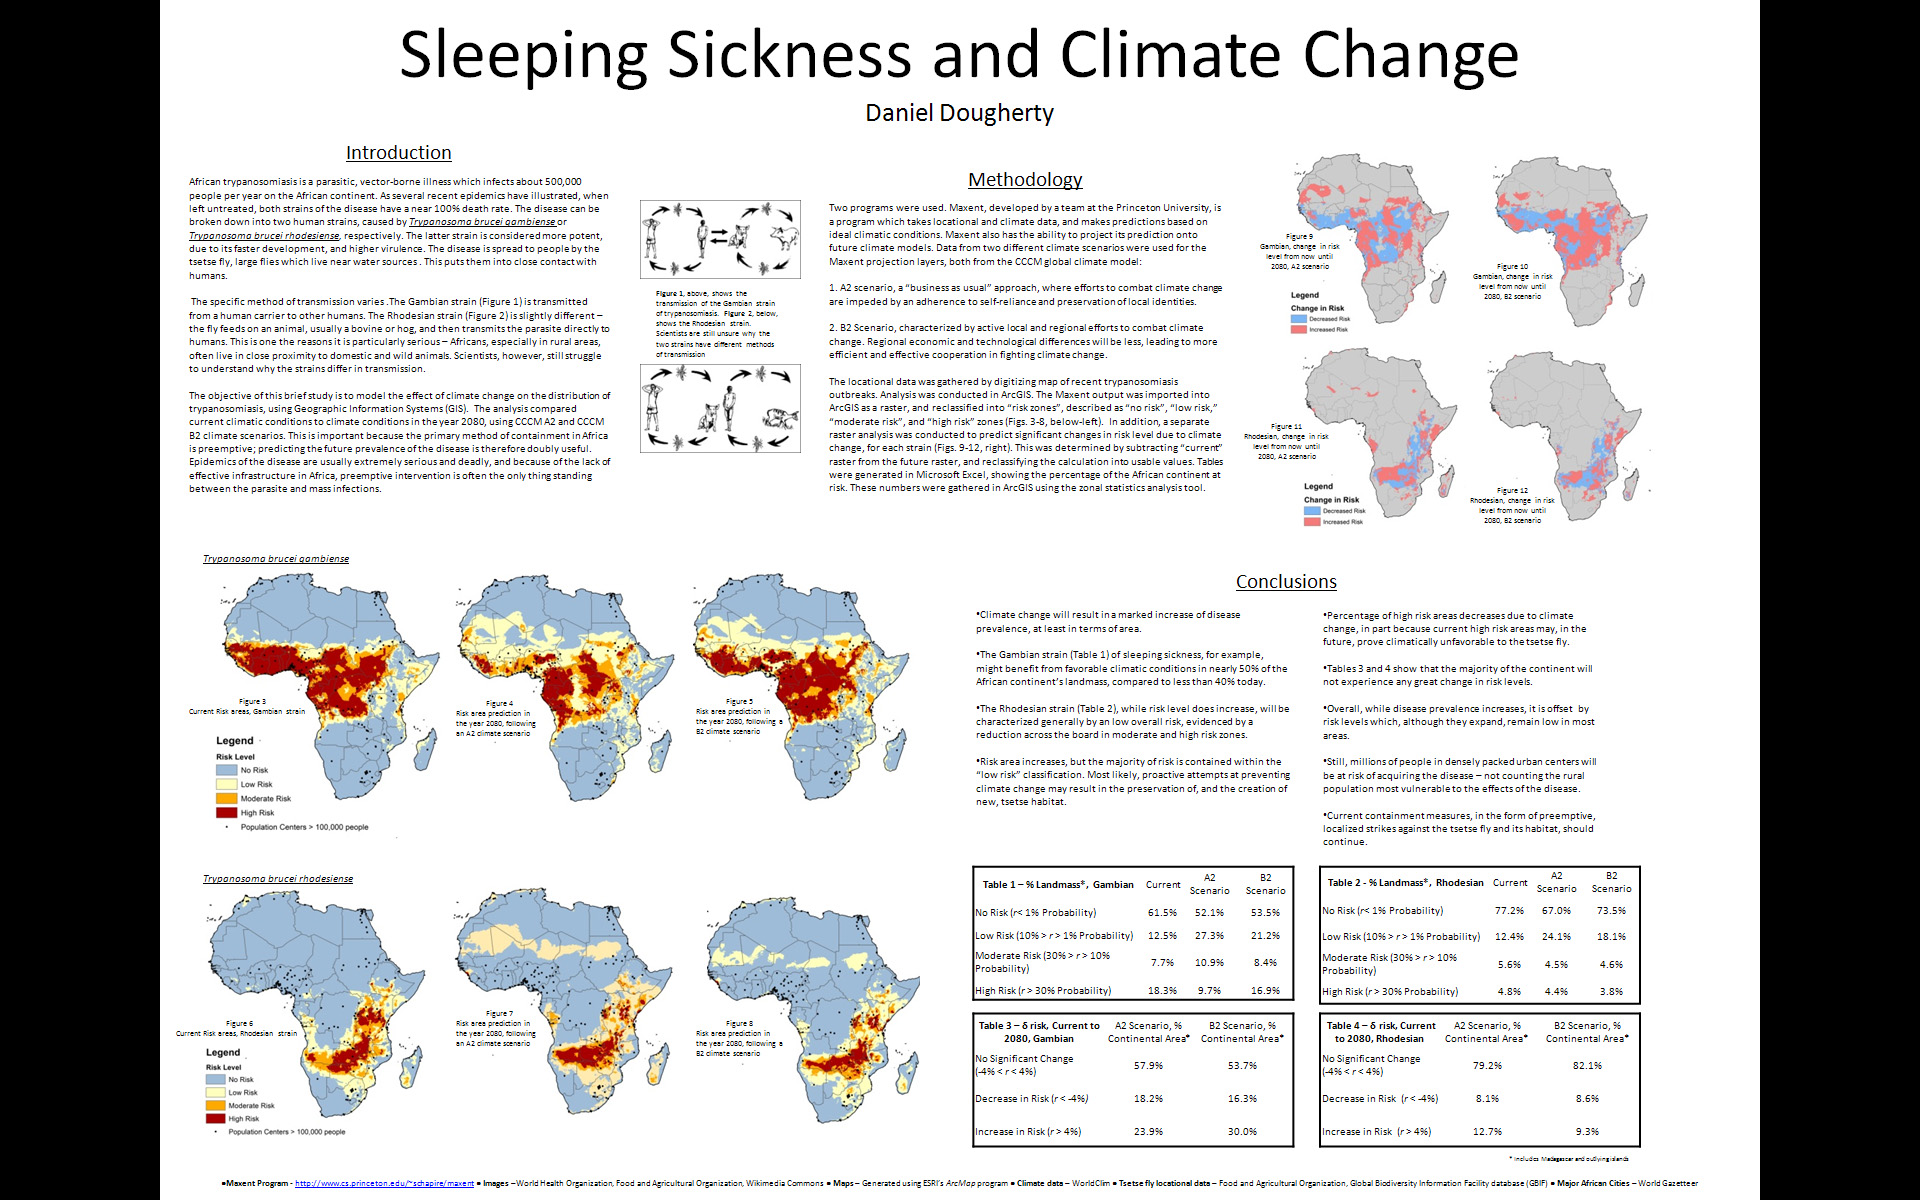
Below is an interview with Daniel Dougherty ’12, a History and Geography major, discussing his use of GIS for an analysis of the impact of climate change on sleeping sickness.  The research project was conducted as part of Prof. Duane Griffin’s Geography 204 course Applied GIS. In the interview, Dougherty describes the data and methodology he used for the project and talks about some of the conclusions he drew from his analysis.

httpv://www.youtube.com/watch?v=UsJf29_Mujw

The images below show some of the maps Dougherty was able to produce using ArcGIS, MaxEnt and data from WorldClim.