Categories
Bucknell/Local Interest Digital Humanities Environment General GIS GIS in Environmental Studies Marcellus Shale Slideshow

GIS in the Classroom (and dorms): Environmental Residential College

In fall 2011, Professors Steve Jordan and Chris Daniels assigned a semester-long documentary project to students in Bucknell’s Environmental Residential College. The goal was to create video essays to tell the story of how the Marcellus Shale gas boom is impacting communities in northeastern Pennsylvania. Students visited communities impacted by the gas boom to conduct interviews and capture video footage that would help them tell the story of the local contexts in which the gas boom is taking place across the state.

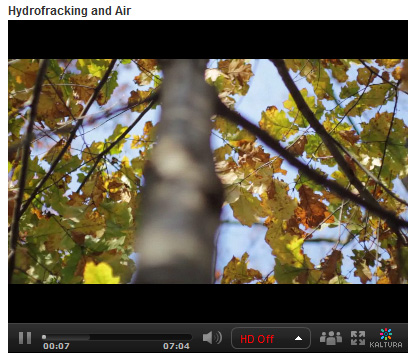
In addition to other research methods, the teams of students used GIS to explore the spatial footprint of the gas boom on different communities. Students were tasked with integrating the spatial aspect of the story into their video essays. The clip below is taken from the ‘Hydrofracking & Air’ video created by students Zoe Gaston, Claire Rapp, Sarah Baker, Thuyvan Luu, Colin Lind and Kyle Montgomery – all first-year students in Bucknell’s Environmental Residential College.

video platform video management video solutions video player

To create the map animation seen in the video, the students worked with me to visualize GIS data in ArcMap and export the data to a GoogleEarth KML format. Next, the students used GoogleEarth to draw the estimated pathway of the pipeline connecting several air compressor stations in their area of interest. Then the students created an animation in GoogleEarth that was spliced into the video essay to illustrate the point they were trying to make about air pollution associated with natural gas infrastructure. By the way… in a few months Bucknell GIS expects to have data on all infrastructure related to natural gas and electricity generation in Pennsylvania – including pipelines and transmission lines (so that next time we’ll be able to be more precise than we were with the ‘connect the dot’ approach we employed in this video).

Click here to see the full-length ‘Hydrofracking & Air’ video and other videos submitted by students in the class.
 

Categories
Bucknell/Local Interest Environment General GIS GIS in Geology Marcellus Shale Slideshow

Mapping Marcellus Shale Flowback Water Chemistry

Guest post by Darin Rockwell, Geography/Geology ’13

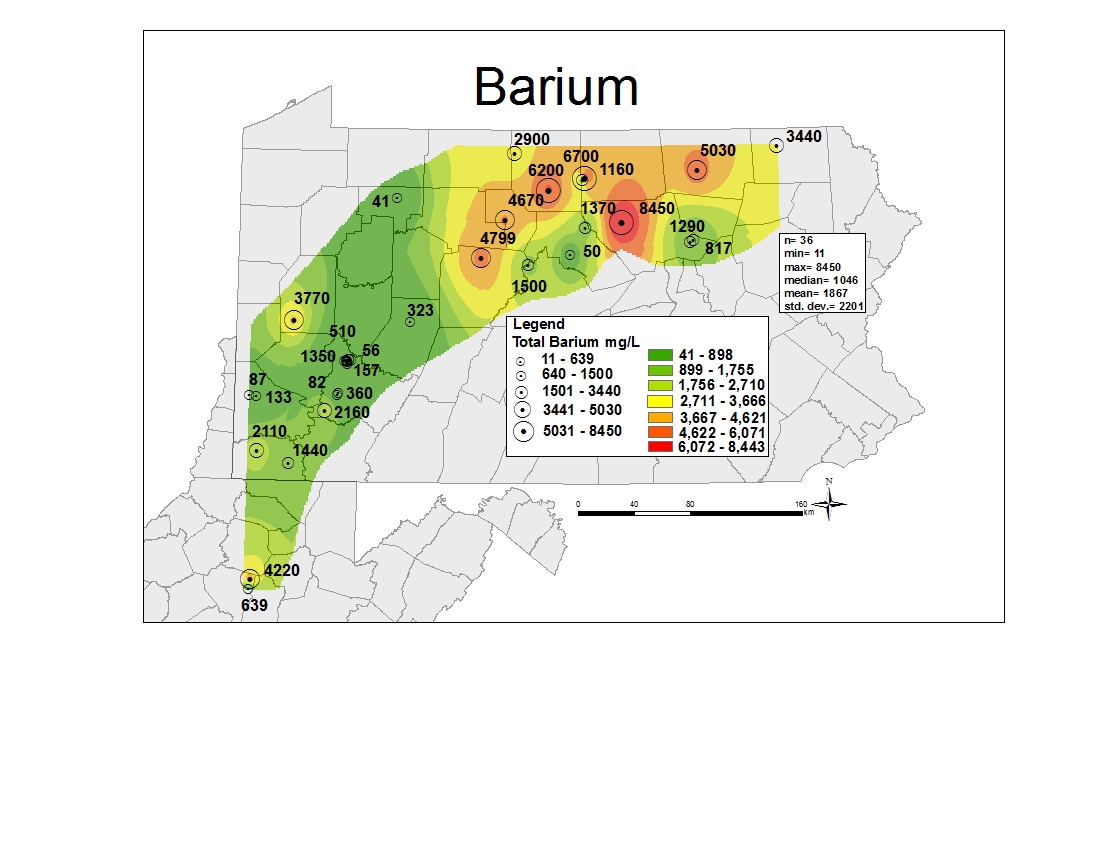
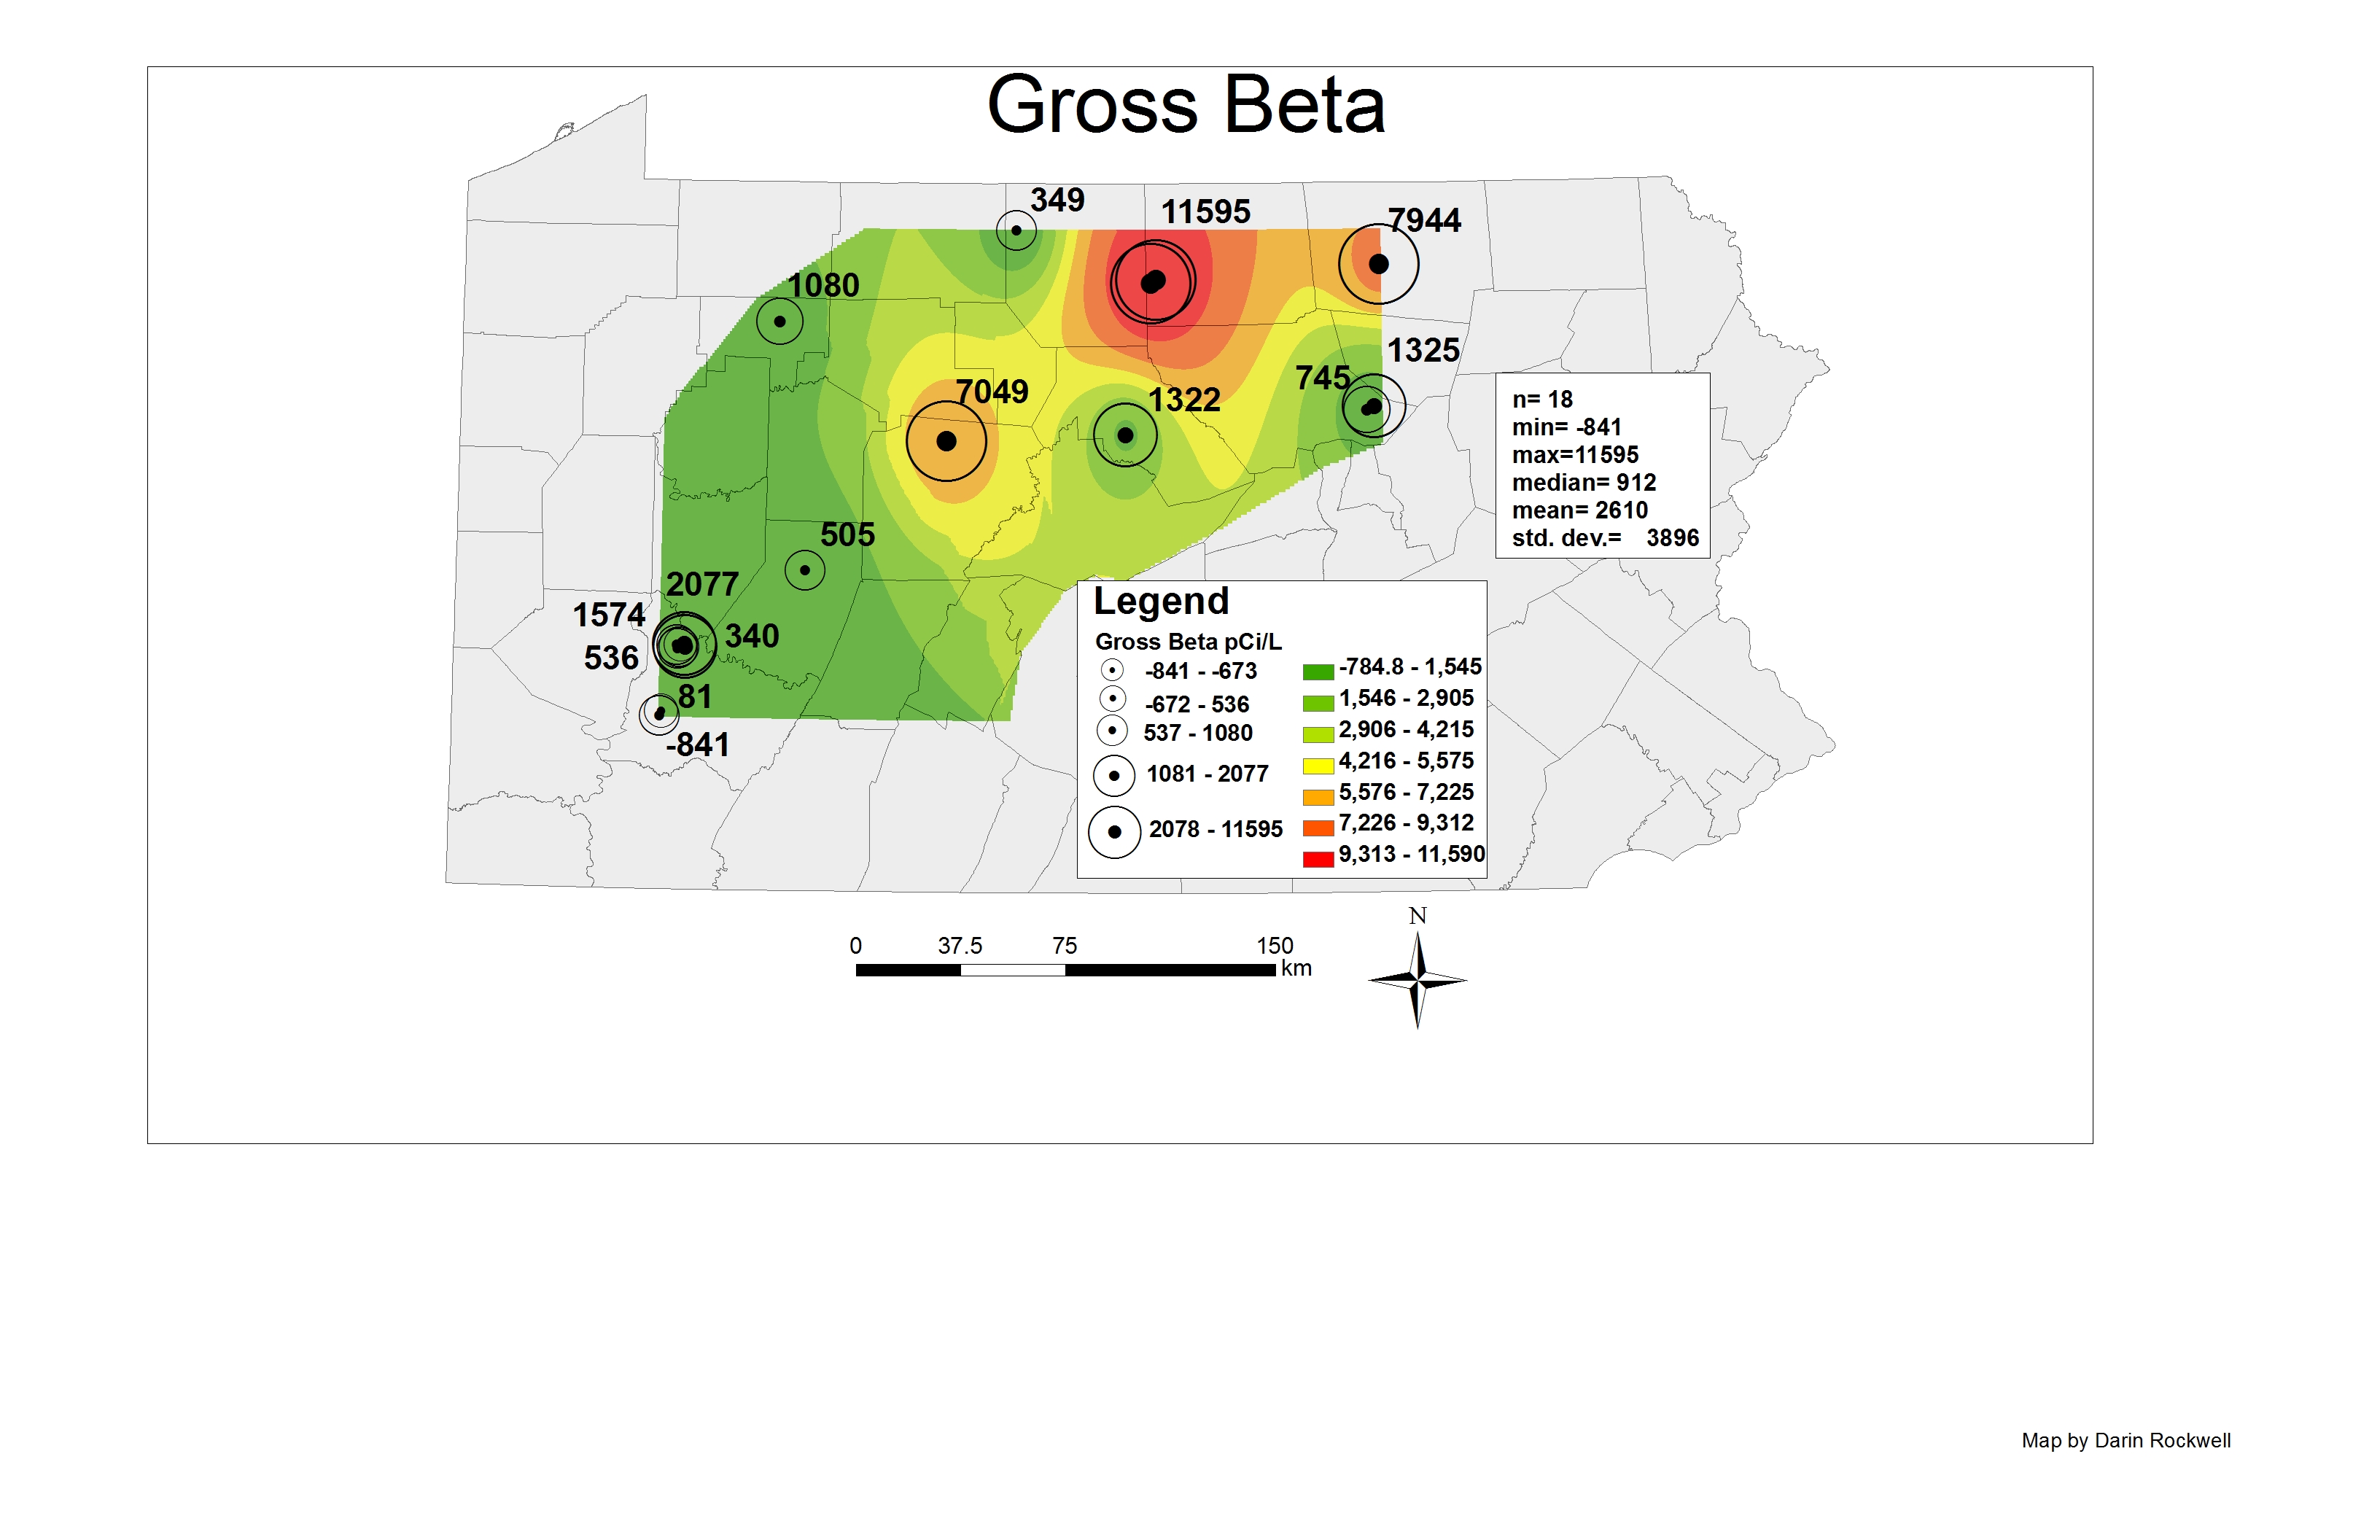
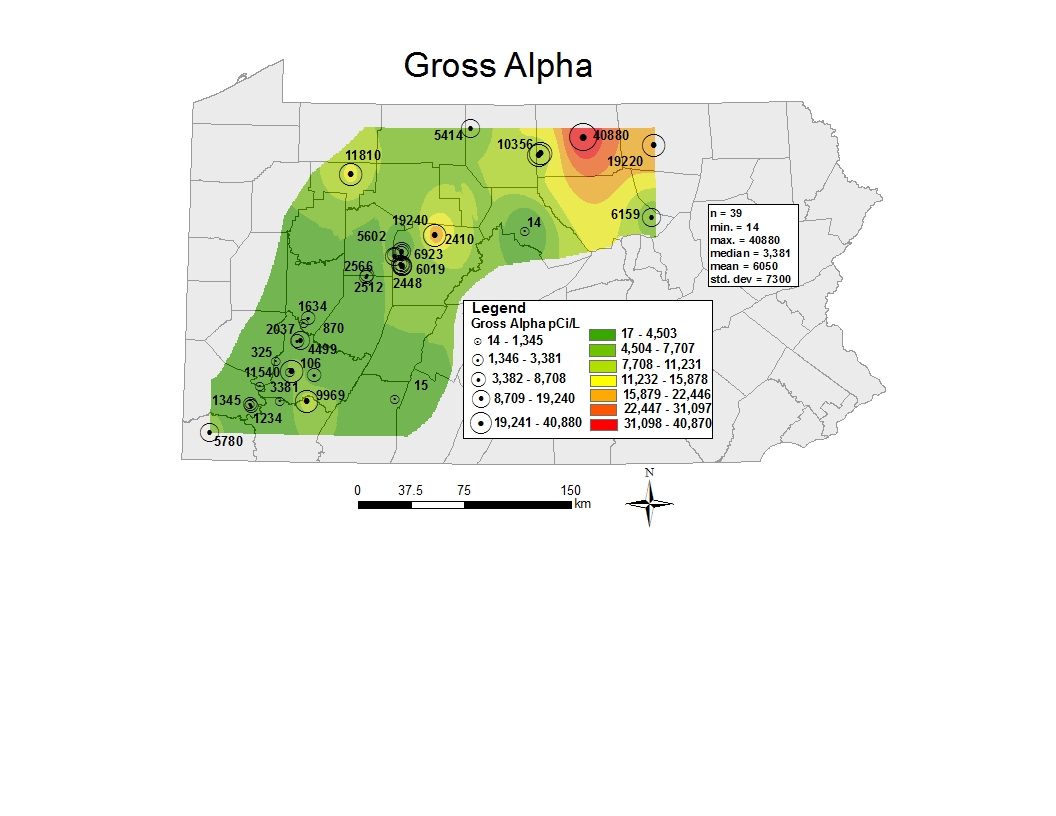
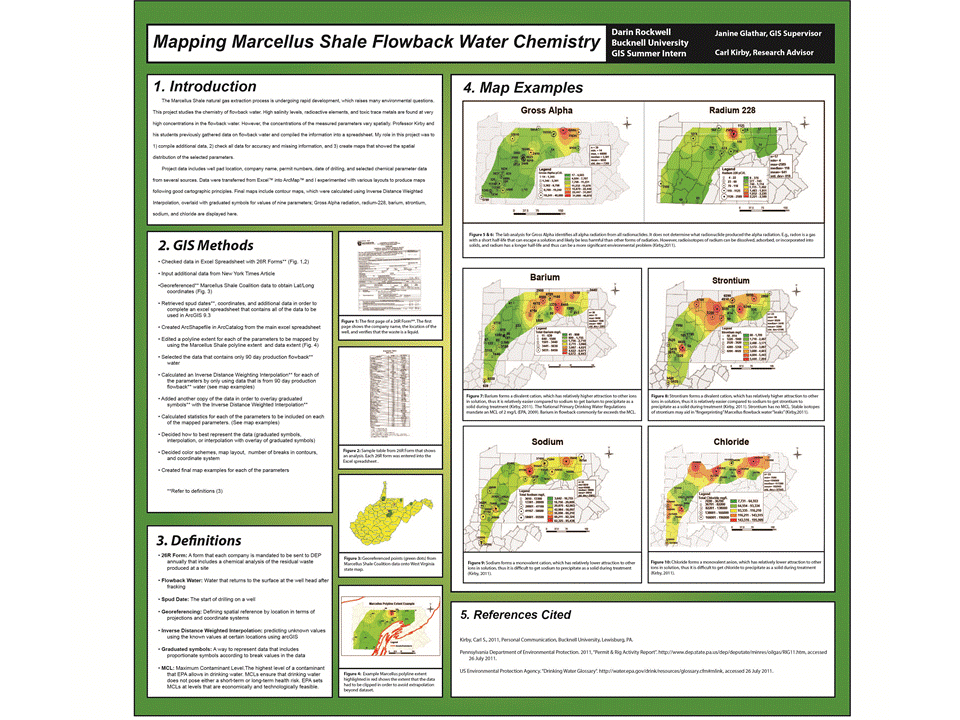
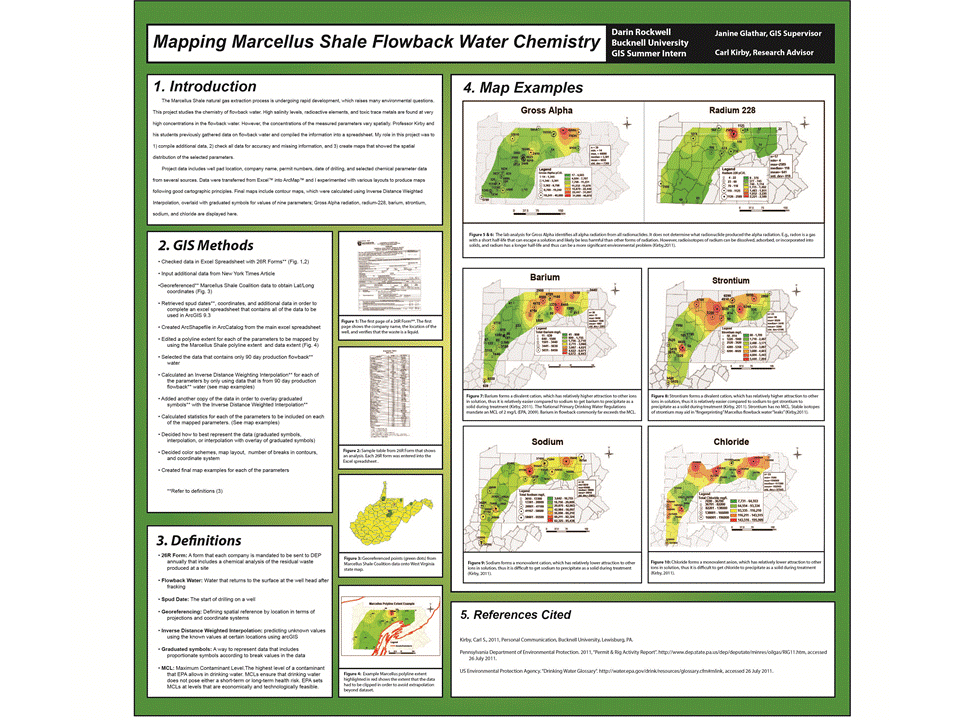
The Marcellus Shale natural gas extraction process is undergoing rapid development, which raises many environmental questions. This project studies the chemistry of flowback water[1]. High salinity levels, radioactive elements, and toxic trace metals are   found at very high concentrations in the flowback water. However, the concentrations of the measured parameters vary spatially. Professor Kirby and his students previously gathered data on flowback water and compiled the information into a spreadsheet.


My role in this project was to:

  1) compile additional data

  2) check all data for accuracy and missing information

  3) create maps that showed the spatial distribution of the selected parameters.


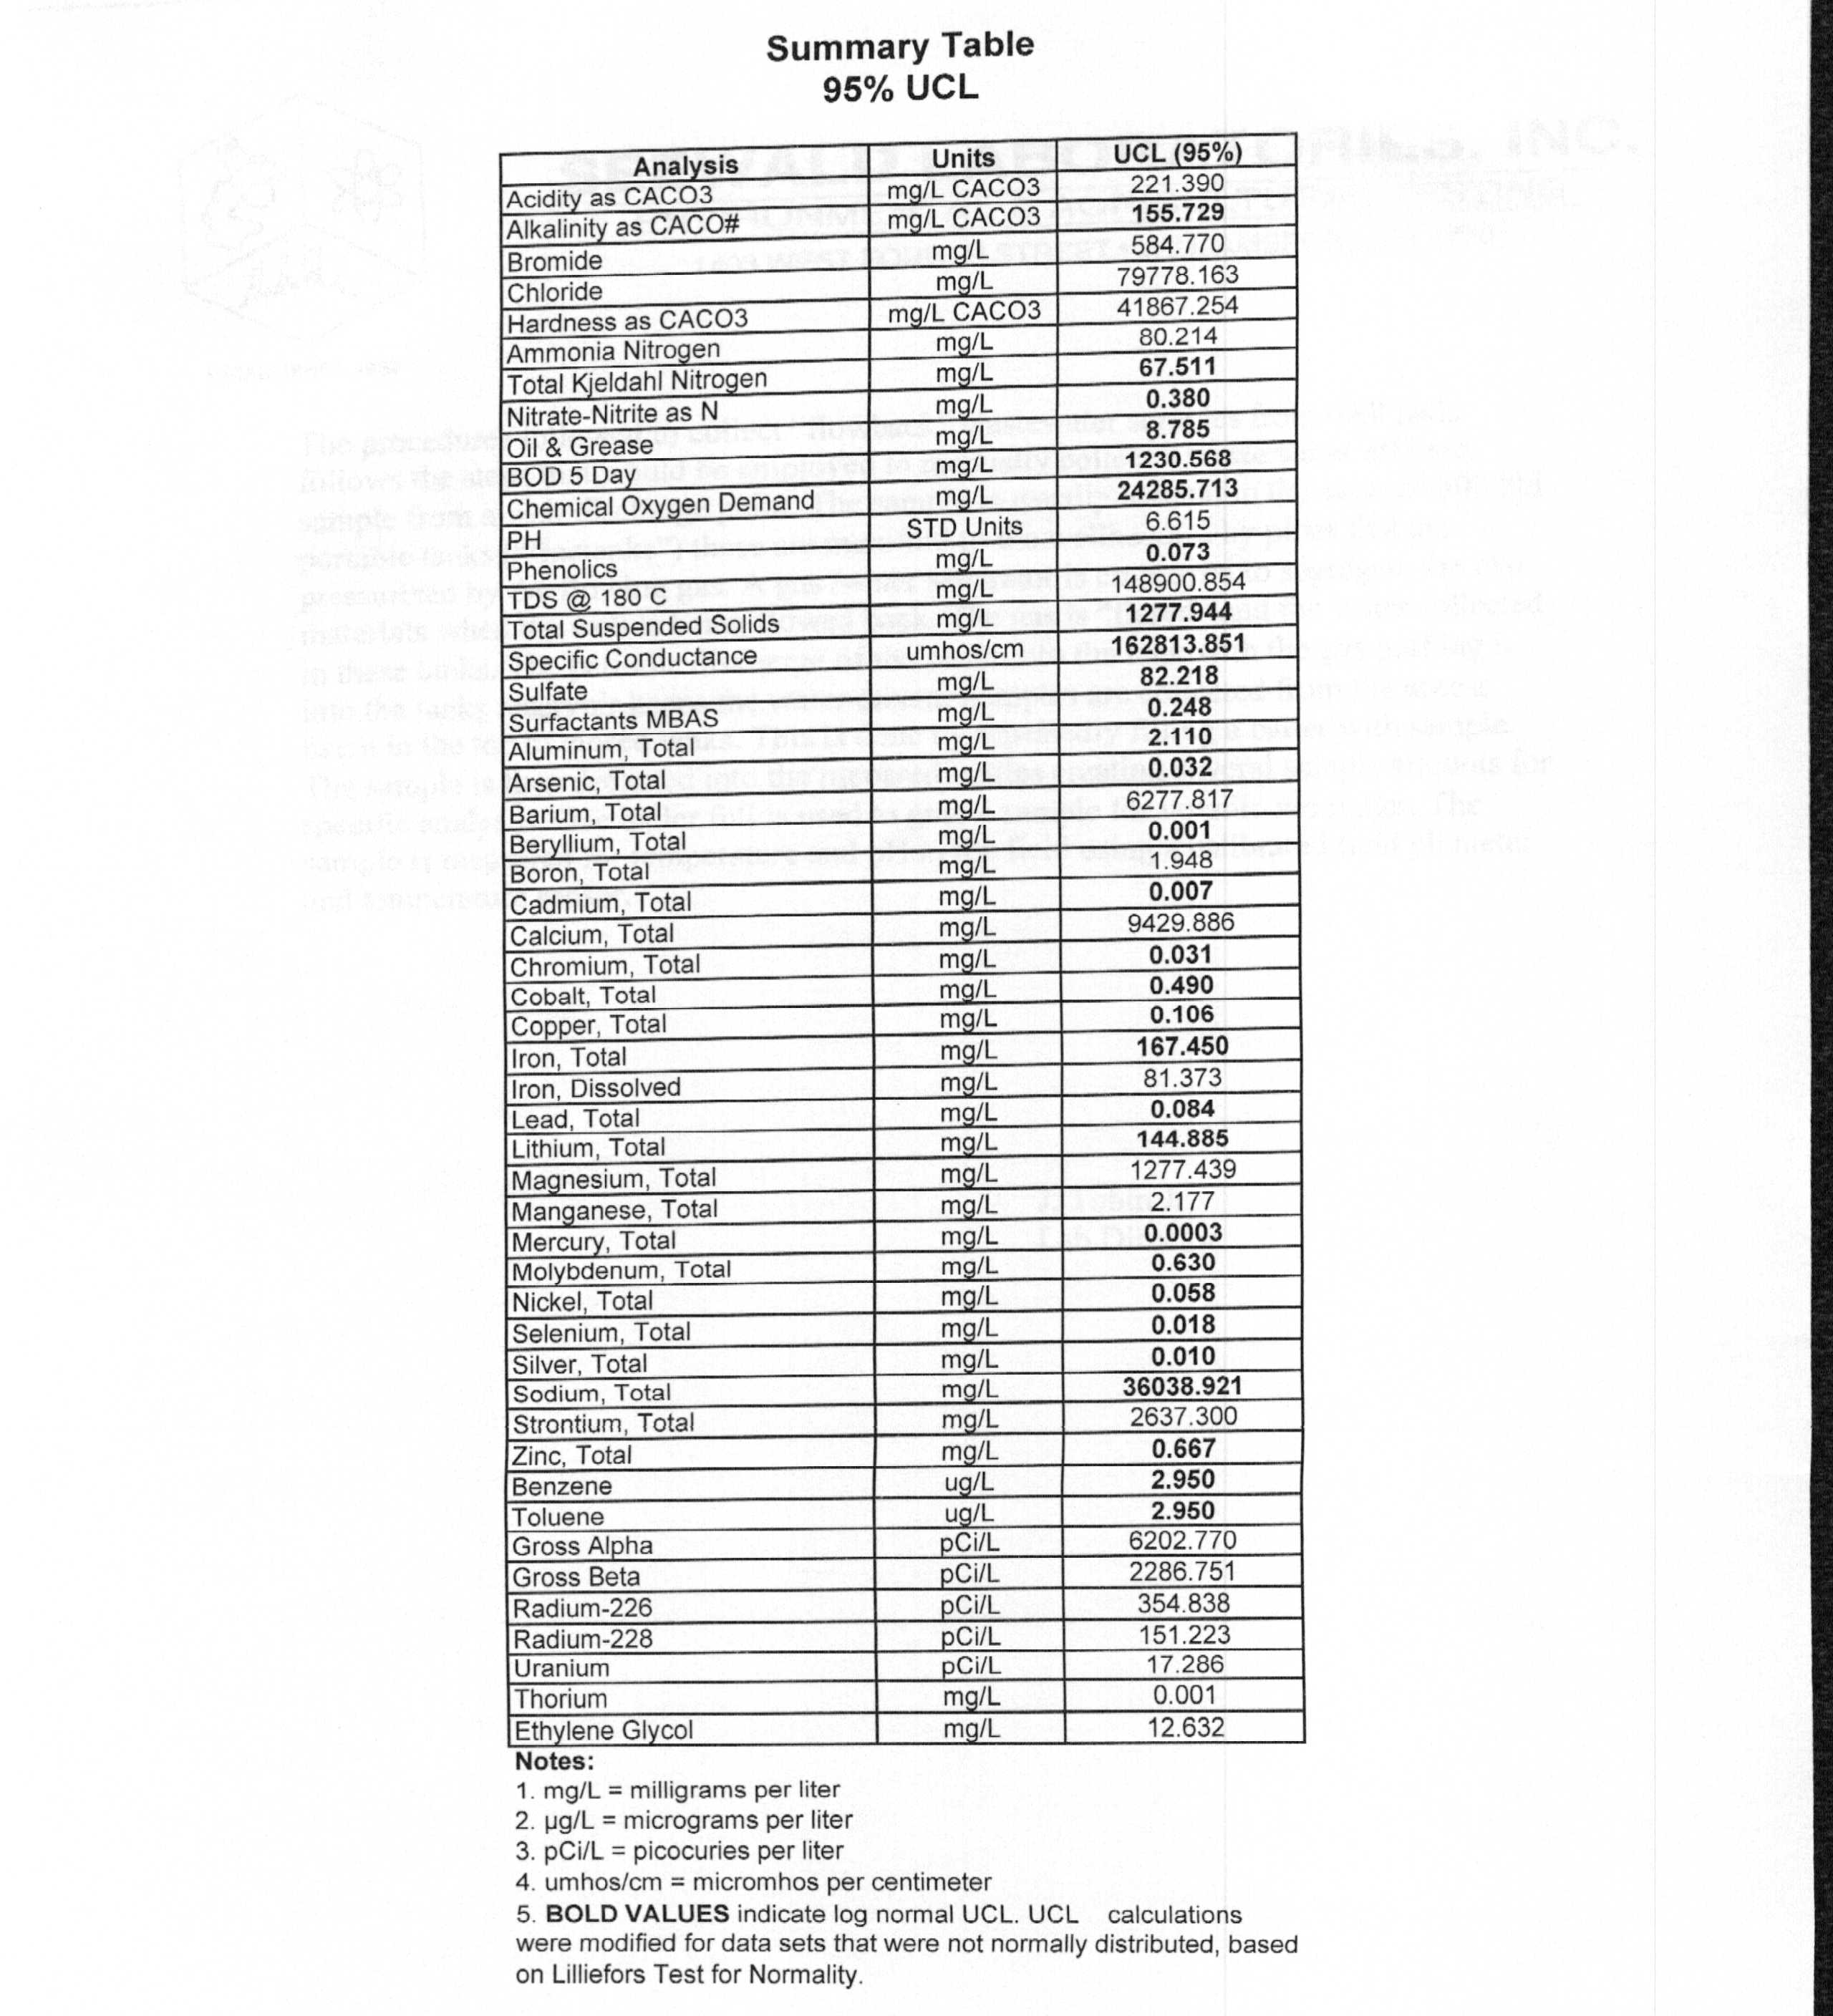
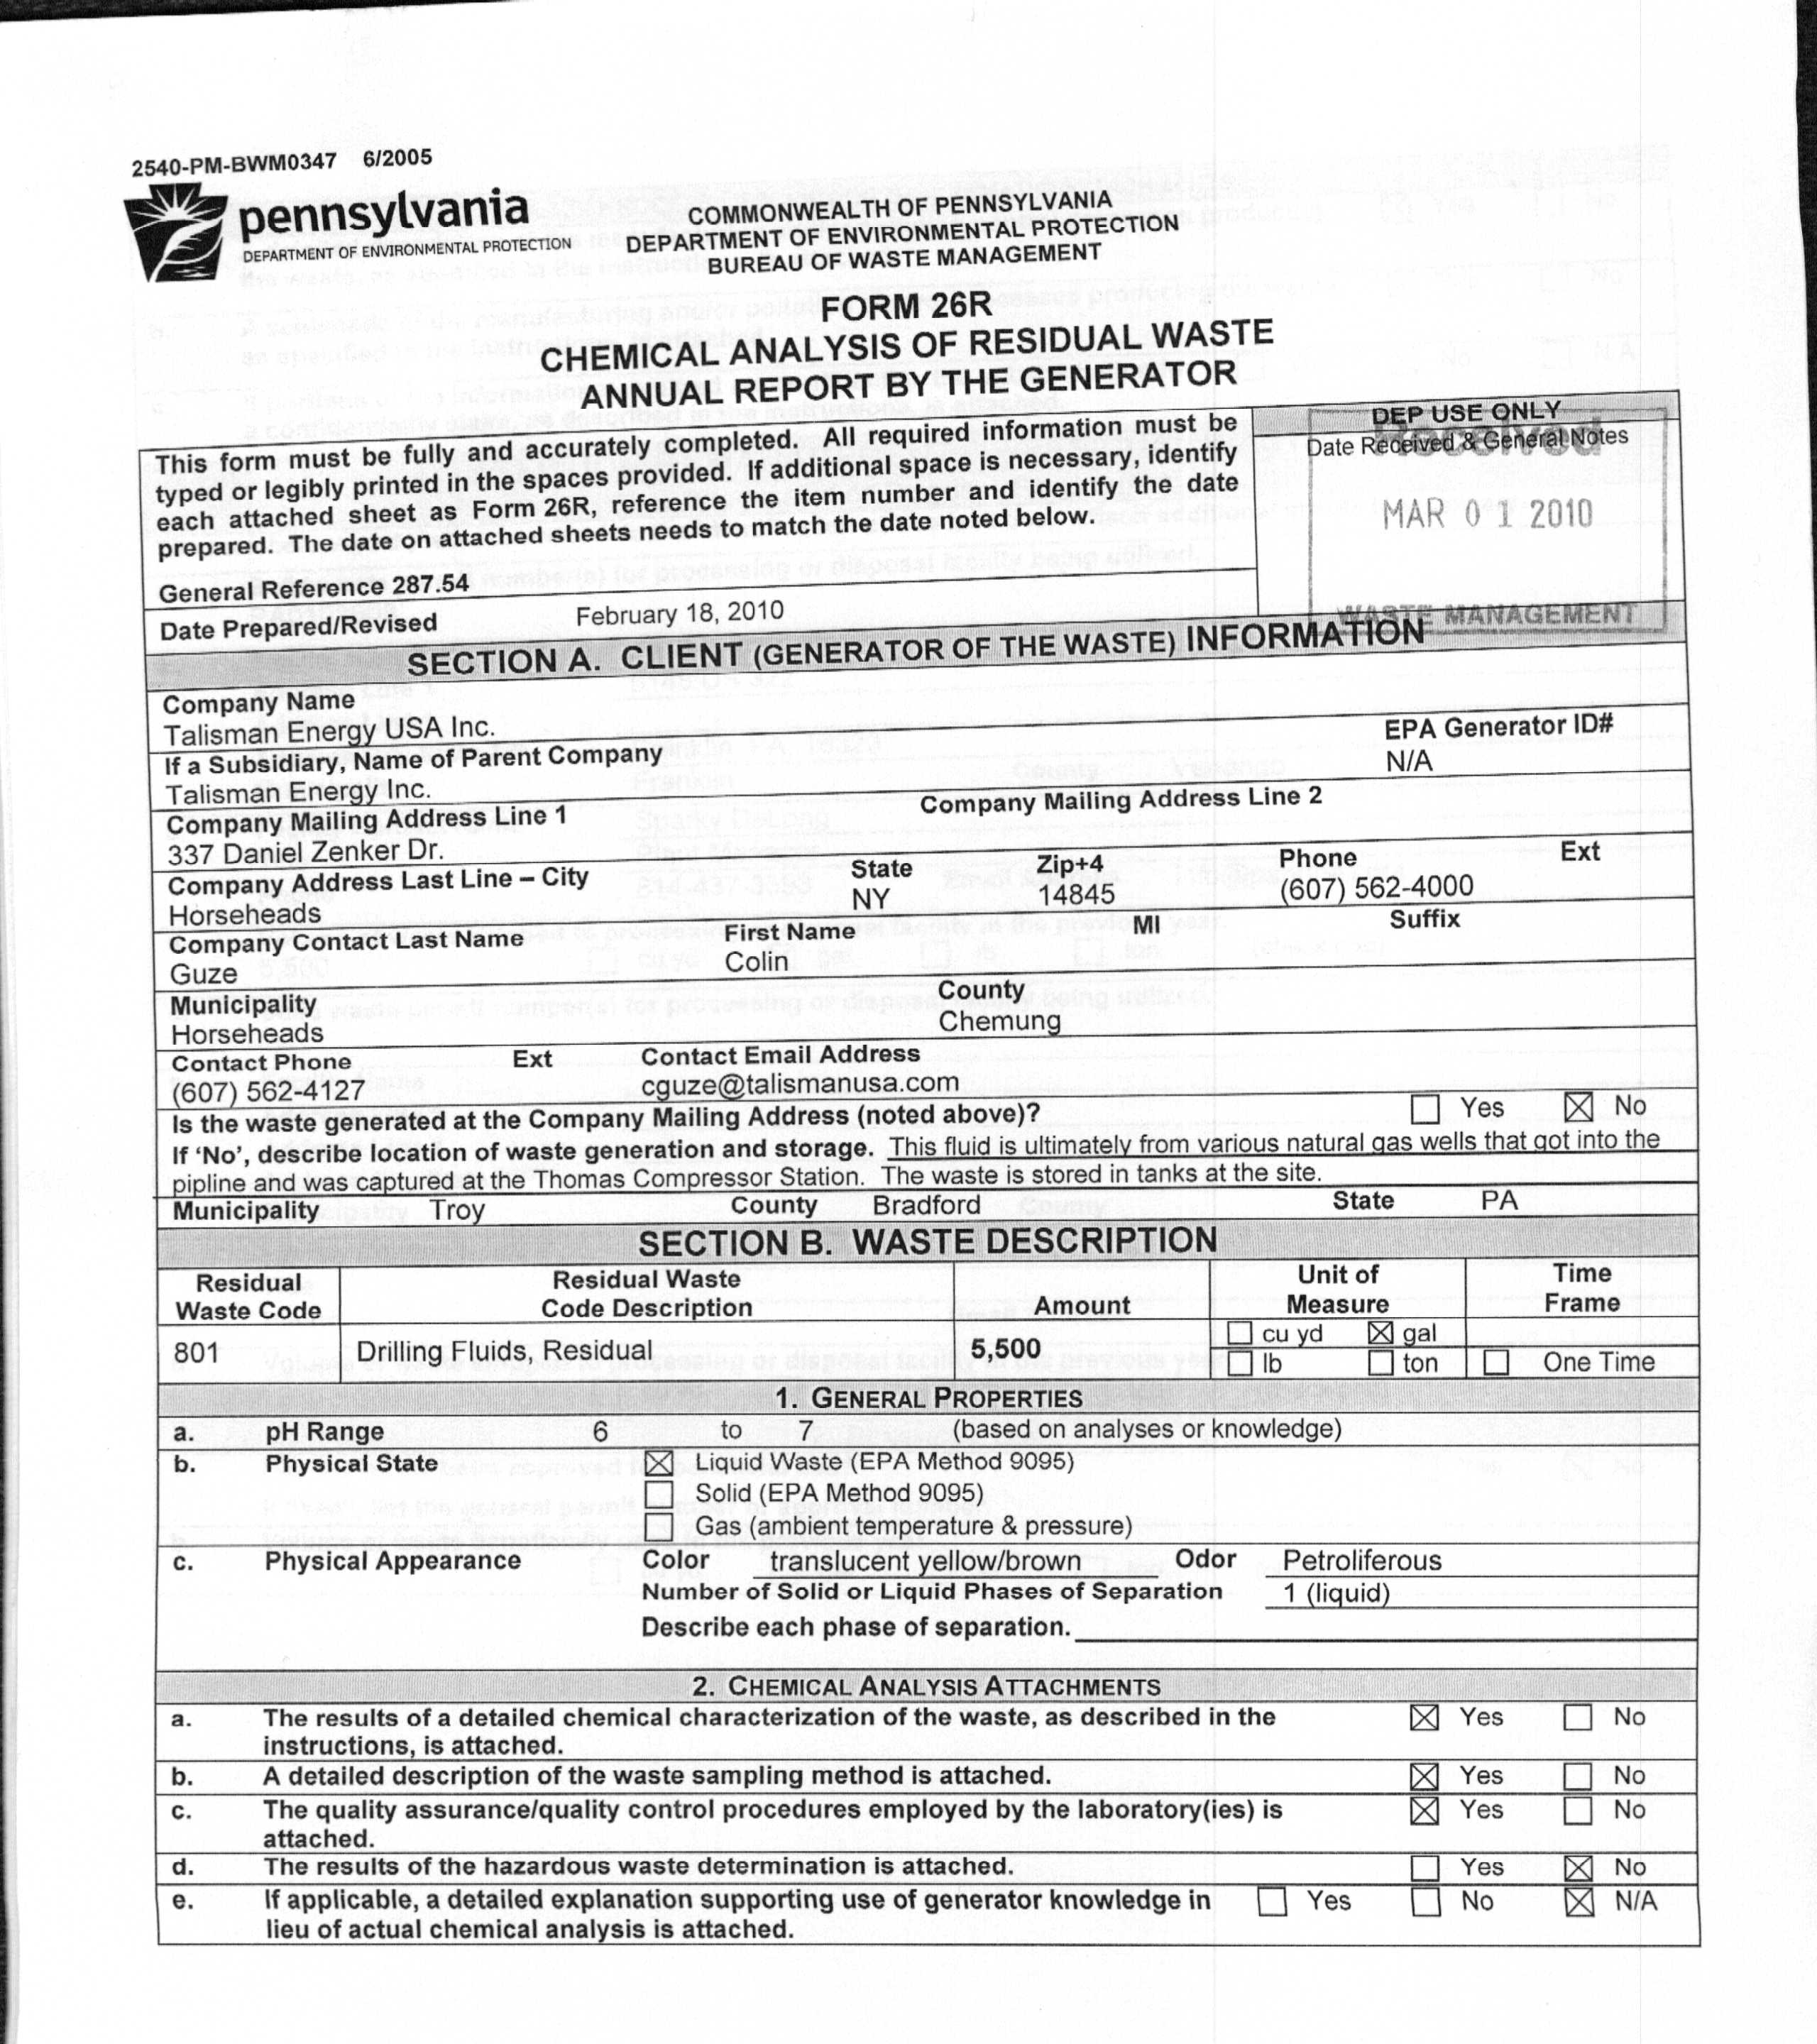
Project data includes well pad location, company name, permit numbers, date of drilling, and selected chemical parameter data from several sources. Sources include data from 26R forms[2] and a New York Times article. Data were transferred from Excel™ into ArcMap™. Data was narrowed down to only 90 day production data. 90 day production data is used due to the comparison of the 26R form analysis dates and spud dates[3]. The date differences seemed to mostly fall around 90 days. Latitude and longitude coordinates were retrieved from data on the Department of Environmental Protection website. For some data, coordinates were unavailable to retrieve. Therefore, I georeferenced[4] points using ArcGis in order to gain xy coordinates. Each parameter is mapped to its own extent in which data is available.

I experimented with various layouts to produce maps following good cartographic principles. Final maps include contour maps, which were calculated using Inverse Distance Weighted Interpolation[5], overlaid with graduated symbols[6] for values of nine parameters; Gross Alpha radiation, Gross Beta radiation, radium-226, radium-228, barium, strontium, sodium, and calcium.  A final poster, 26R forms, and a few  other sample maps are shown at the bottom of this blog post. It is important to note that the parameters are strictly from flowback water from the Marcellus Shale natural gas extraction process and the levels are not necessarily drinking water levels; the values are before treatment.   

Guest Post Darin Rockwell, Geology & Geography Bucknell ’13

______________________________________________________________________________________________________________________________________________________________________

[1] Flowback Water: Water that returns to the surface at the well head after fracking

[2] 26R forms: A form that each company is mandated to be sent to DEP annually that includes a chemical analysis of the residual waste produced at a site

 [3] Spud Dates: The start of drilling on a well

[4] Georeferenced: Defining spatial reference by location in terms of projections and coordinate systems

[5] Inverse Distance Weighted Interpolation: predicting unknown values using the known values at certain locations using arcGIS

[6] Graduated Symbols: A way to represent data that includes proportionate symbols according to break values in the data


Categories
Bucknell/Local Interest Data Digital Humanities Environment Events/Calendar General GIS Marcellus Shale Slideshow

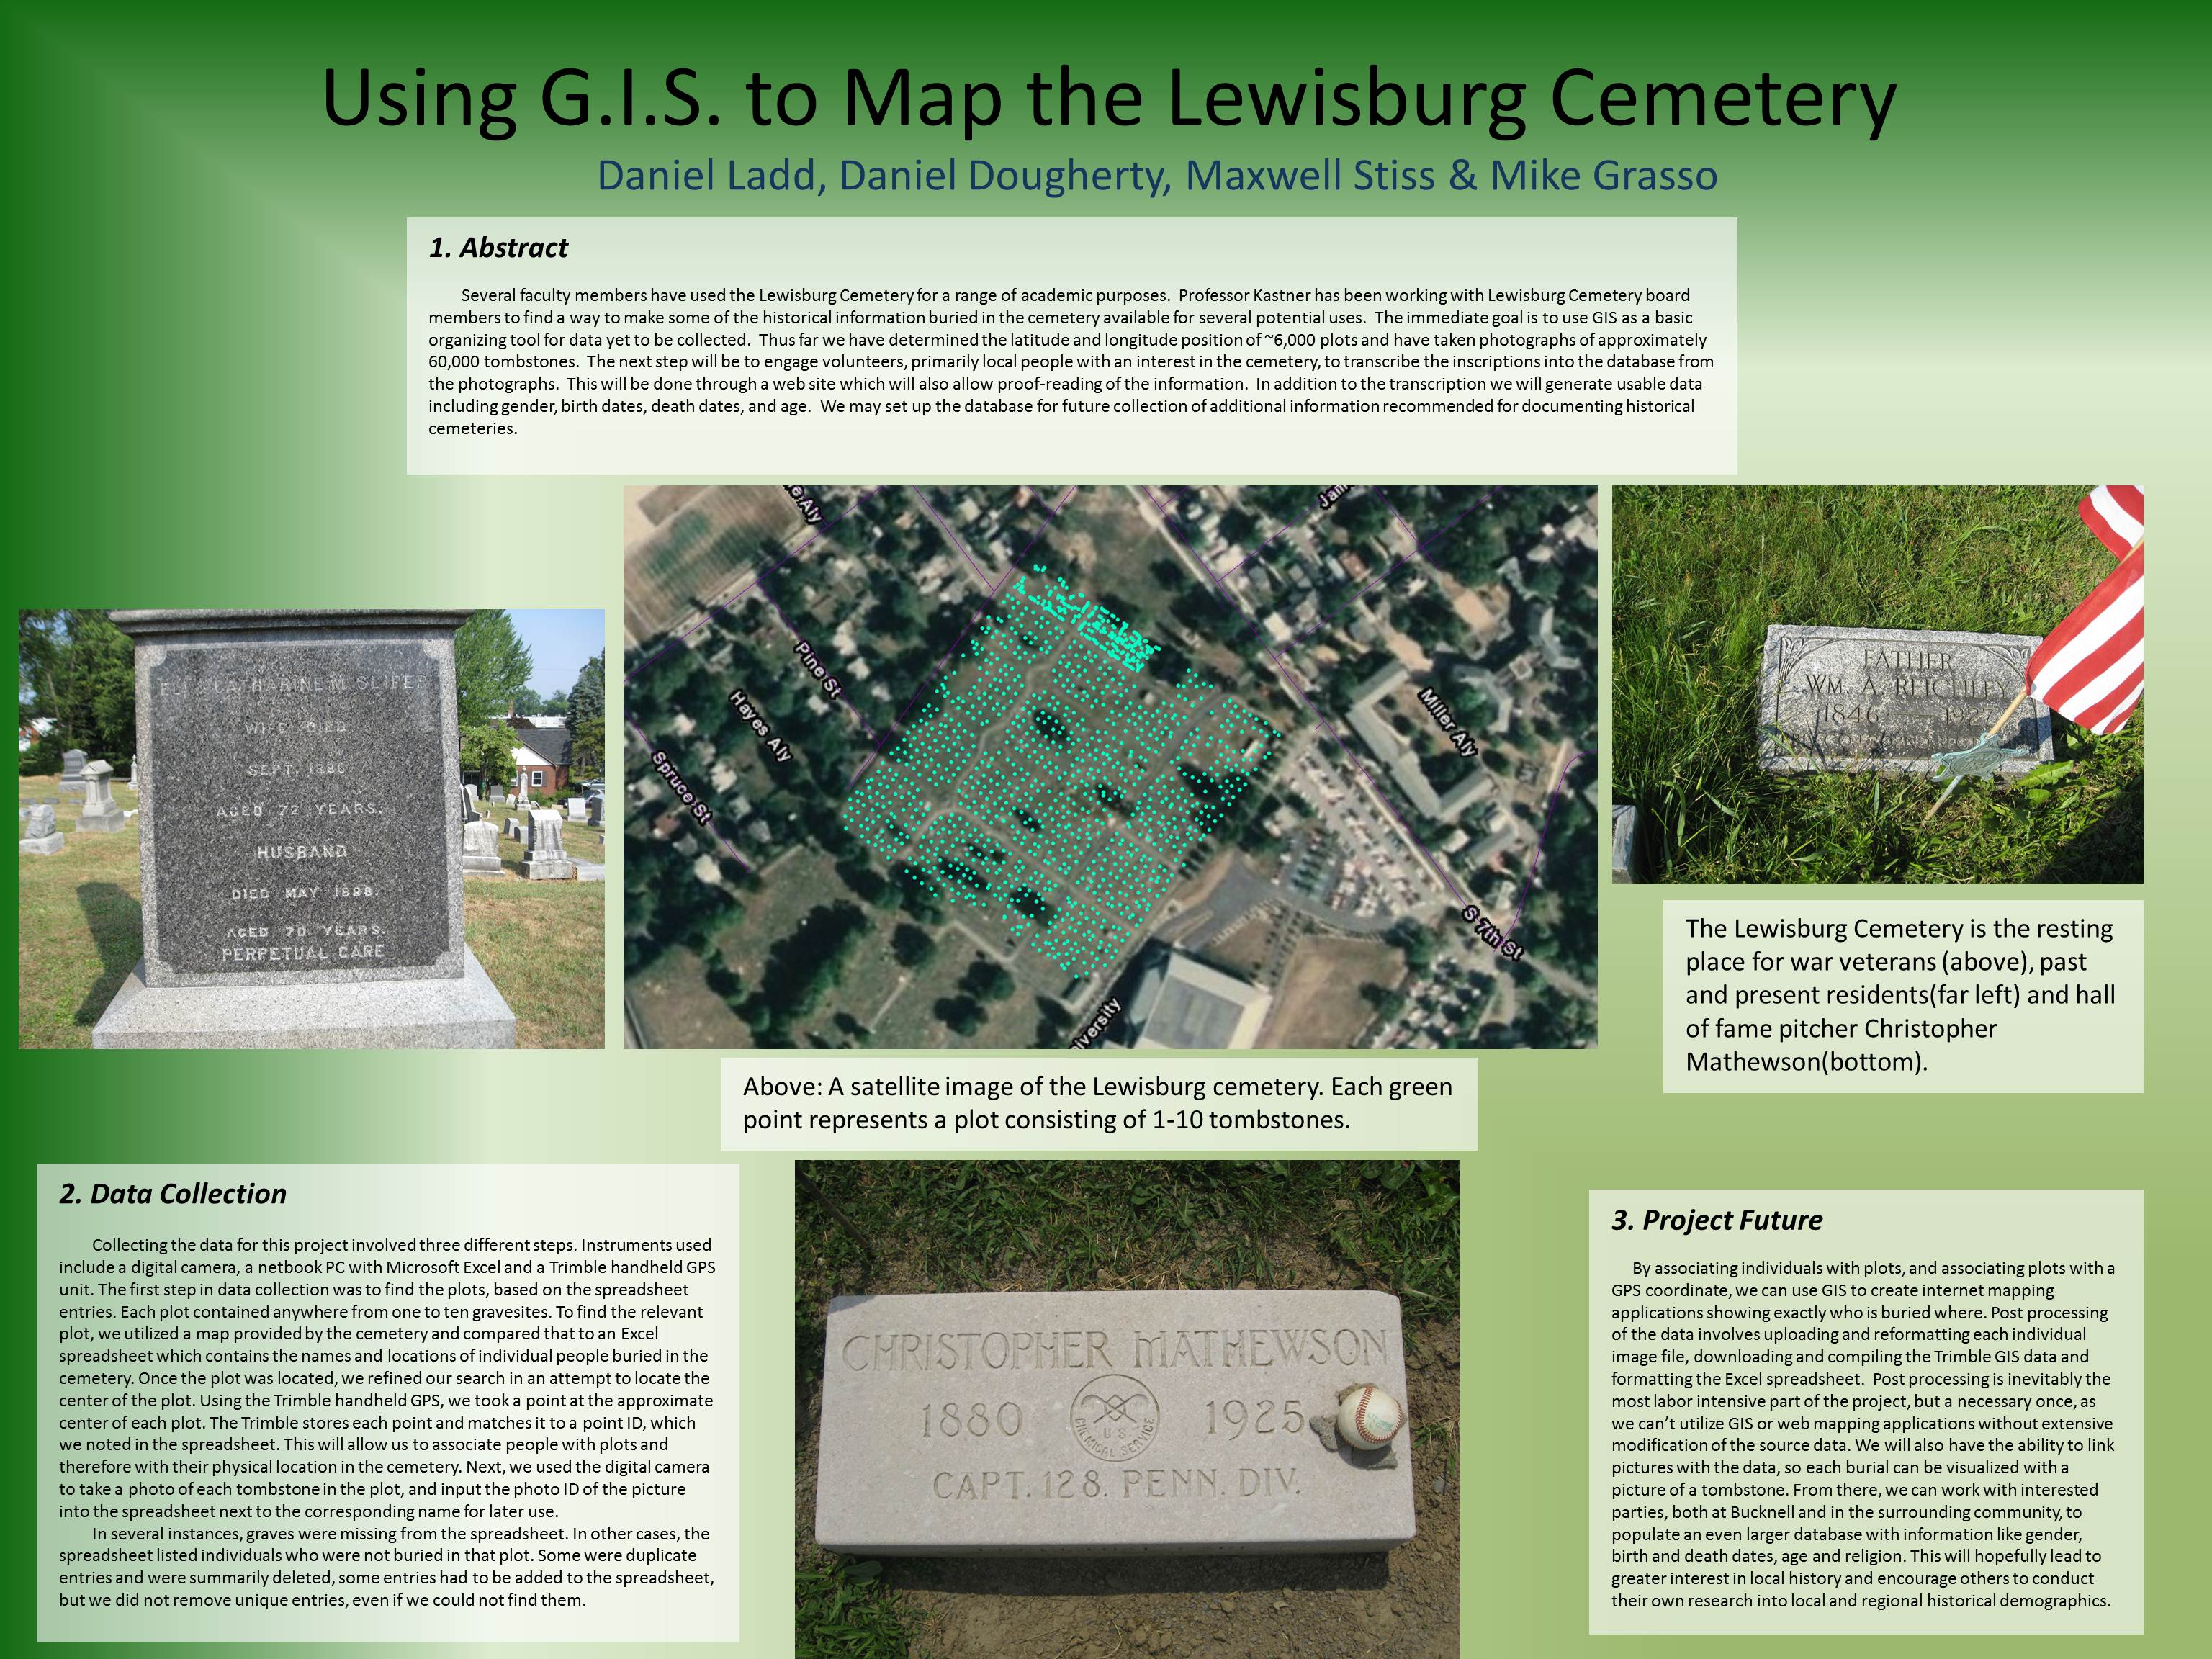
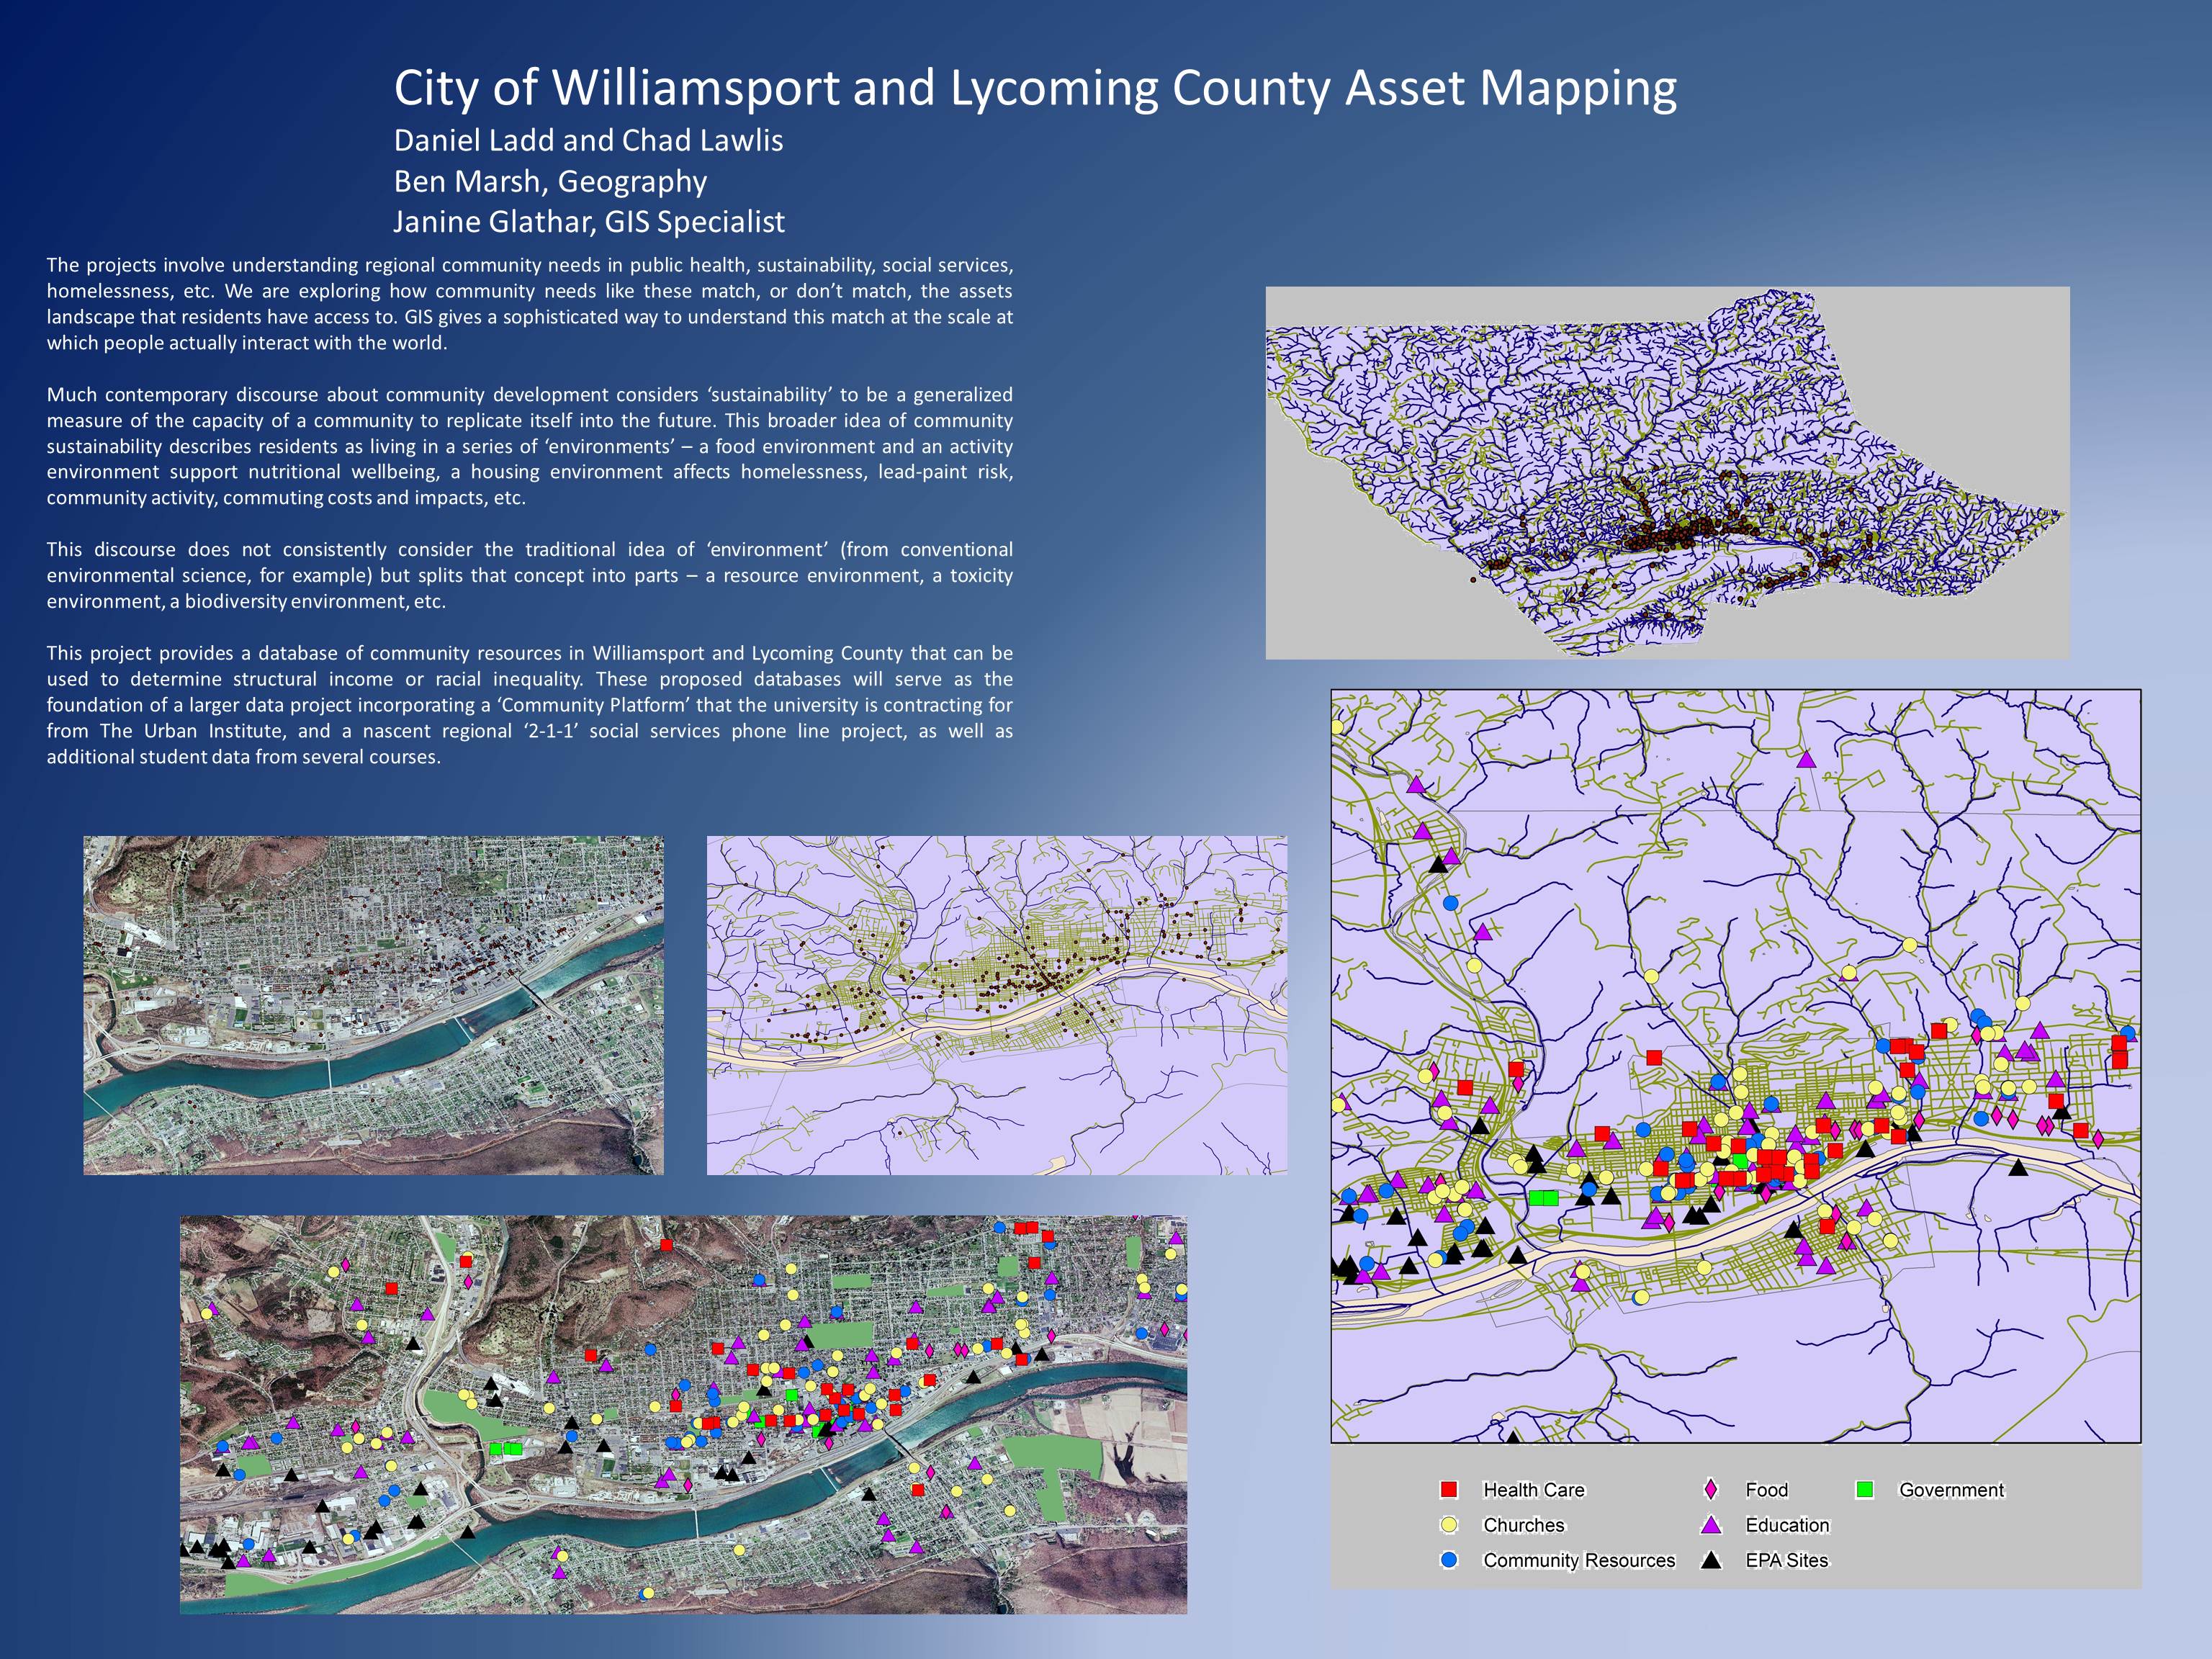
GIS Students Showcase Their Summer Work at Two Symposiums

Guest post by Dan Dougherty, Geography/History ’12
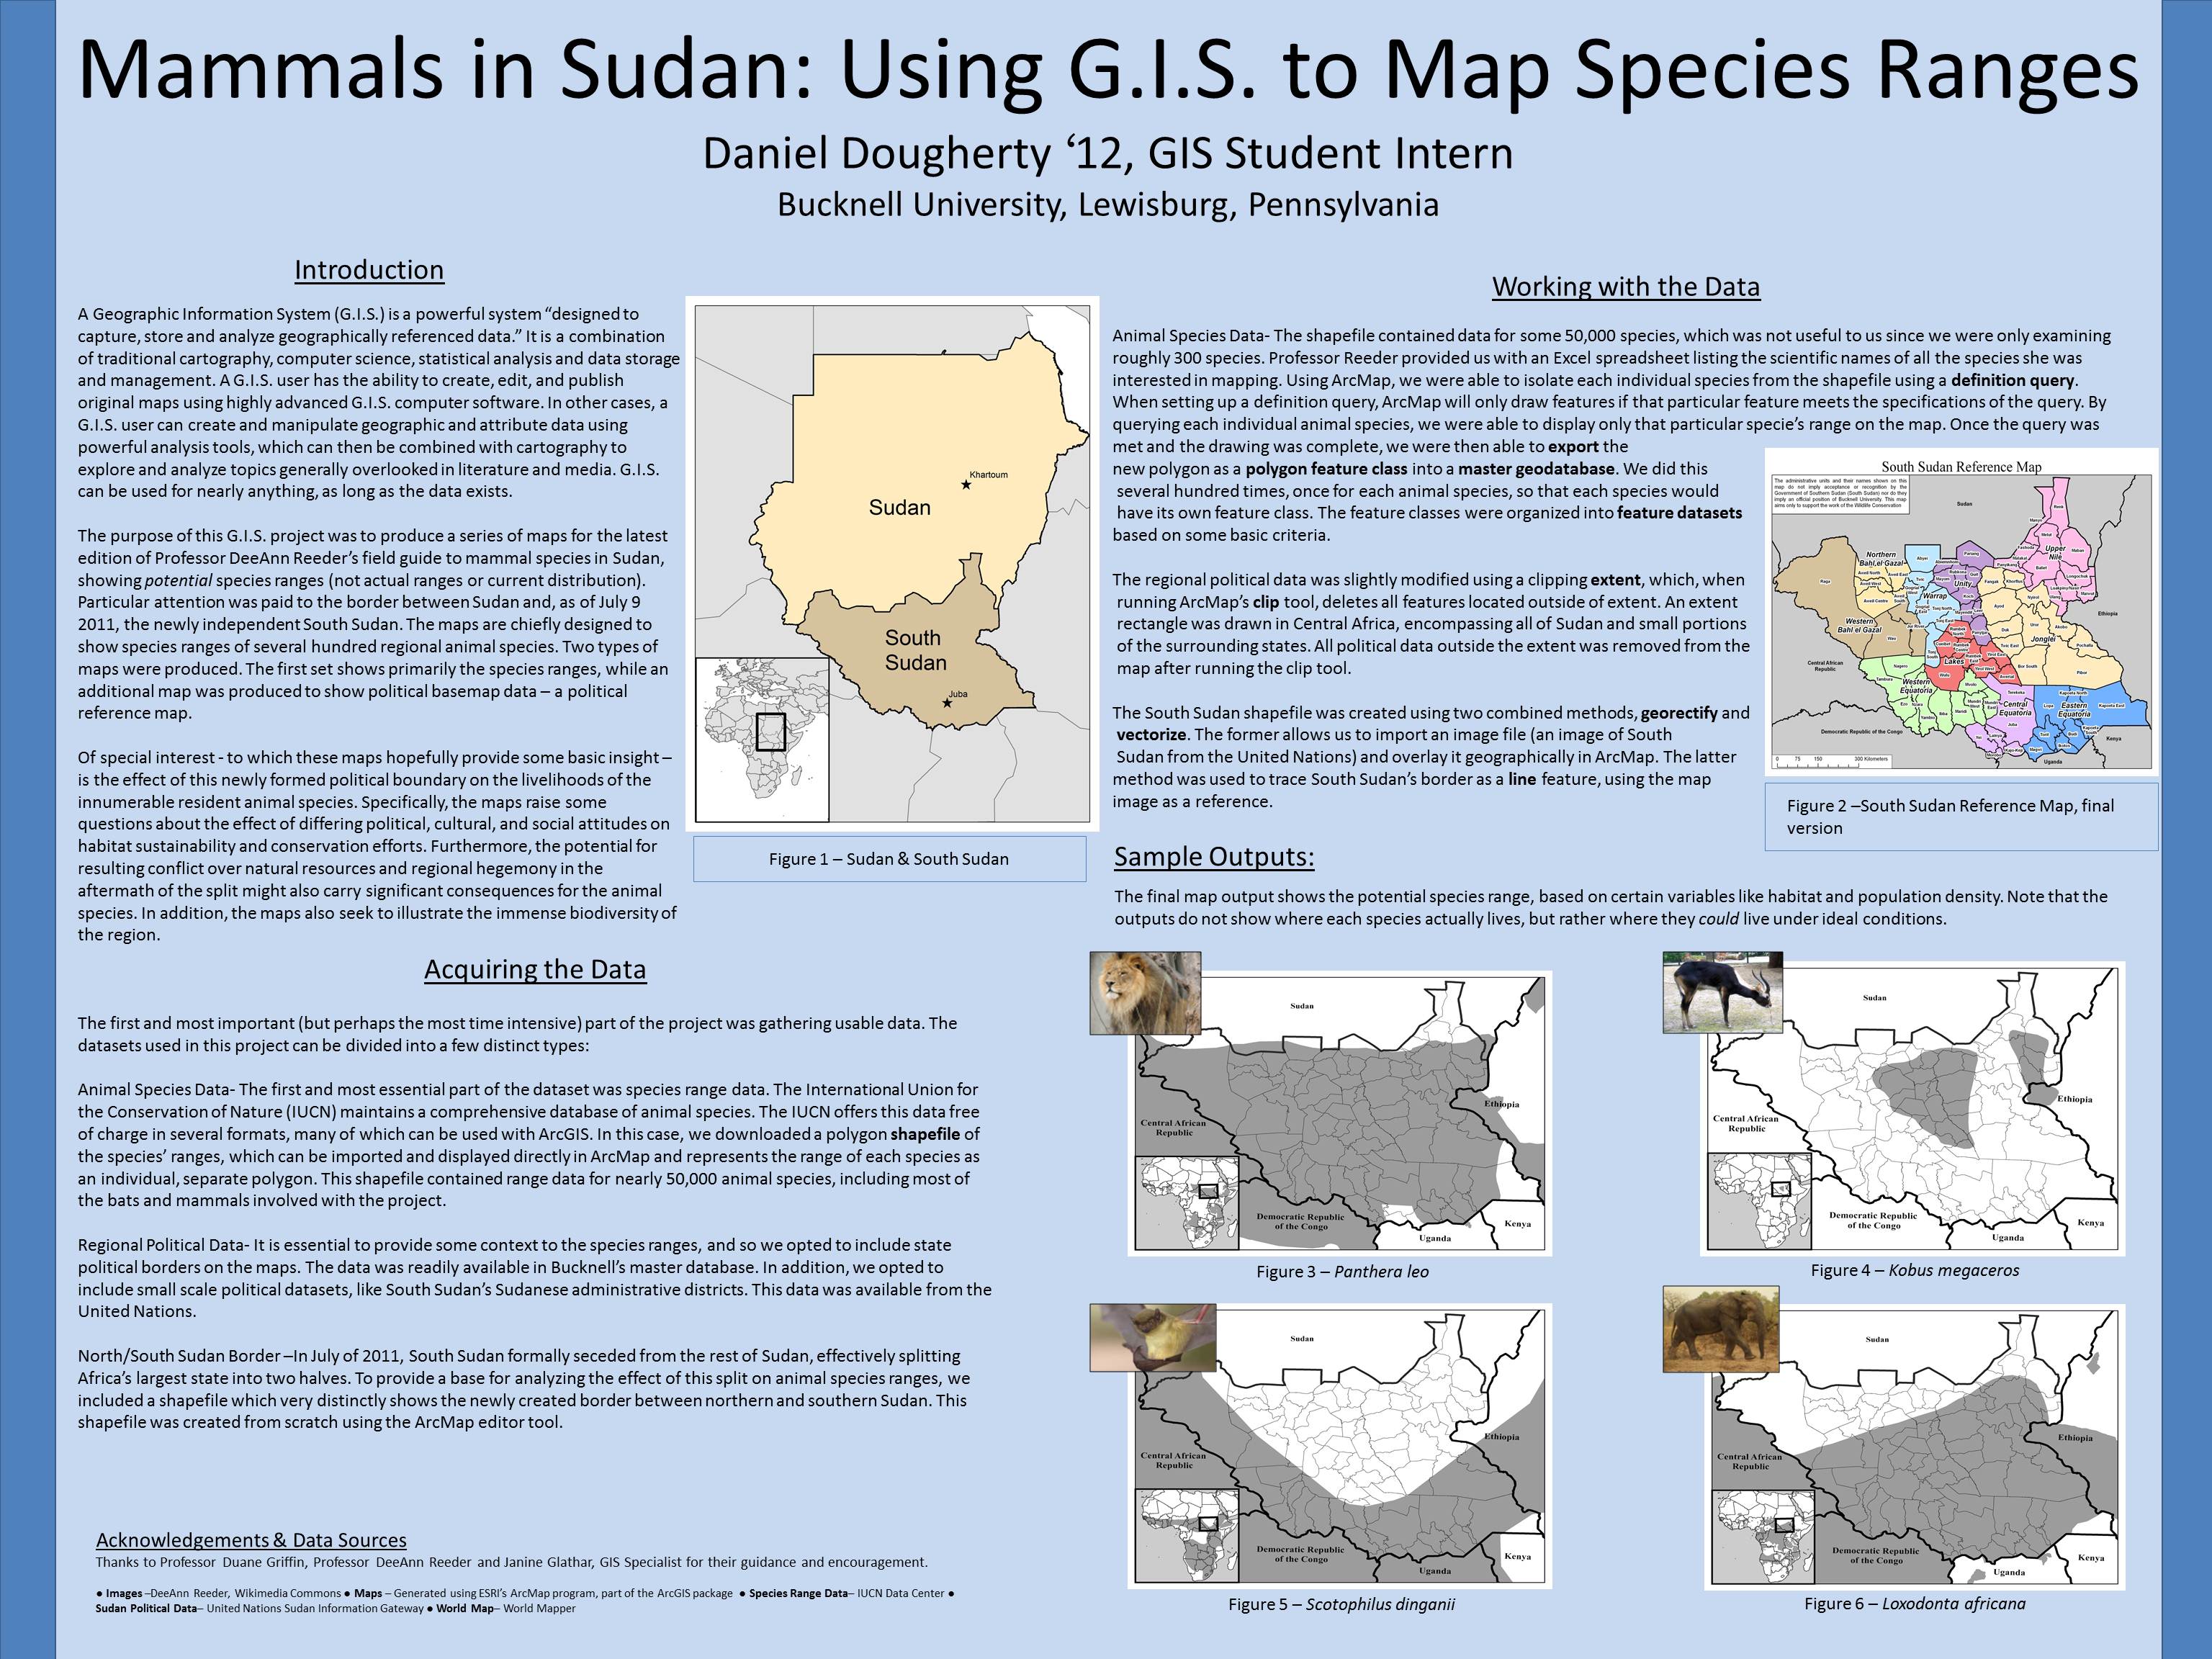
Bucknell’s summer GIS students recently got the opportunity to showcase their work at two separate poster symposiums. It helps to know a little bit about research/poster symposiums, for those who are unfamiliar. They are fairly straightforward. Participants set up their posters in a preassigned display location. Standing close by their posters, students field questions from interested attendees who wander the showcase, viewing posters of interest. The posters generally outline the basics of the research project first, before moving on to explain the more detailed aspects, like methodology and an analysis of the results. Space is limited so not everything can (and should!) be explained on the poster – and the student therefore must be prepared to answer fully any questions an attendee might ask. Many poster sessions are judged, with the winner awarded a prize (usually monetary). However, neither symposium the GIS students attended was judged.

GIS students attended their first symposium on Wednesday, July 27, 2011. The Sigma Xi Poster Session was held in Bucknell’s Terrace Room, located in the Elaine Langone Center. Approximately 50 students presented their work; six GIS students with eight separate posters were among them. Dozens of people turned out to view the posters, including Bucknell faculty, administrators, and members of the local community. Provost Mick Smeyer was among the attendees, and was so impressed with the quality and consistency of the work that he asked all attendees to repeat the session again in September for Bucknell’s President, John Bravman, and the Board of Trustees.

Students attended a second symposium on August 9, 2011 from 10am to 3pm. The First Annual Susquehanna Valley Undergraduate Research Symposium was held at the Geisinger Center for Health Research in Danville, Pennsylvania, about 30 minutes from Bucknell’s campus. Students from both Bucknell University and Bloomburg University were in attendance to showcase their summer research projects to their peers, interested academics, and Geisinger staff members. Bucknell’s GIS students contributed seven posters to the symposium, all of which received substantial praise and recognition.

Categories
Bucknell/Local Interest Data Digital Humanities Environment General GIS GIS in Biology GIS in Computer Science GIS in Engineering GIS in Environmental Studies GIS in Geography GIS in Geology GIS in History GIS in Humanities GIS in Psychology GIS in Sociology Map Apps Marcellus Shale Miller Run Restoration Project Slideshow

What we’re up to this summer (and why we’re not posting)

Thanks to the Mellon grant and a huge number of faculty teaching and research projects it’s been a very busy summer of GIS work at Bucknell.  Over the coming weeks I’ll write detailed posts about the work we’re doing on each of the projects.  If I’m really ambitious I might try to post some interviews with faculty and students – and some footage of the aerial drone flights that Nick Urban ’12 is doing. But for now here’s a short overview of who’s doing GIS work at Bucknell this summer and what we’re doing:

GIS Student Assistants:

  • Chad Lawlis, Environmental Studies ’11
  • Dan Dougherty, Geography/History ’12
  • Max Stiss, Geography/Anthropology ’12
  • Nick Urban, Computer Science ’12
  • Mike Grasso, Environmental Studies ’13
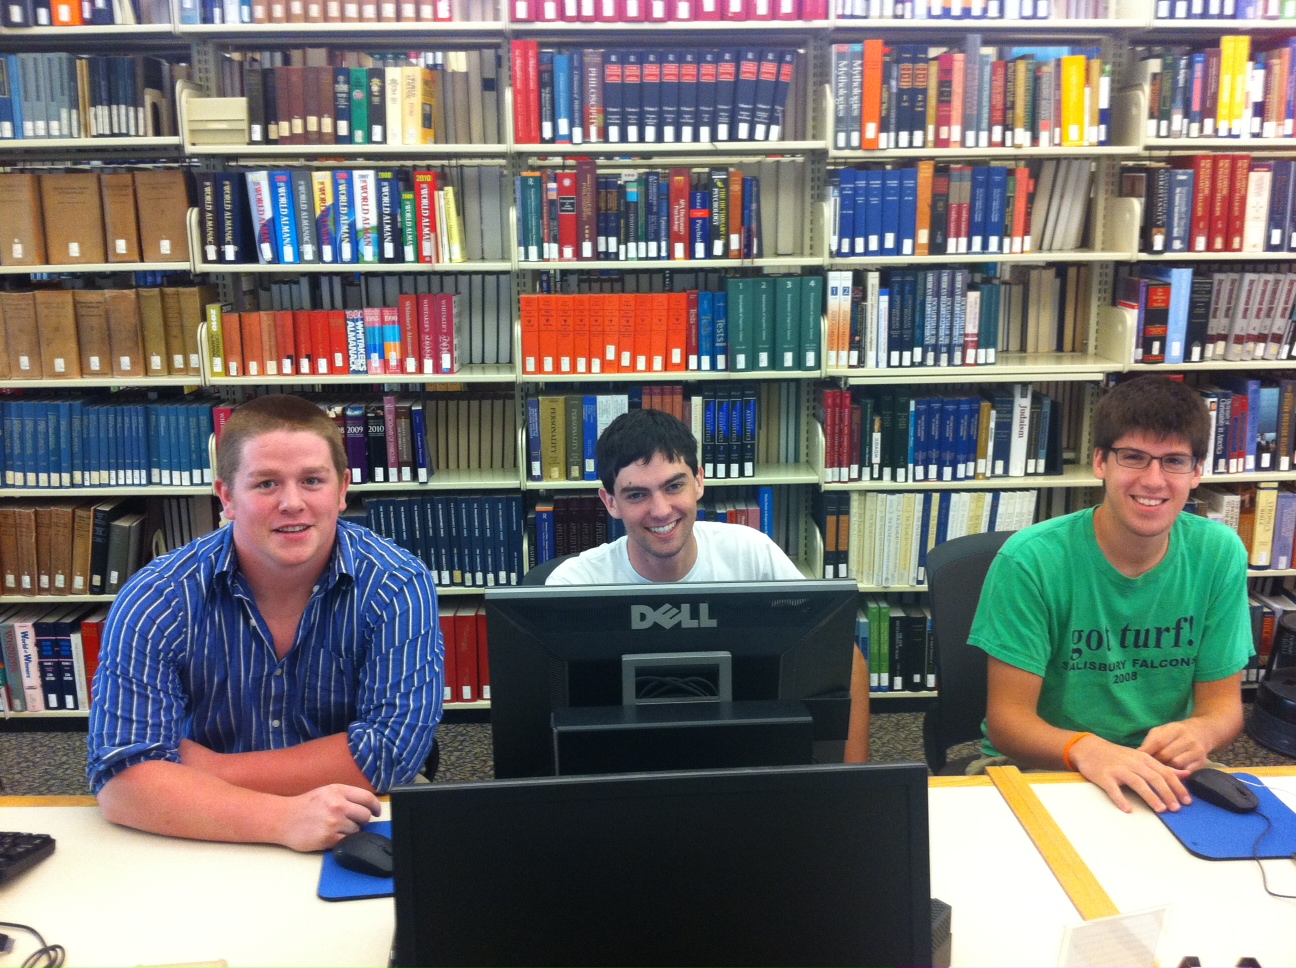
  • Robby Holler, Geography/International Relations ’13 (pictured below)
  • Darin Rockwell, Geography/Geology ’13 (pictured below)
  • Dan Ladd, Middlebury College ’14 (pictured below)

Key Projects:

  • Maps for Sudan field guide atlas to mammals
  • GPS data collection for Lewisburg Cemetary
  • GPS data collection for Miller Run restoration project
  • Aerial drone data collection for Miller Run restoration project
  • Lycoming County/Williamsport community asset mapping
  • Mapping toxic contamination from Marcellus Shale natural gas wells
  • Mapping locations of Marcellus Shale water withdrawl permits
  • Georeferencing & vectorizing 19th century economic maps of Vietnam
  • Georeferencing & vectorizing maps of environmental hazards and resources in Kyrgyzstan
  • Georeferencing & vectorizing 1868 Historic Atlas of Union & Snyder Counties
  • Data development for Stories of the Susquehanna project
  • Support for student research projects – including GPS’ing dumpster locations on campus for an analysis of campus waste and recycling, and updating Arboretum tree dataset with location info for newly planted and felled trees
  • Develop pilot web map apps for showcasing faculty research
  • Develop pilot web map apps for use in teaching
  • Implement backend IT infrastructure to support ArcGIS server
  • Maps for Bucknell admin purposes, including: analysis of parking shortages on campus; maps for task force report on campus climate; maps for SBDC report on services by county; arts festival map.


Categories
Bucknell/Local Interest Digital Humanities General GIS GIS in Environmental Studies GIS in Geography GIS in History GIS in Humanities Map Apps Marcellus Shale Slideshow Videos

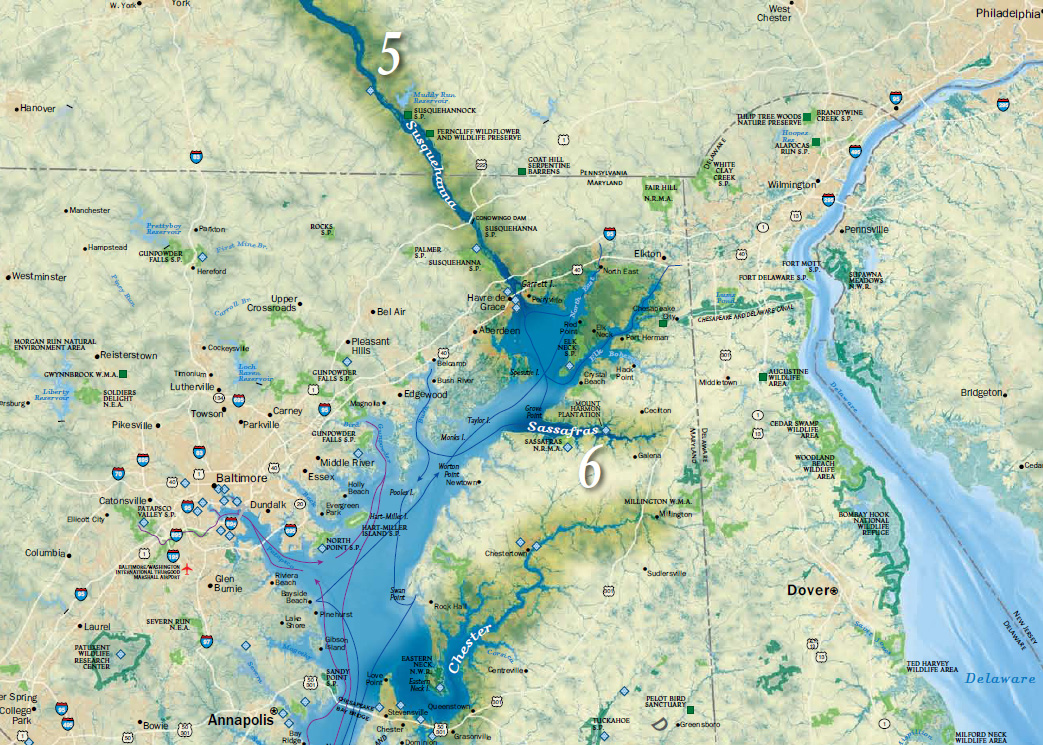
Uncovering the ‘Stories of the Susquehanna’ using GIS

Bucknell faculty have long had an interest in grounding their research efforts locally – using the physical, cultural, historical and sociological landscapes of the Susquehanna Valley region as a living laboratory. The two videos below feature Prof. Katherine Faull and student Emily Bitely ’11 talking about the role of GIS in two such projects – the Stories of the Susquehanna, and the John Smith Trail Extension project (both multi-year, inter-disciplinary projects involving faculty from across the campus).

Katie Faull discussing her use of GIS for the John Smith Trail Extension and Stories of the Susquehanna project:
httpv://www.youtube.com/watch?v=j2eG2v8FnOA

Emily Bitely ’11 discussing her use of GIS for the same projects:
httpv://www.youtube.com/watch?v=1uPcaaqSzII

More about the John Smith Trail:

  • To learn more about the John Smith Trail, click here or here.
  • To view a National Geographic map detailing Captain John Smith’s voyage, click here.
  • To view a map of interpretive ‘smart’ buoys located in the river, click here.

More about the Stories of the Susquehanna project:

  • A pilot web mapping application featuring two of the ‘Stories of the Susquehanna’ is scheduled to launch this fall.  Stay tuned for more details.
  • Click here to read about the 2010 Susquehanna Valley Summer Writer’s Institute (SVSWI).  The SVSWI project is related to the Stories of the Susquehanna both in the type of local stories it explores and in its use of maps, audio, video, images and text to reflect on those stories in an interactive digital story-telling environment.
  • Click here to view the SVSWI’s interactive mapping application featuring students’ reflections on the impact of the Marcellus Shale gas boom on different populations in the Susquehanna Valley region.