Categories
Bucknell/Local Interest Data Digital Humanities General GIS Slideshow

GIS & Bucknell’s Administration

Guest post by Dan Dougherty, Geography/History ’12
The GIS team did not only work on projects for faculty and staff members. Bucknell’s Administration was also interested in several mapping projects. Some are highlighted below:

Bucknell Parking
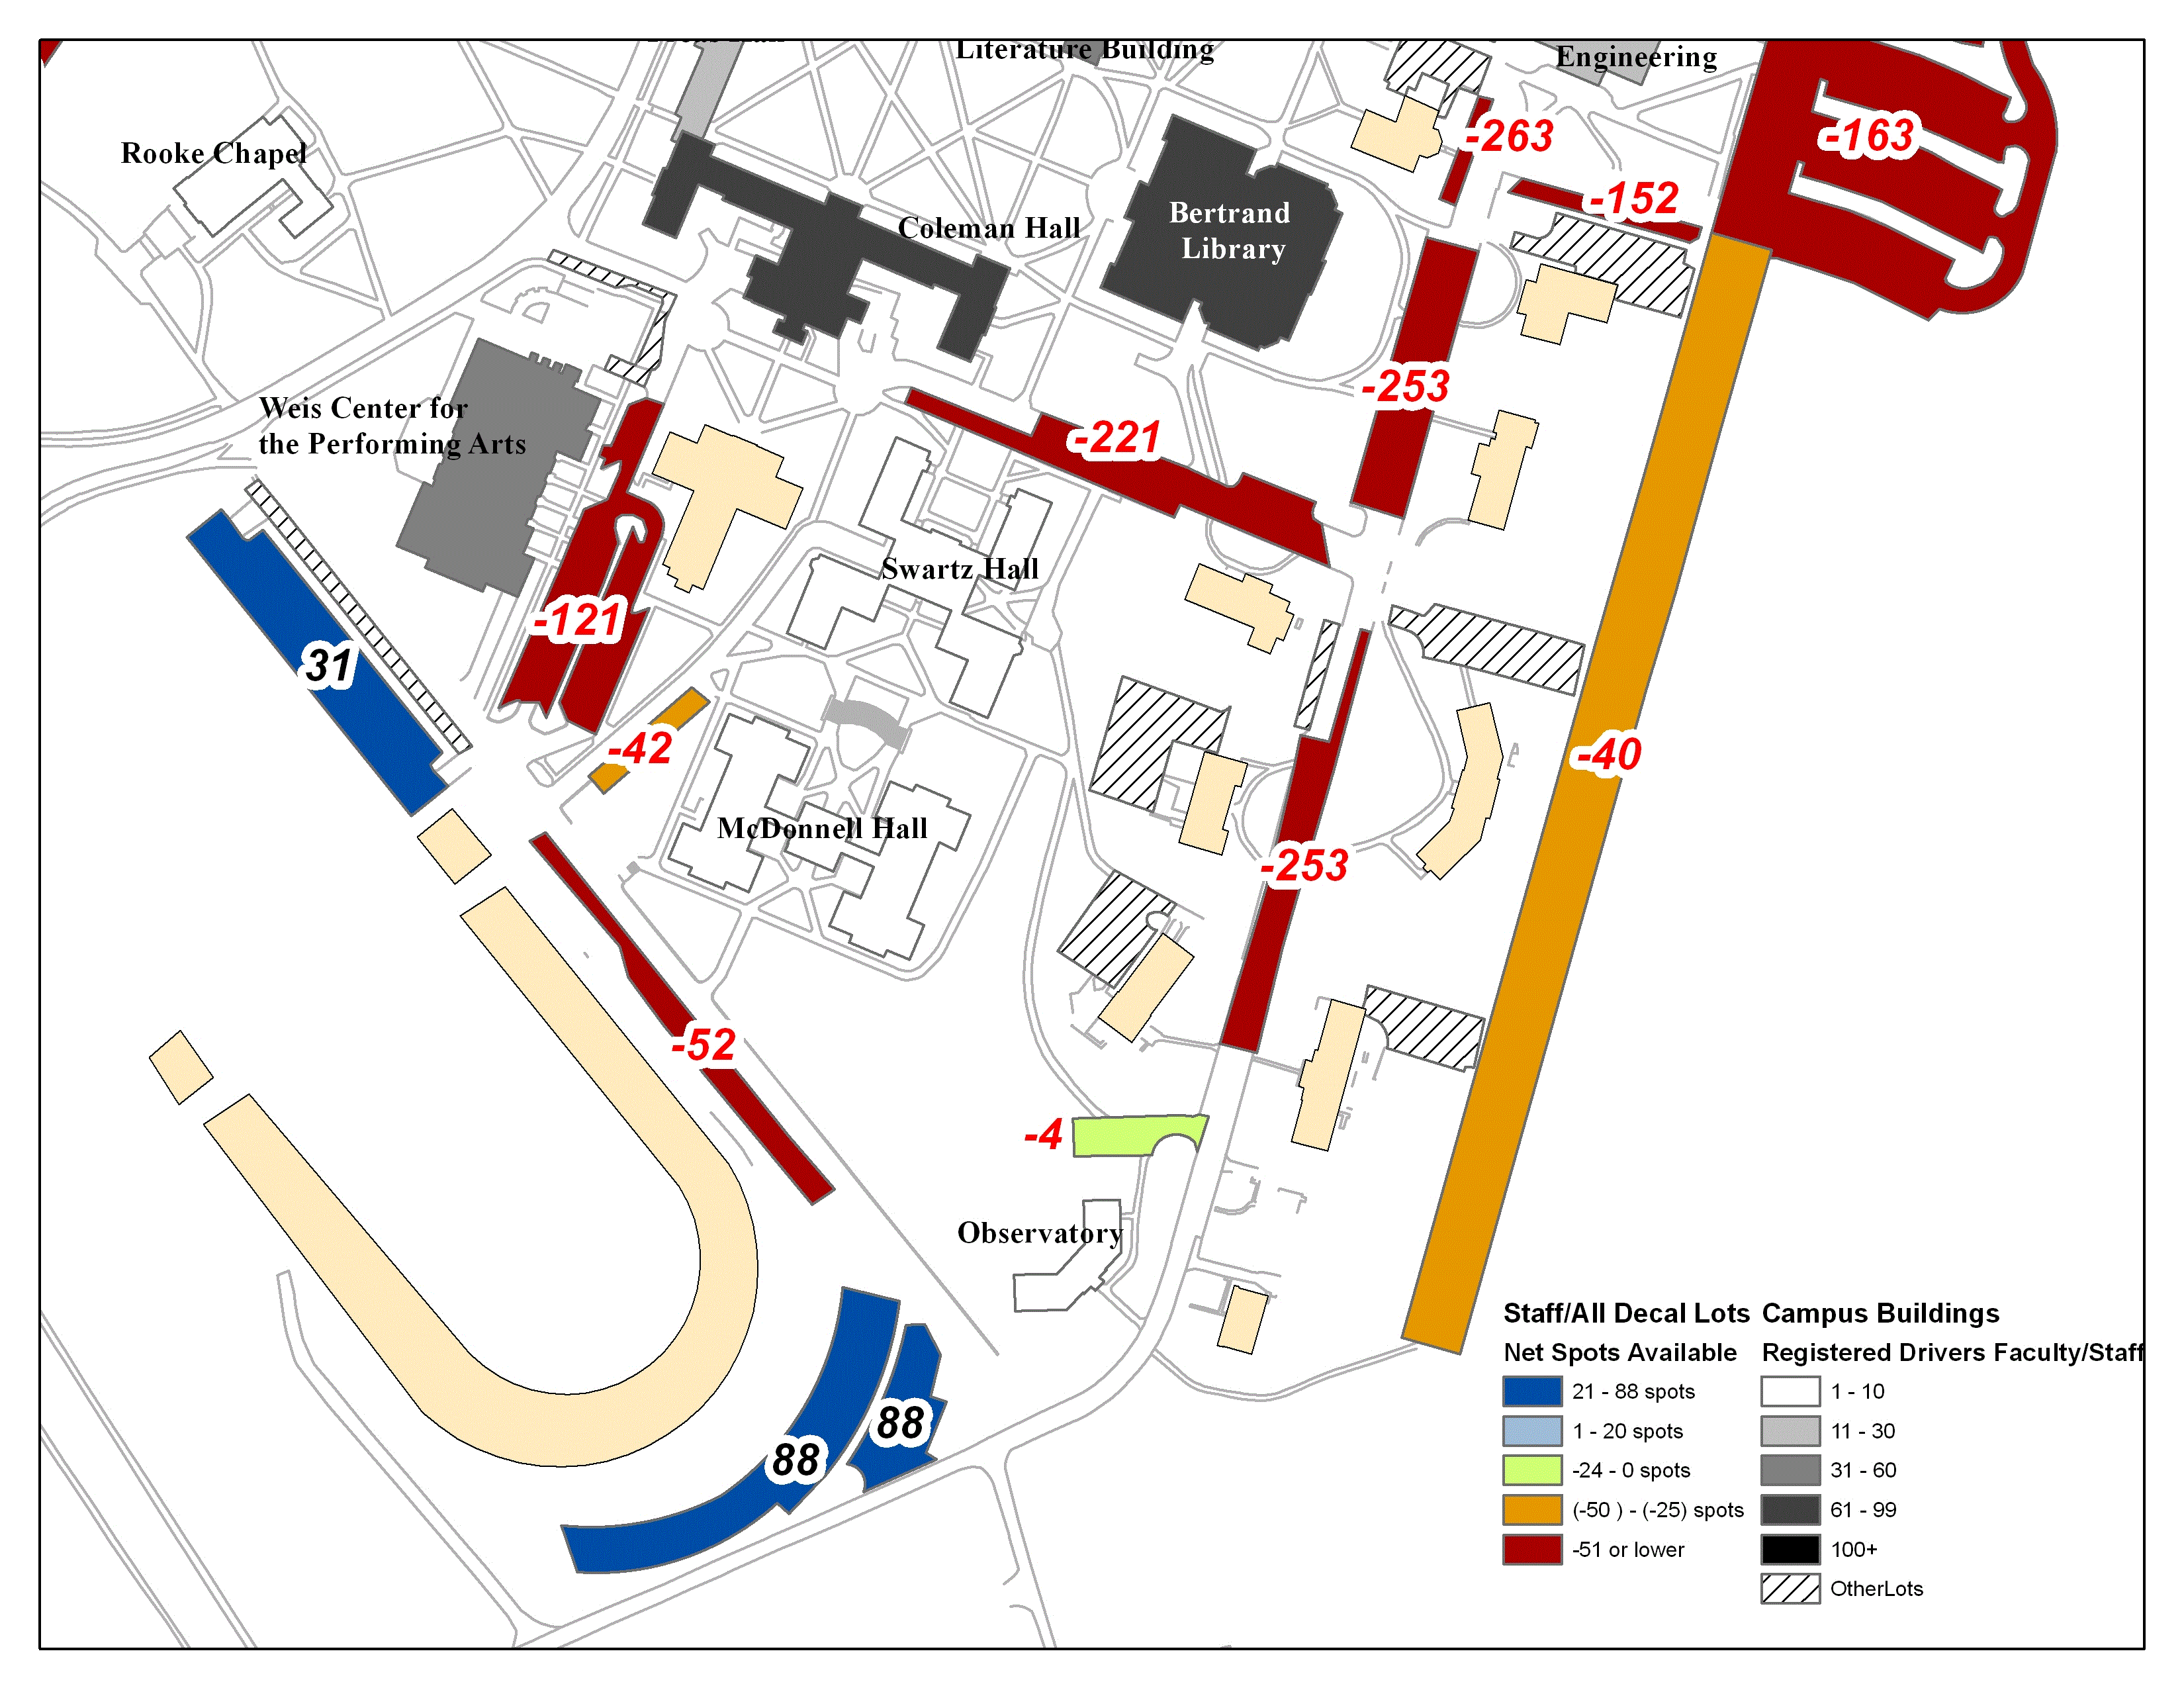
The continued growth of the University, coupled with limited space available for small scale expansion projects, has created a significant amount of vehicular congestion on campus. The amount of cars present has resulted in an increasing dearth in parking spaces. In order to analyze current trends and make recommendations for the future of parking on campus, Bucknell’s Administration asked for a series of GIS maps showing the current state of on-campus parking. The maps were produced in ArcMap 10, and the end result revealed that the parking situation in campus is much worse than expected. On any given day during the academic year, total lot capacity can be estimated at nearly 100%. A series of five maps were produced showing the entire campus; below are two of them.
Task Force on Campus Climate
Recent events on campus have encouraged the Administration to take a tougher stance against some of the negative behaviors associated with college social interaction. The Task Force on Campus Climate asked for GIS maps showing trends in reported incidents on campus. Since only a minority of events are reported to the Task Force, the map cannot be relied upon to provide the most up to date and accurate information, but nonetheless they provide a good starting point for future policy making regarding student safety on campus.

Bucknell SBDC
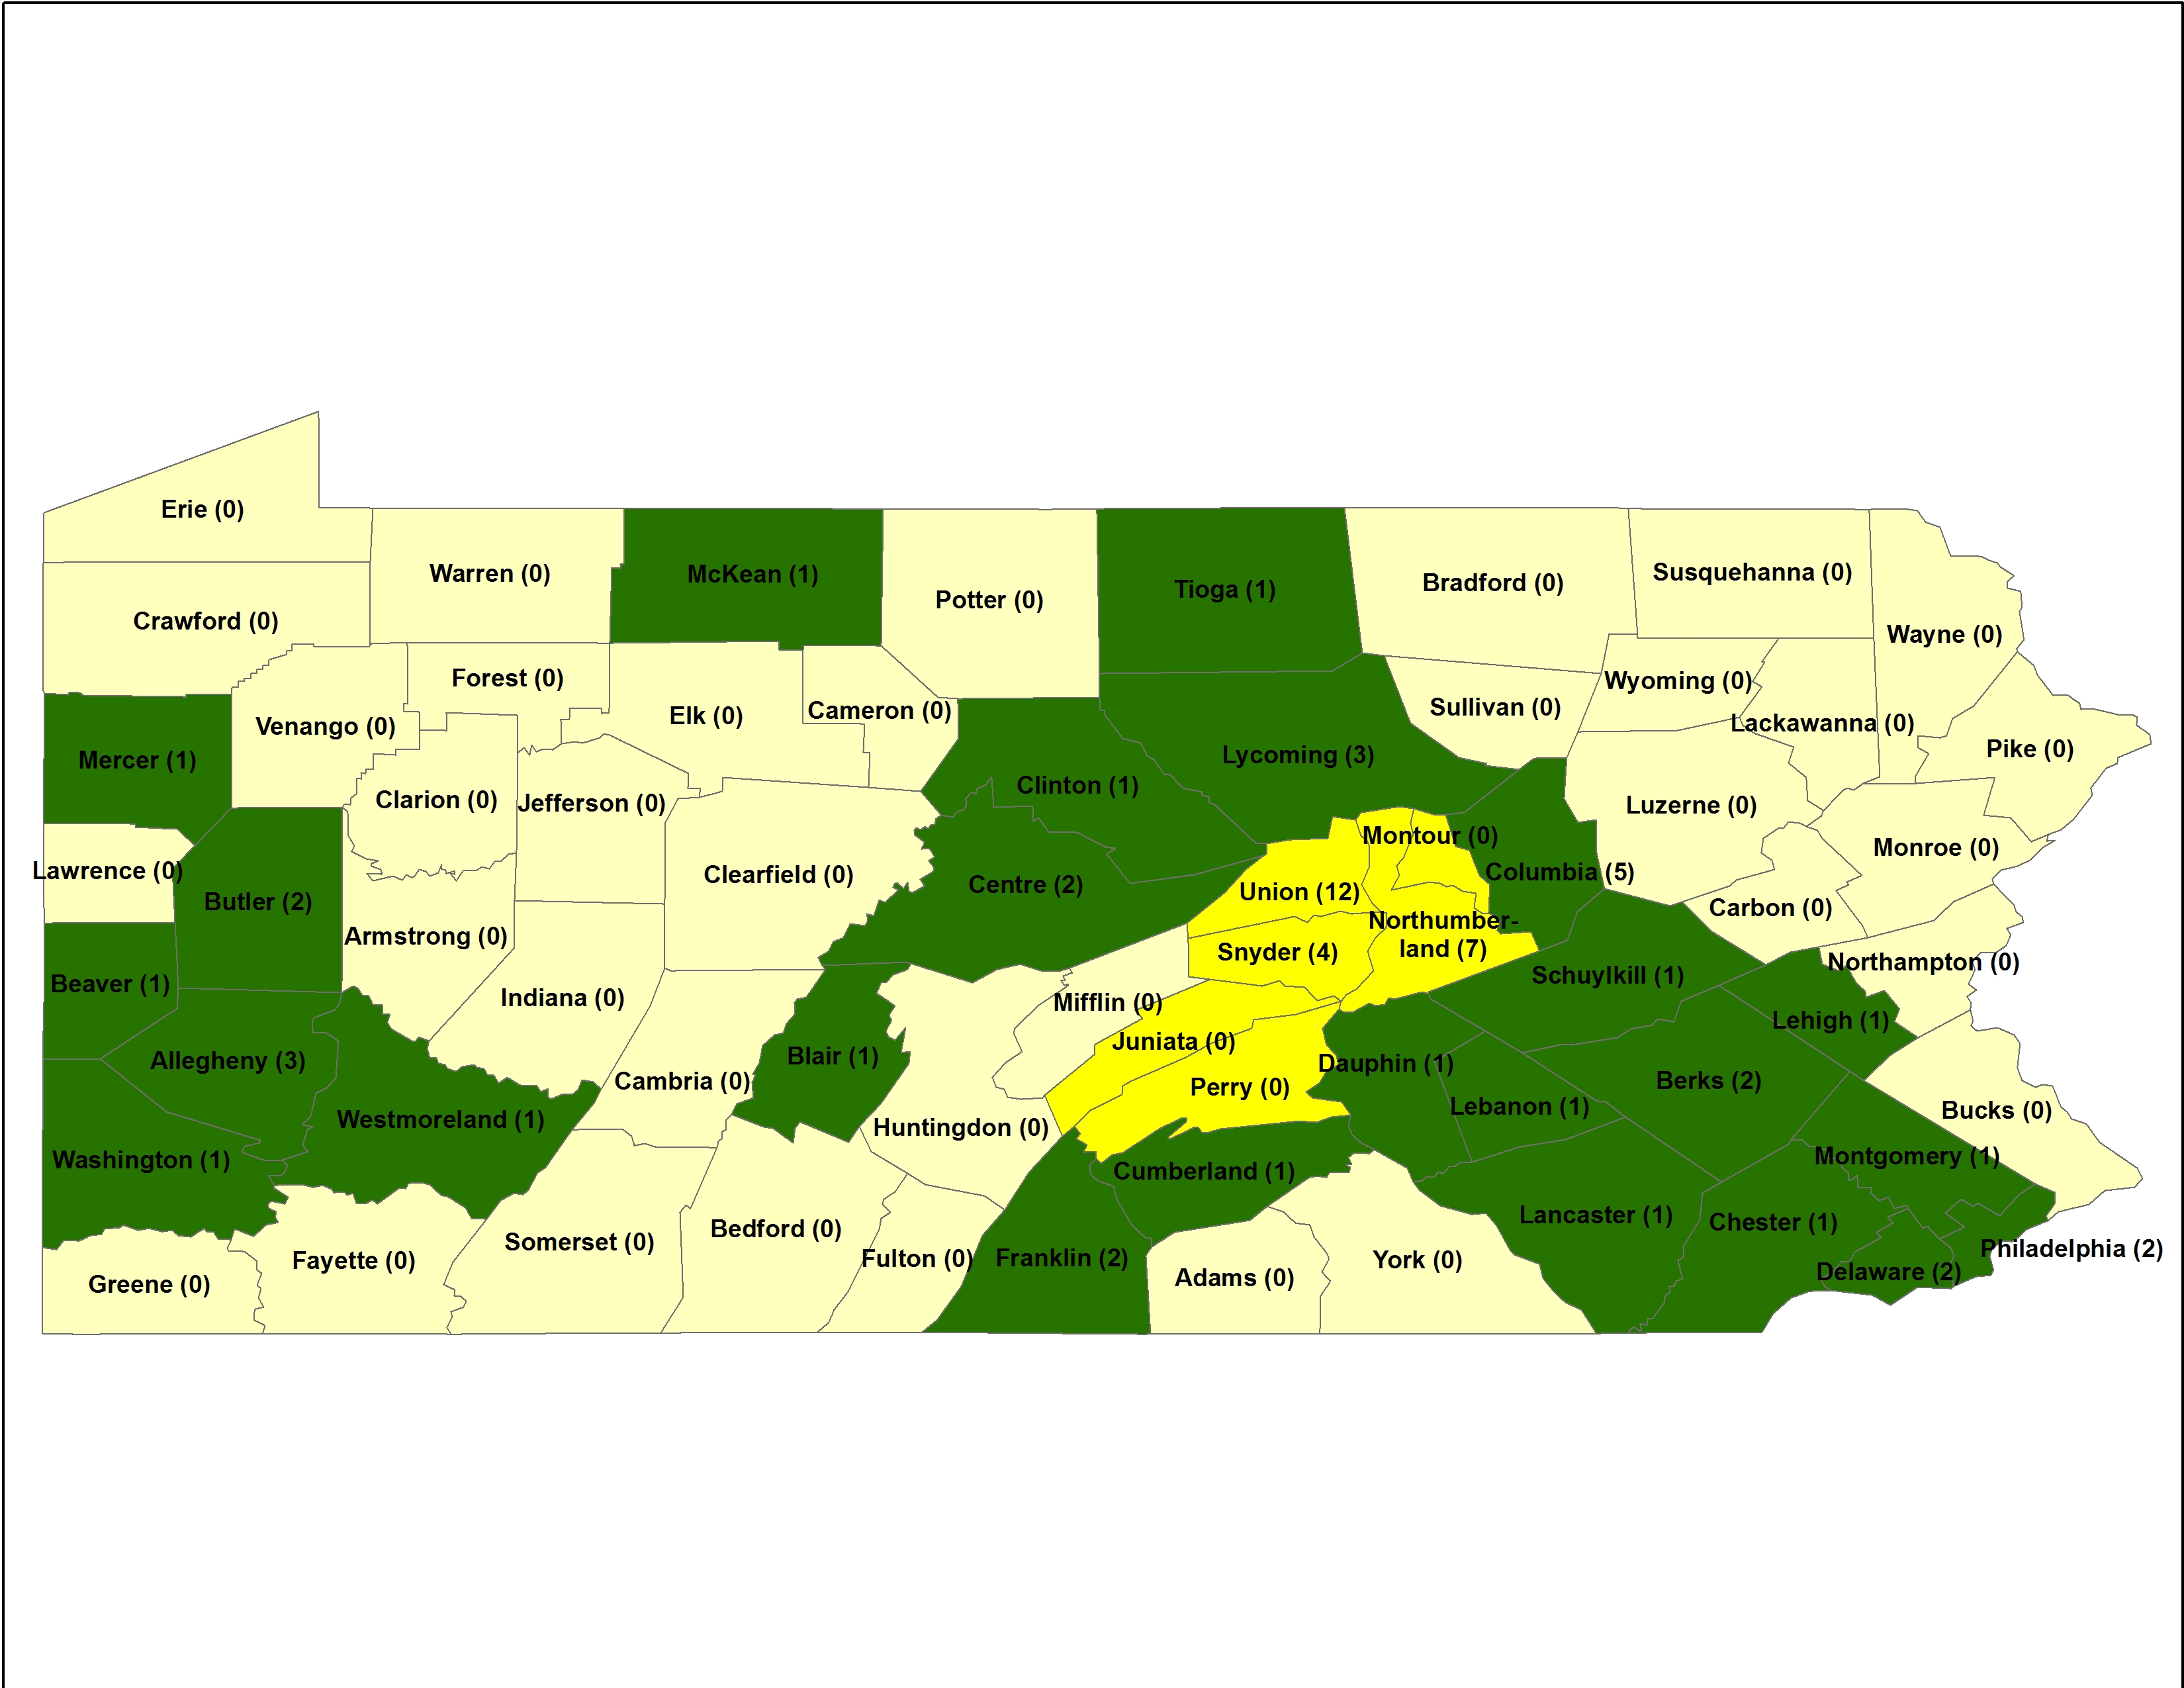
The Bucknell Small Business Development Center requested an update to a map which was made by a member of the GIS team during the previous summer. The Bucknell University SBDC helps business Start, Grow, and Prosper by providing entrepreneurs with the education, information and tools necessary to build successful businesses. Bucknell’s center is the first in the nation to be hosted by an engineering college and provides specialty Engineering Development Services throughout the Pennsylvania SBDC network. The map shows the number of Engineering Development Services (EDS) per county, with the symbology showing the regional grouping (yellow) and the the counties with affiliated EDS (green)
Categories
Bucknell/Local Interest Data Digital Humanities Environment Events/Calendar General GIS Marcellus Shale Slideshow

GIS Students Showcase Their Summer Work at Two Symposiums

Guest post by Dan Dougherty, Geography/History ’12
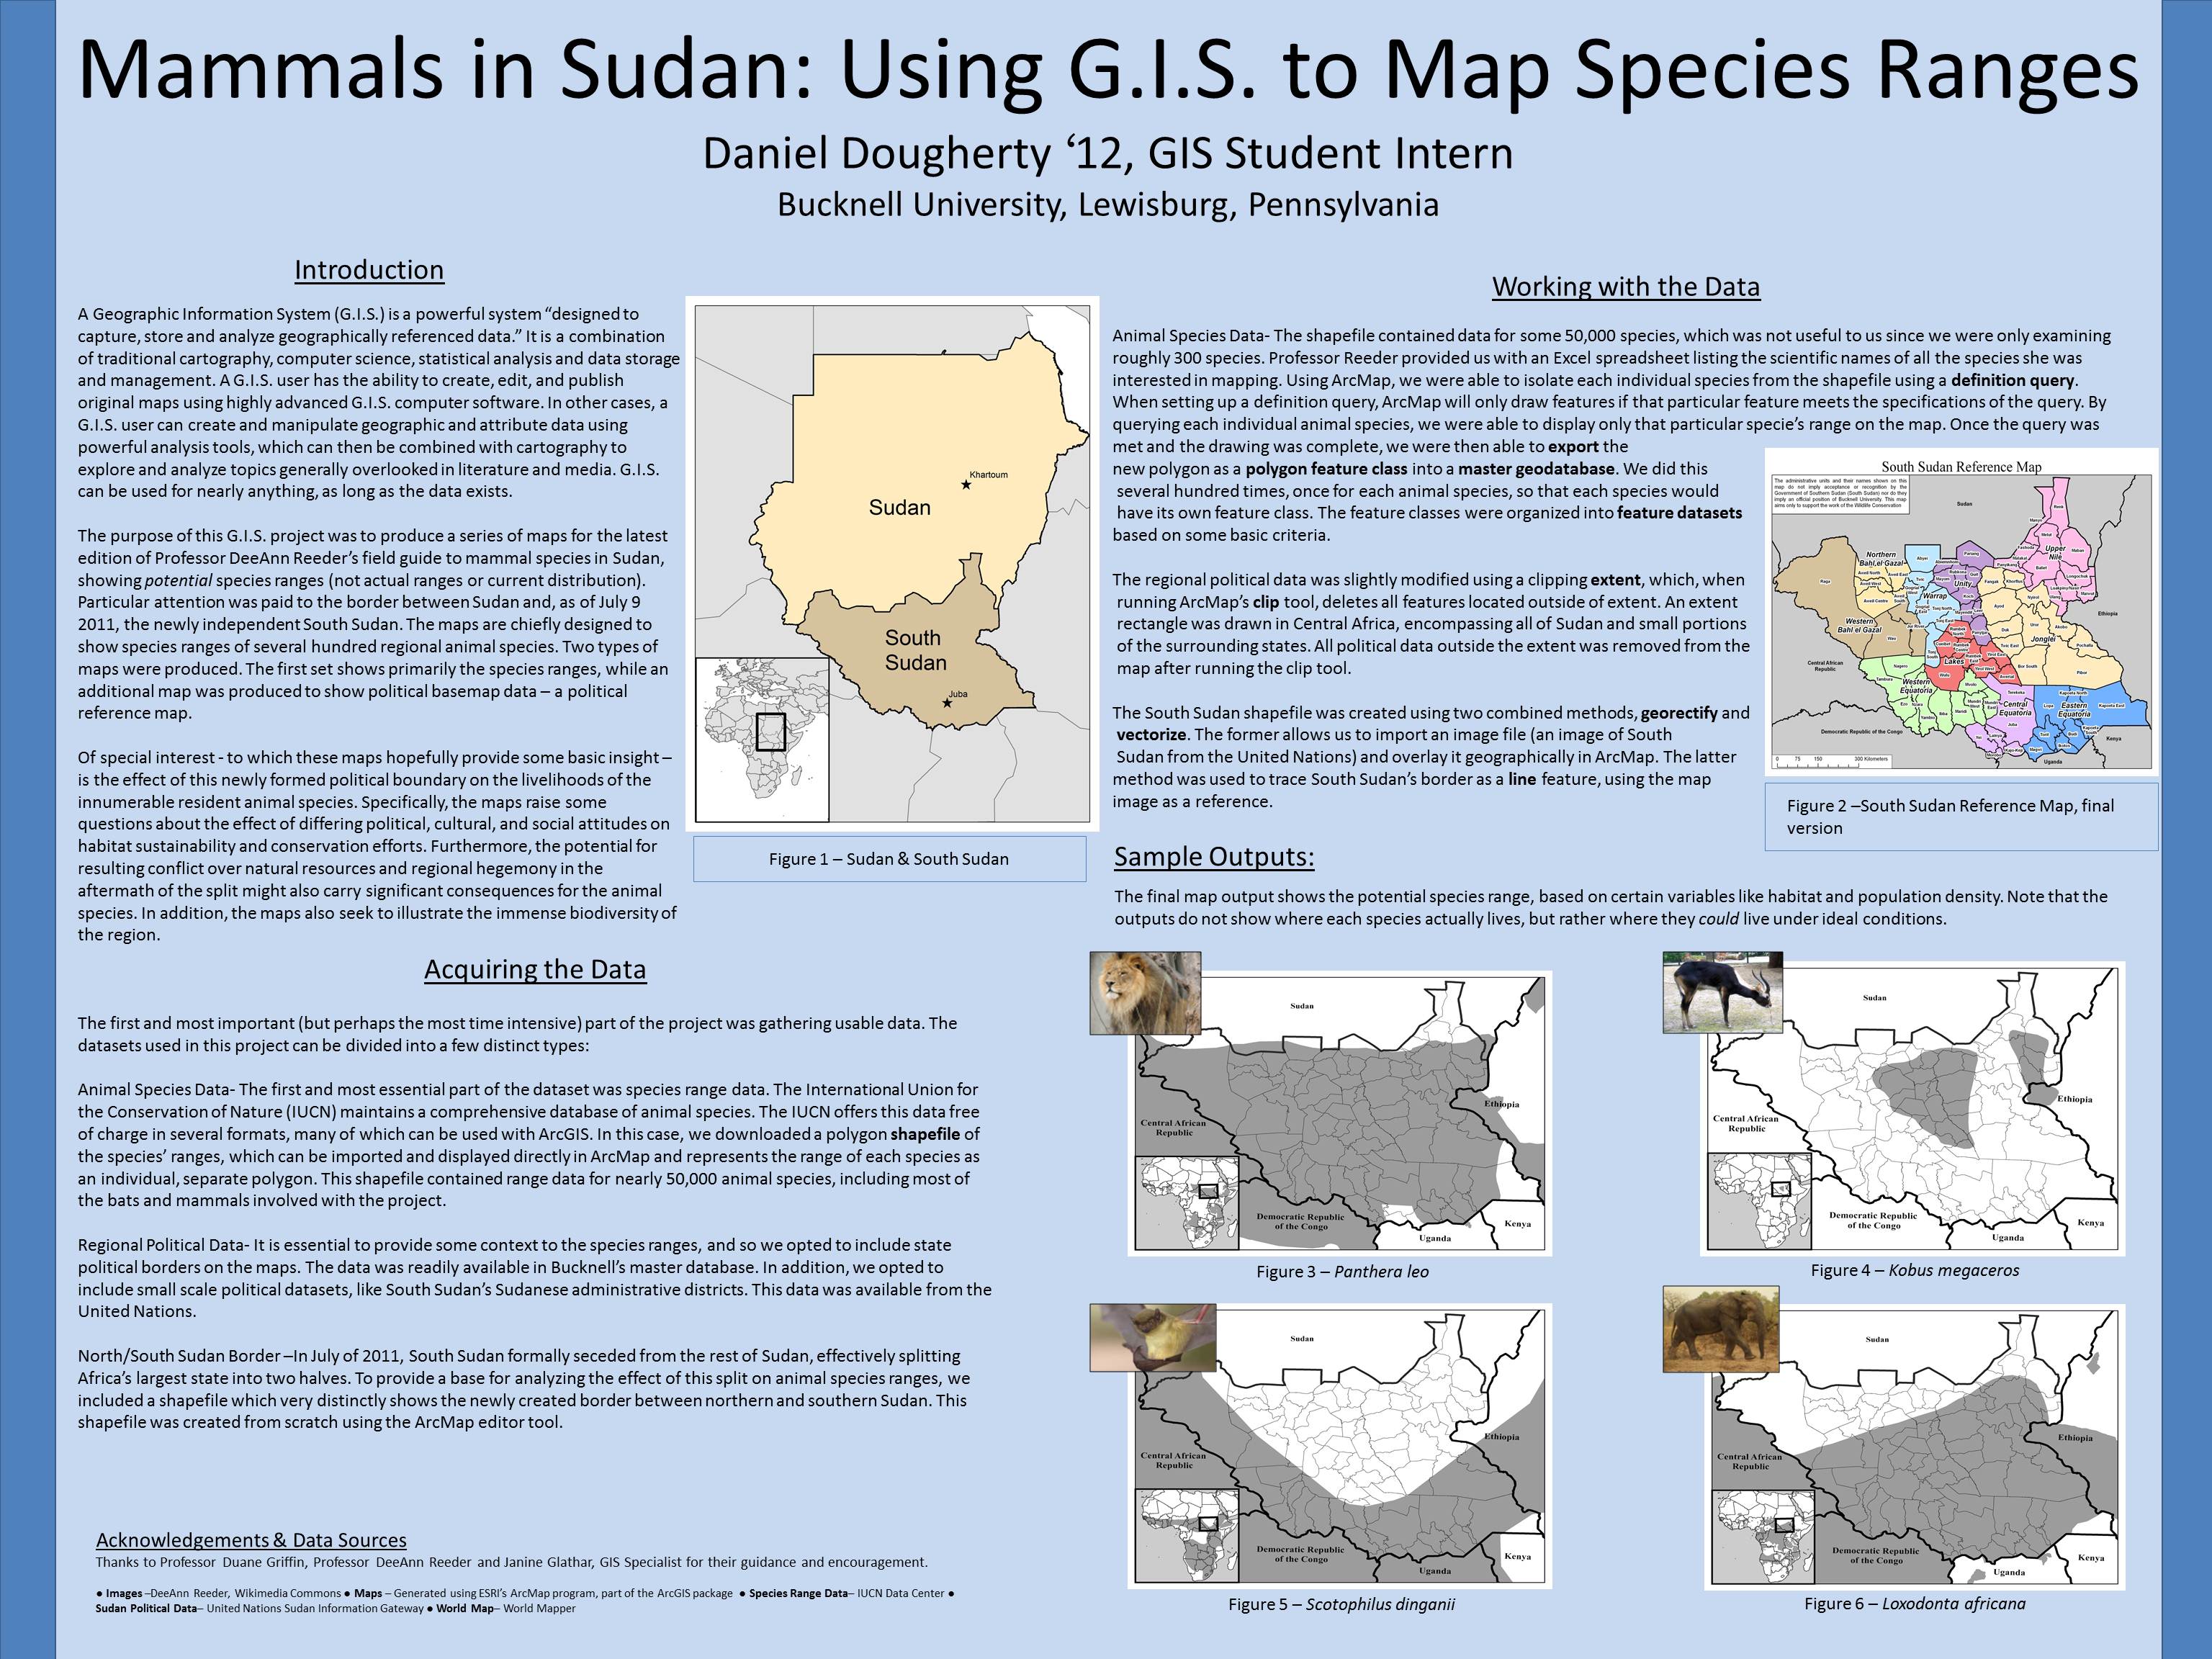
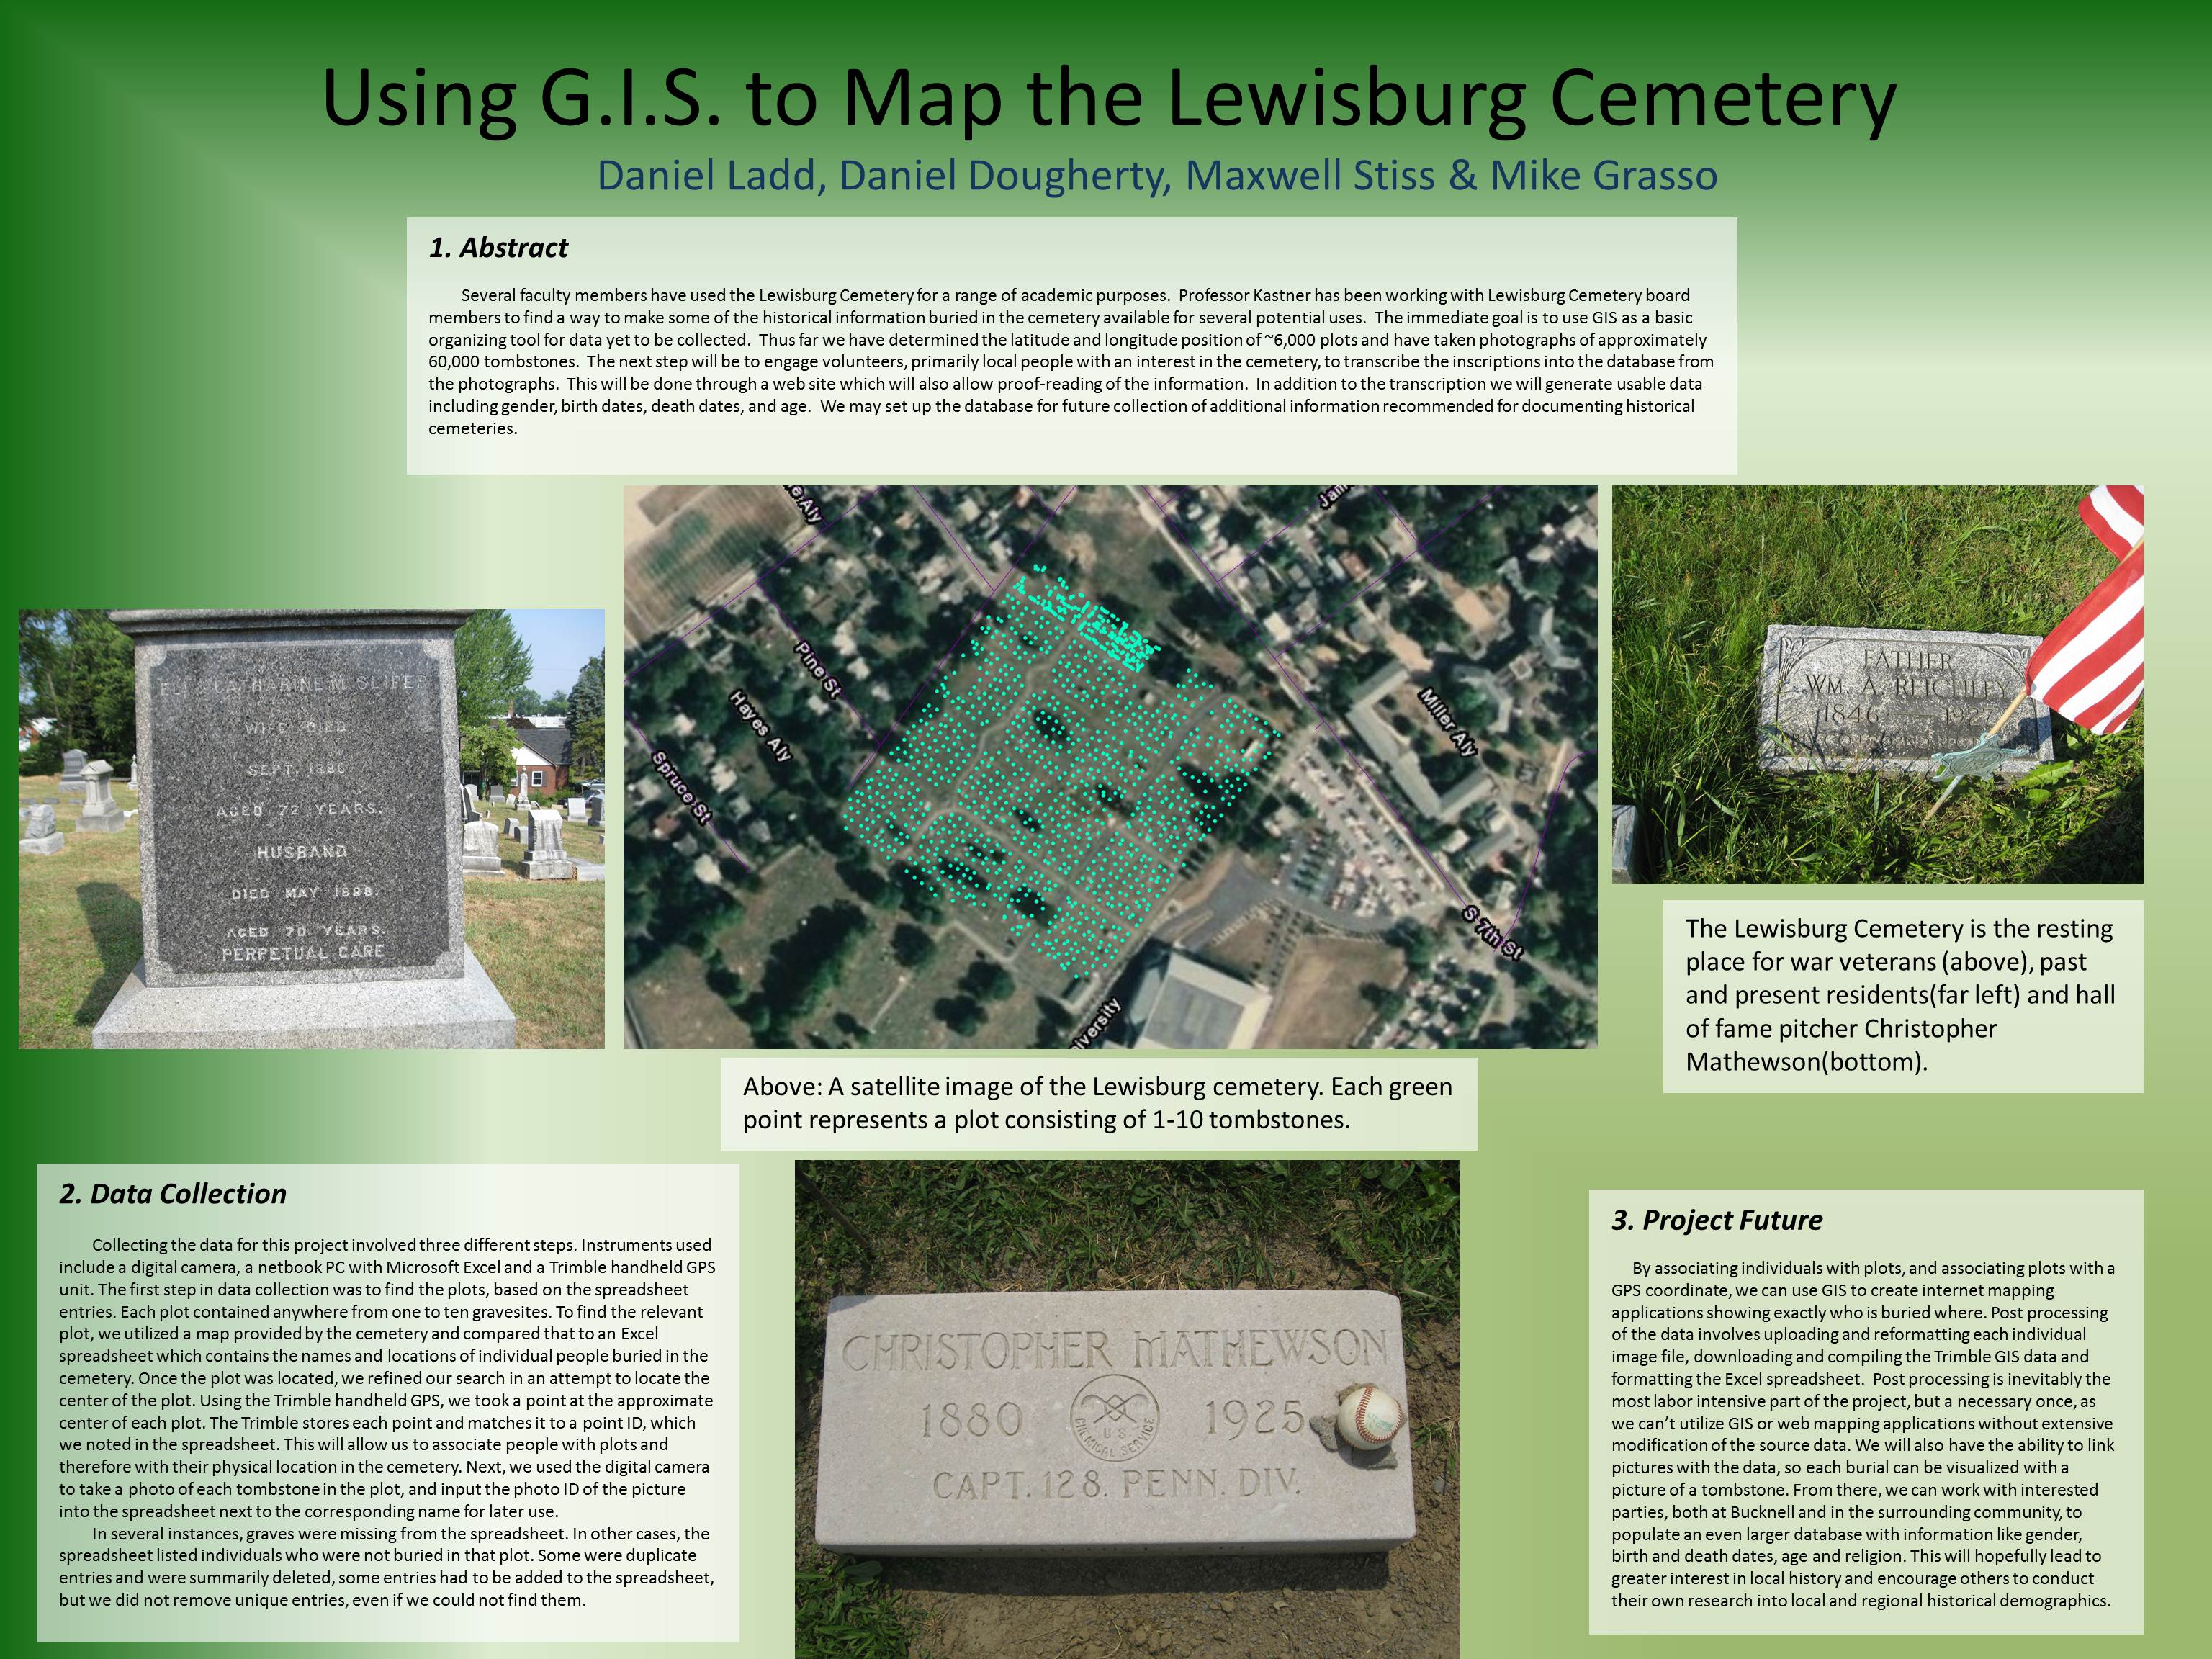
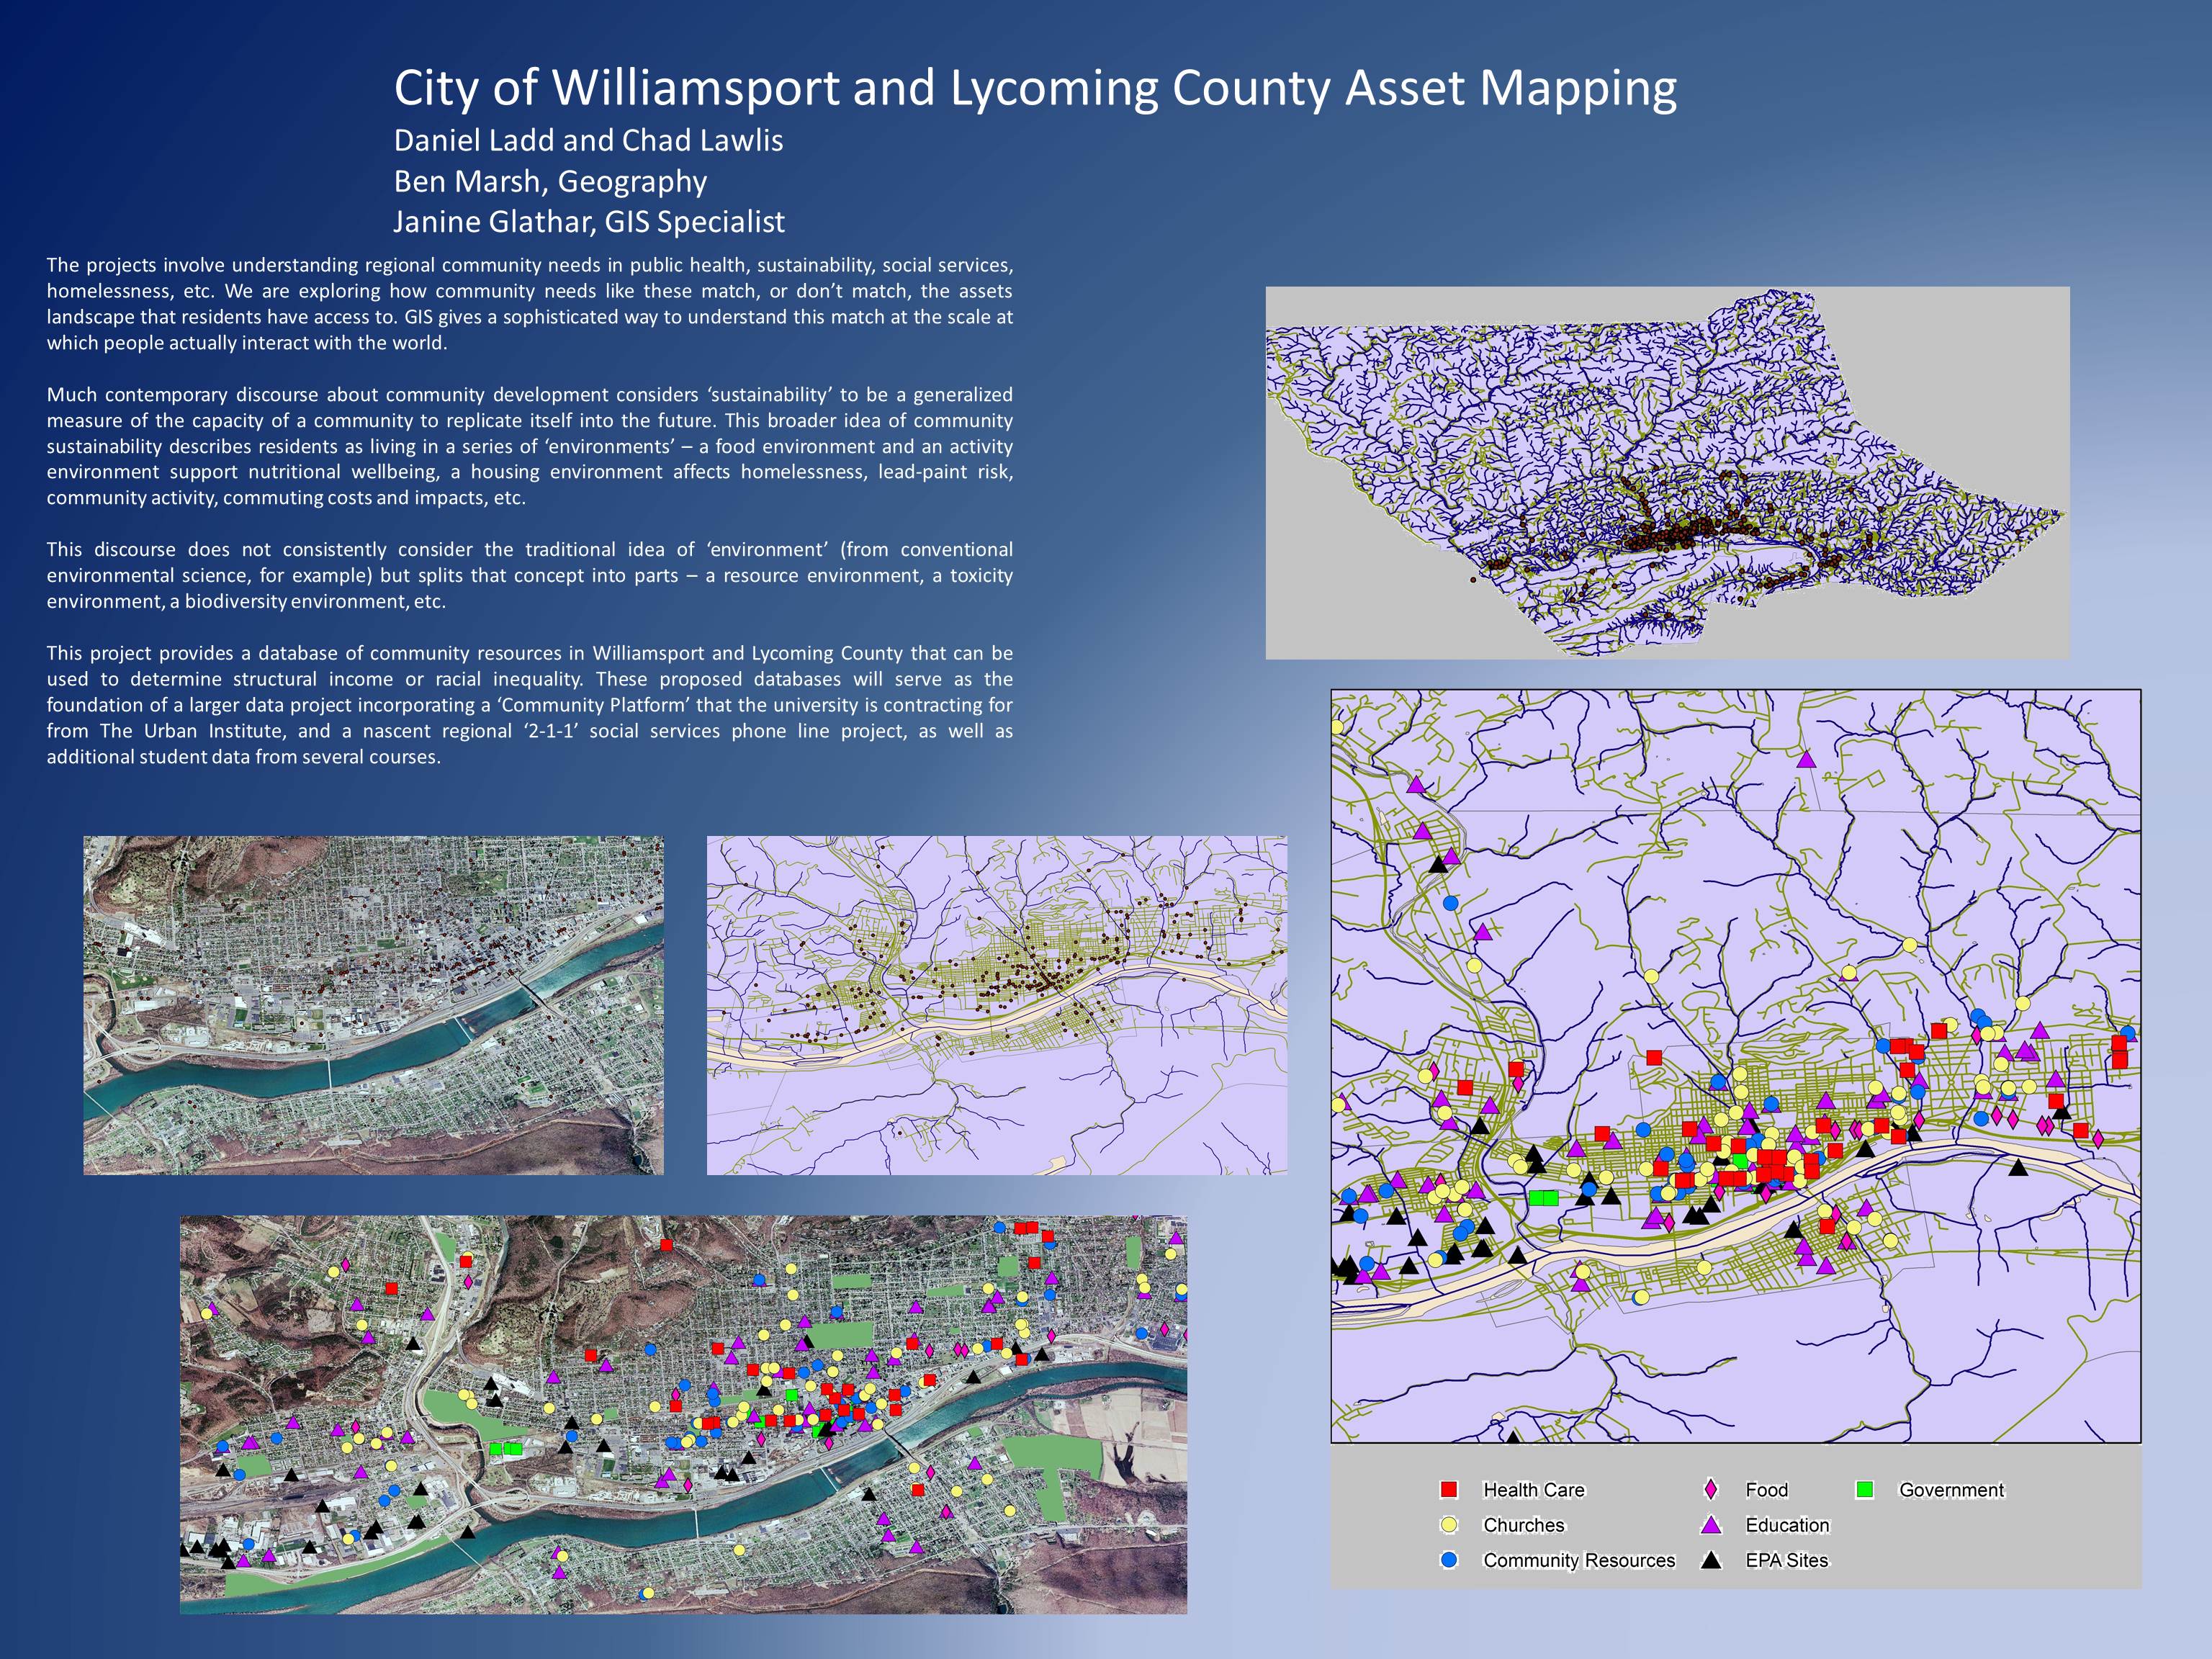
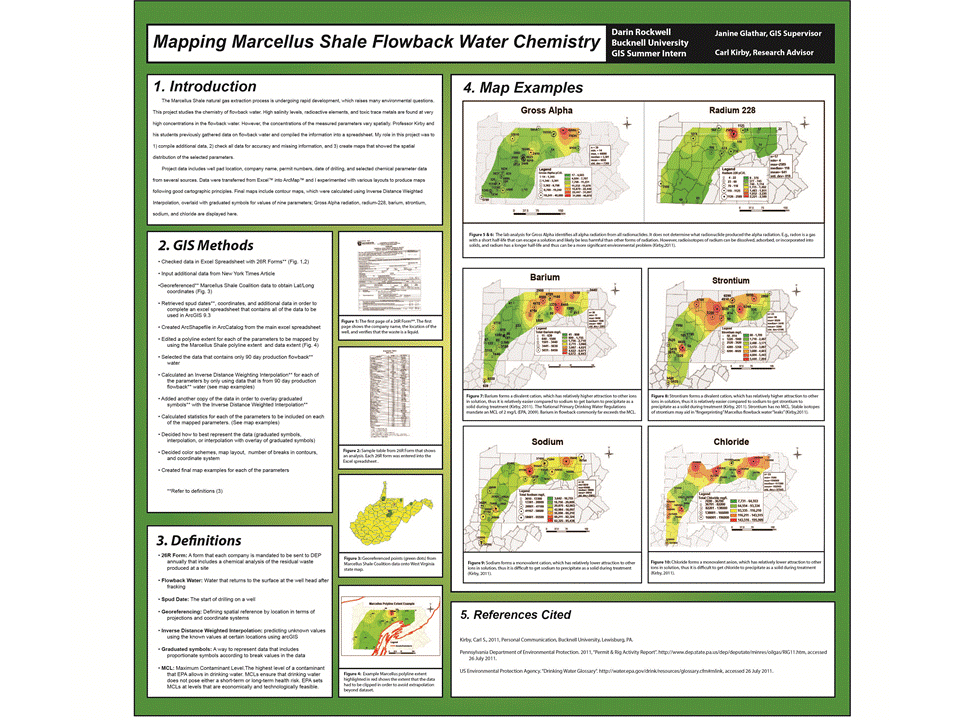
Bucknell’s summer GIS students recently got the opportunity to showcase their work at two separate poster symposiums. It helps to know a little bit about research/poster symposiums, for those who are unfamiliar. They are fairly straightforward. Participants set up their posters in a preassigned display location. Standing close by their posters, students field questions from interested attendees who wander the showcase, viewing posters of interest. The posters generally outline the basics of the research project first, before moving on to explain the more detailed aspects, like methodology and an analysis of the results. Space is limited so not everything can (and should!) be explained on the poster – and the student therefore must be prepared to answer fully any questions an attendee might ask. Many poster sessions are judged, with the winner awarded a prize (usually monetary). However, neither symposium the GIS students attended was judged.

GIS students attended their first symposium on Wednesday, July 27, 2011. The Sigma Xi Poster Session was held in Bucknell’s Terrace Room, located in the Elaine Langone Center. Approximately 50 students presented their work; six GIS students with eight separate posters were among them. Dozens of people turned out to view the posters, including Bucknell faculty, administrators, and members of the local community. Provost Mick Smeyer was among the attendees, and was so impressed with the quality and consistency of the work that he asked all attendees to repeat the session again in September for Bucknell’s President, John Bravman, and the Board of Trustees.

Students attended a second symposium on August 9, 2011 from 10am to 3pm. The First Annual Susquehanna Valley Undergraduate Research Symposium was held at the Geisinger Center for Health Research in Danville, Pennsylvania, about 30 minutes from Bucknell’s campus. Students from both Bucknell University and Bloomburg University were in attendance to showcase their summer research projects to their peers, interested academics, and Geisinger staff members. Bucknell’s GIS students contributed seven posters to the symposium, all of which received substantial praise and recognition.

Categories
Bucknell/Local Interest Environment General GIS GIS in Biology Slideshow

Mapping Species Ranges in the Sudan

Guest post by Dan Dougherty, Geography/History ’12

The GIS team here at Bucknell worked on numerous projects throughout the summer. The first of these major projects was the mapping of mammal species ranges in the Sudan. The project began as a request from Biology Professor DeeAnn Reeder, who was interested in adding species maps to the newest, upcoming edition of her publication. The objectives were twofold: make maps which clearly show the range of each species of interest superimposed over political delineations, and make an additional map showing the current political situation in the Sudan, independent of species ranges. Professor Reeder requested range maps for over 300 mammal species, which included large mammals, small mammals, and even bats. The maps do not necessarily show precisely where an animal could be found, however. Instead, the maps show where an animal might potentially be found, under ideal conditions. Human presence throughout the region reduces their numbers and often means that they cannot live in certain areas, even if those areas are favorable in all other aspects.

The species maps were limited to black & white due to publishing constraints. Overcoming this limitation was a particularly difficult cartographic challenge, but hopefully the end result displays the map information clearly and sensibly.

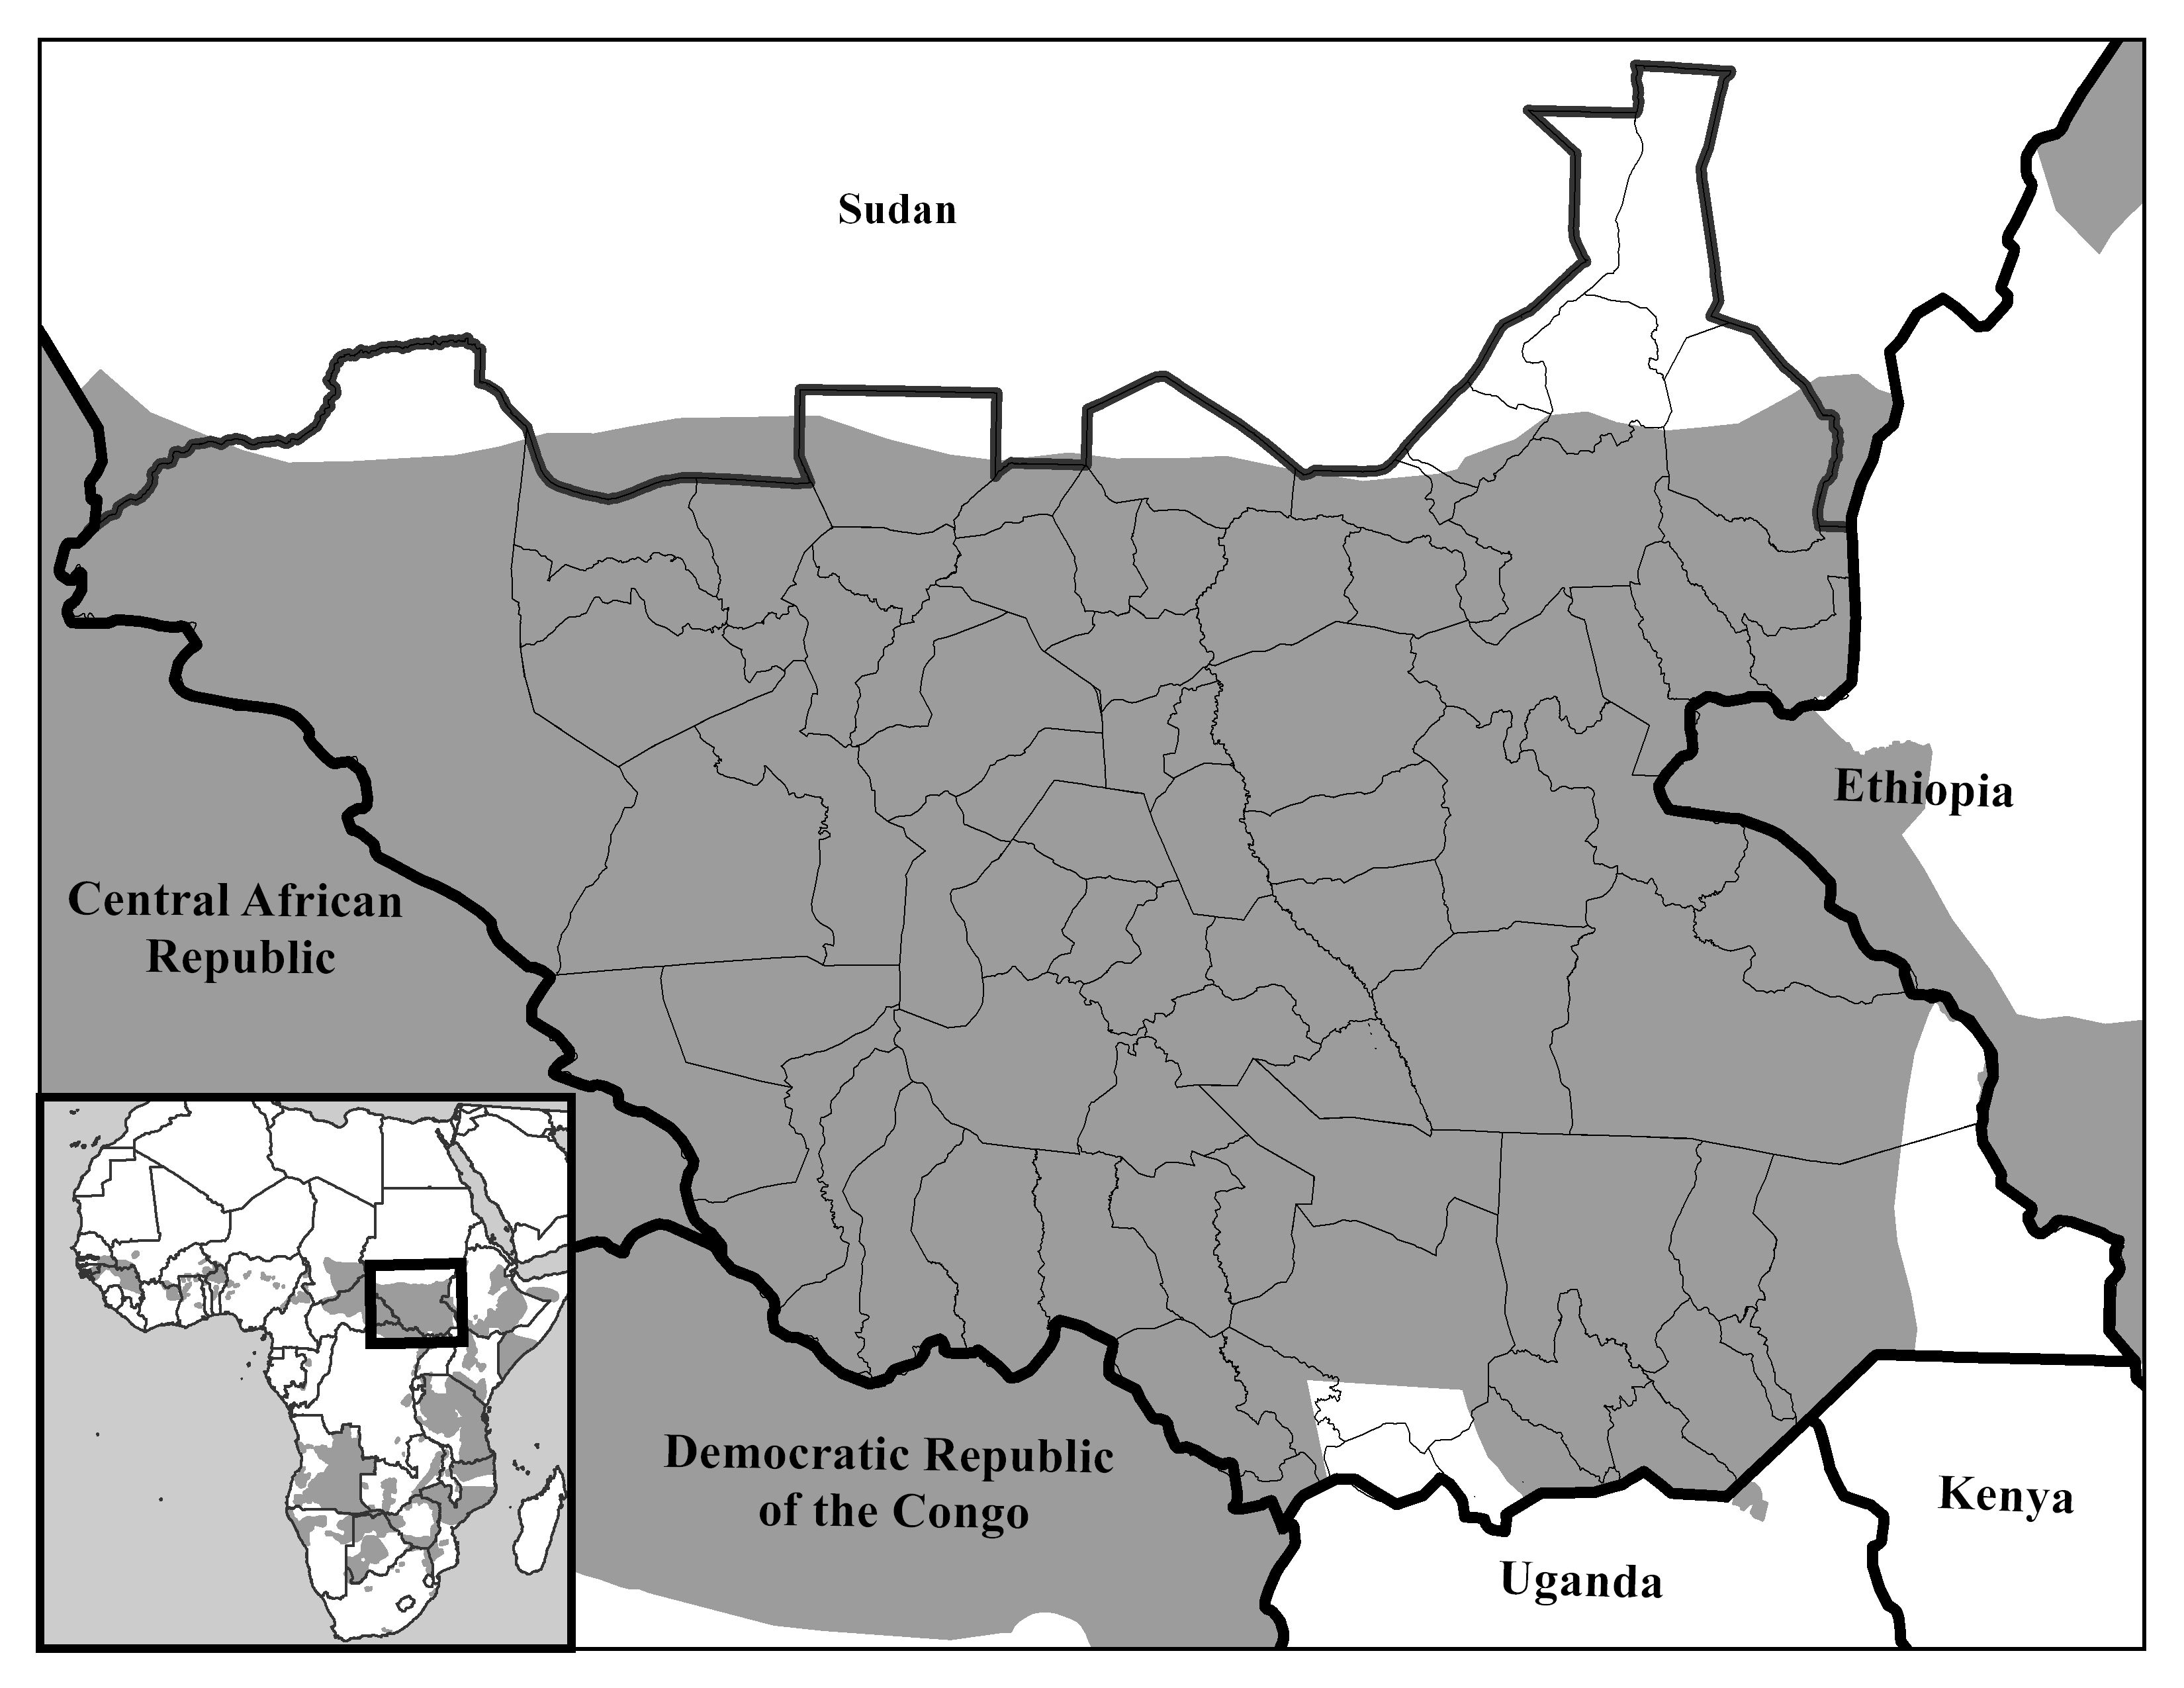
P. leo
This map shows the potential species range of the lion (gray shading)

Data was collected primarily from the International Union for the Conservation of Nature (IUCN) and the United Nations. The IUCN provides a comprehensive shapefile containing species range data for over 50,000 mammals. By querying the shapefile, it was possible to isolate the individual species ranges to be mapped; the queried shapefile was then exported. Political data was gathered from the United Nations Sudan Information Gateway. The regional political data was slightly modified using a clipping extent. An extent rectangle was drawn in Central Africa, encompassing all of Sudan and small portions of the surrounding states. All political data outside the extent was removed from the map after running the clip tool.

Showing species ranges in a political context was especially important to us. On July 9, 2011, South Sudan formally seceded from the rest of Sudan. So while the species maps on a basic level show the species ranges, they also provide a base for further analysis. What will be the effect of this newly formed political boundary on the livelihoods of the innumerable resident animal species, who are not constrained to arbitrary political borders? Specifically, the maps raise some questions about the effect of differing political, cultural, and social attitudes on habitat sustainability and conservation efforts. Furthermore, the potential for resulting conflict over natural resources and regional hegemony in the aftermath of the split might also carry significant consequences for the animal species. In addition, the maps also seek to illustrate the immense biodiversity of the region.