Categories
Bucknell/Local Interest Digital Humanities Events/Calendar GIS & Environmental Justice GIS by Academic Discipline GIS in Art GIS in Biology GIS in Computer Science GIS in Economics GIS in Engineering GIS in Environmental Studies GIS in Film Studies GIS in Geography GIS in Geology GIS in History GIS in Humanities GIS in Political Science GIS in Psychology GIS in Public Health GIS in Social Science GIS in Sociology GIS in Women's Studies GIScience, Pedagogy & Spatial Thinking Slideshow

Register & Submit Presentations for Bucknell-hosted GIS conference

We recently launched the conference website for the upcoming Bucknell-hosted conference GIS & Spatial Thinking in the Undergraduate Curriculum.  Basic info is shown below, but please check out the conference website for details and updates as they become available.

About the Conference:

  • When: November 16-18, 2012
  • Where: Bucknell University, Lewisburg, PA. Click here for a map.
  • Details: Click on the pages shown on the menu above to access information onregistrationlodging, conference schedule, and submitting presentations and maps.
  • Deadlines:  Deadline for early bird registration is September 15, 2012. Deadline forsubmitting presentations and maps is September 21, 2012.
  • Format:  We have chosen a work-group format for the conference in order to maximize opportunities for discussion and brain-storming amongst participants. The main day of the conference will feature five work-group sessions. Each session will consist of 45 minutes of presentations and 45 minutes of open discussion organized around a theme. We are seeking 3 presenters and 1 chairperson for each of the 5 sessions. See the submissions page for a detailed description of each of the session topics:
    • 1a (Concurrent with 1b) – Mapping Human Activity – Qualitative Analysis GIS
    • 1b (Concurrent with 1a) – Quantitative Analysis & Technical Applications of GIS
    • 2   (Single group) – GIS in Pedagogy
    • 3a (Concurrent with 3b) – GIS in Community Outreach & Service Learning
    • 3b (Concurrent with 3a) – Software & Data Issues in GIS Instruction
  • Goals: Desired outcomes include: (1) providing mutual support for imaginative and challenging applications of spatial technology in undergraduate education; (2) fostering potential collaborative efforts between and within participant schools, such as joint research initiatives and/or shared resources for data, web maps and teaching materials, and; (3) creating a regional community of faculty and GIS/IT staff to interact on a regular basis, share information, and exchange ideas about the priorities identified during the conference.

This event is sponsored by Library & Information Technology at Bucknell University. Should you have any questions, please contact Janine Glathar at jlg046@bucknell.edu or (570) 577-1990.


Categories
Bucknell/Local Interest General GIS GIS in Biology Slideshow

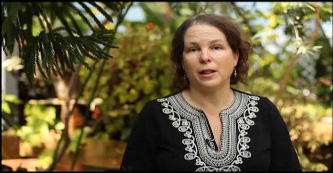
Interview with Biology Prof. DeeAnn Reeder about using GIS in teaching and research

Over the 2010-11 academic year, a team of GIS student assistants worked with Prof. DeeAnn Reeder to develop maps and GIS data for use in her teaching and research.

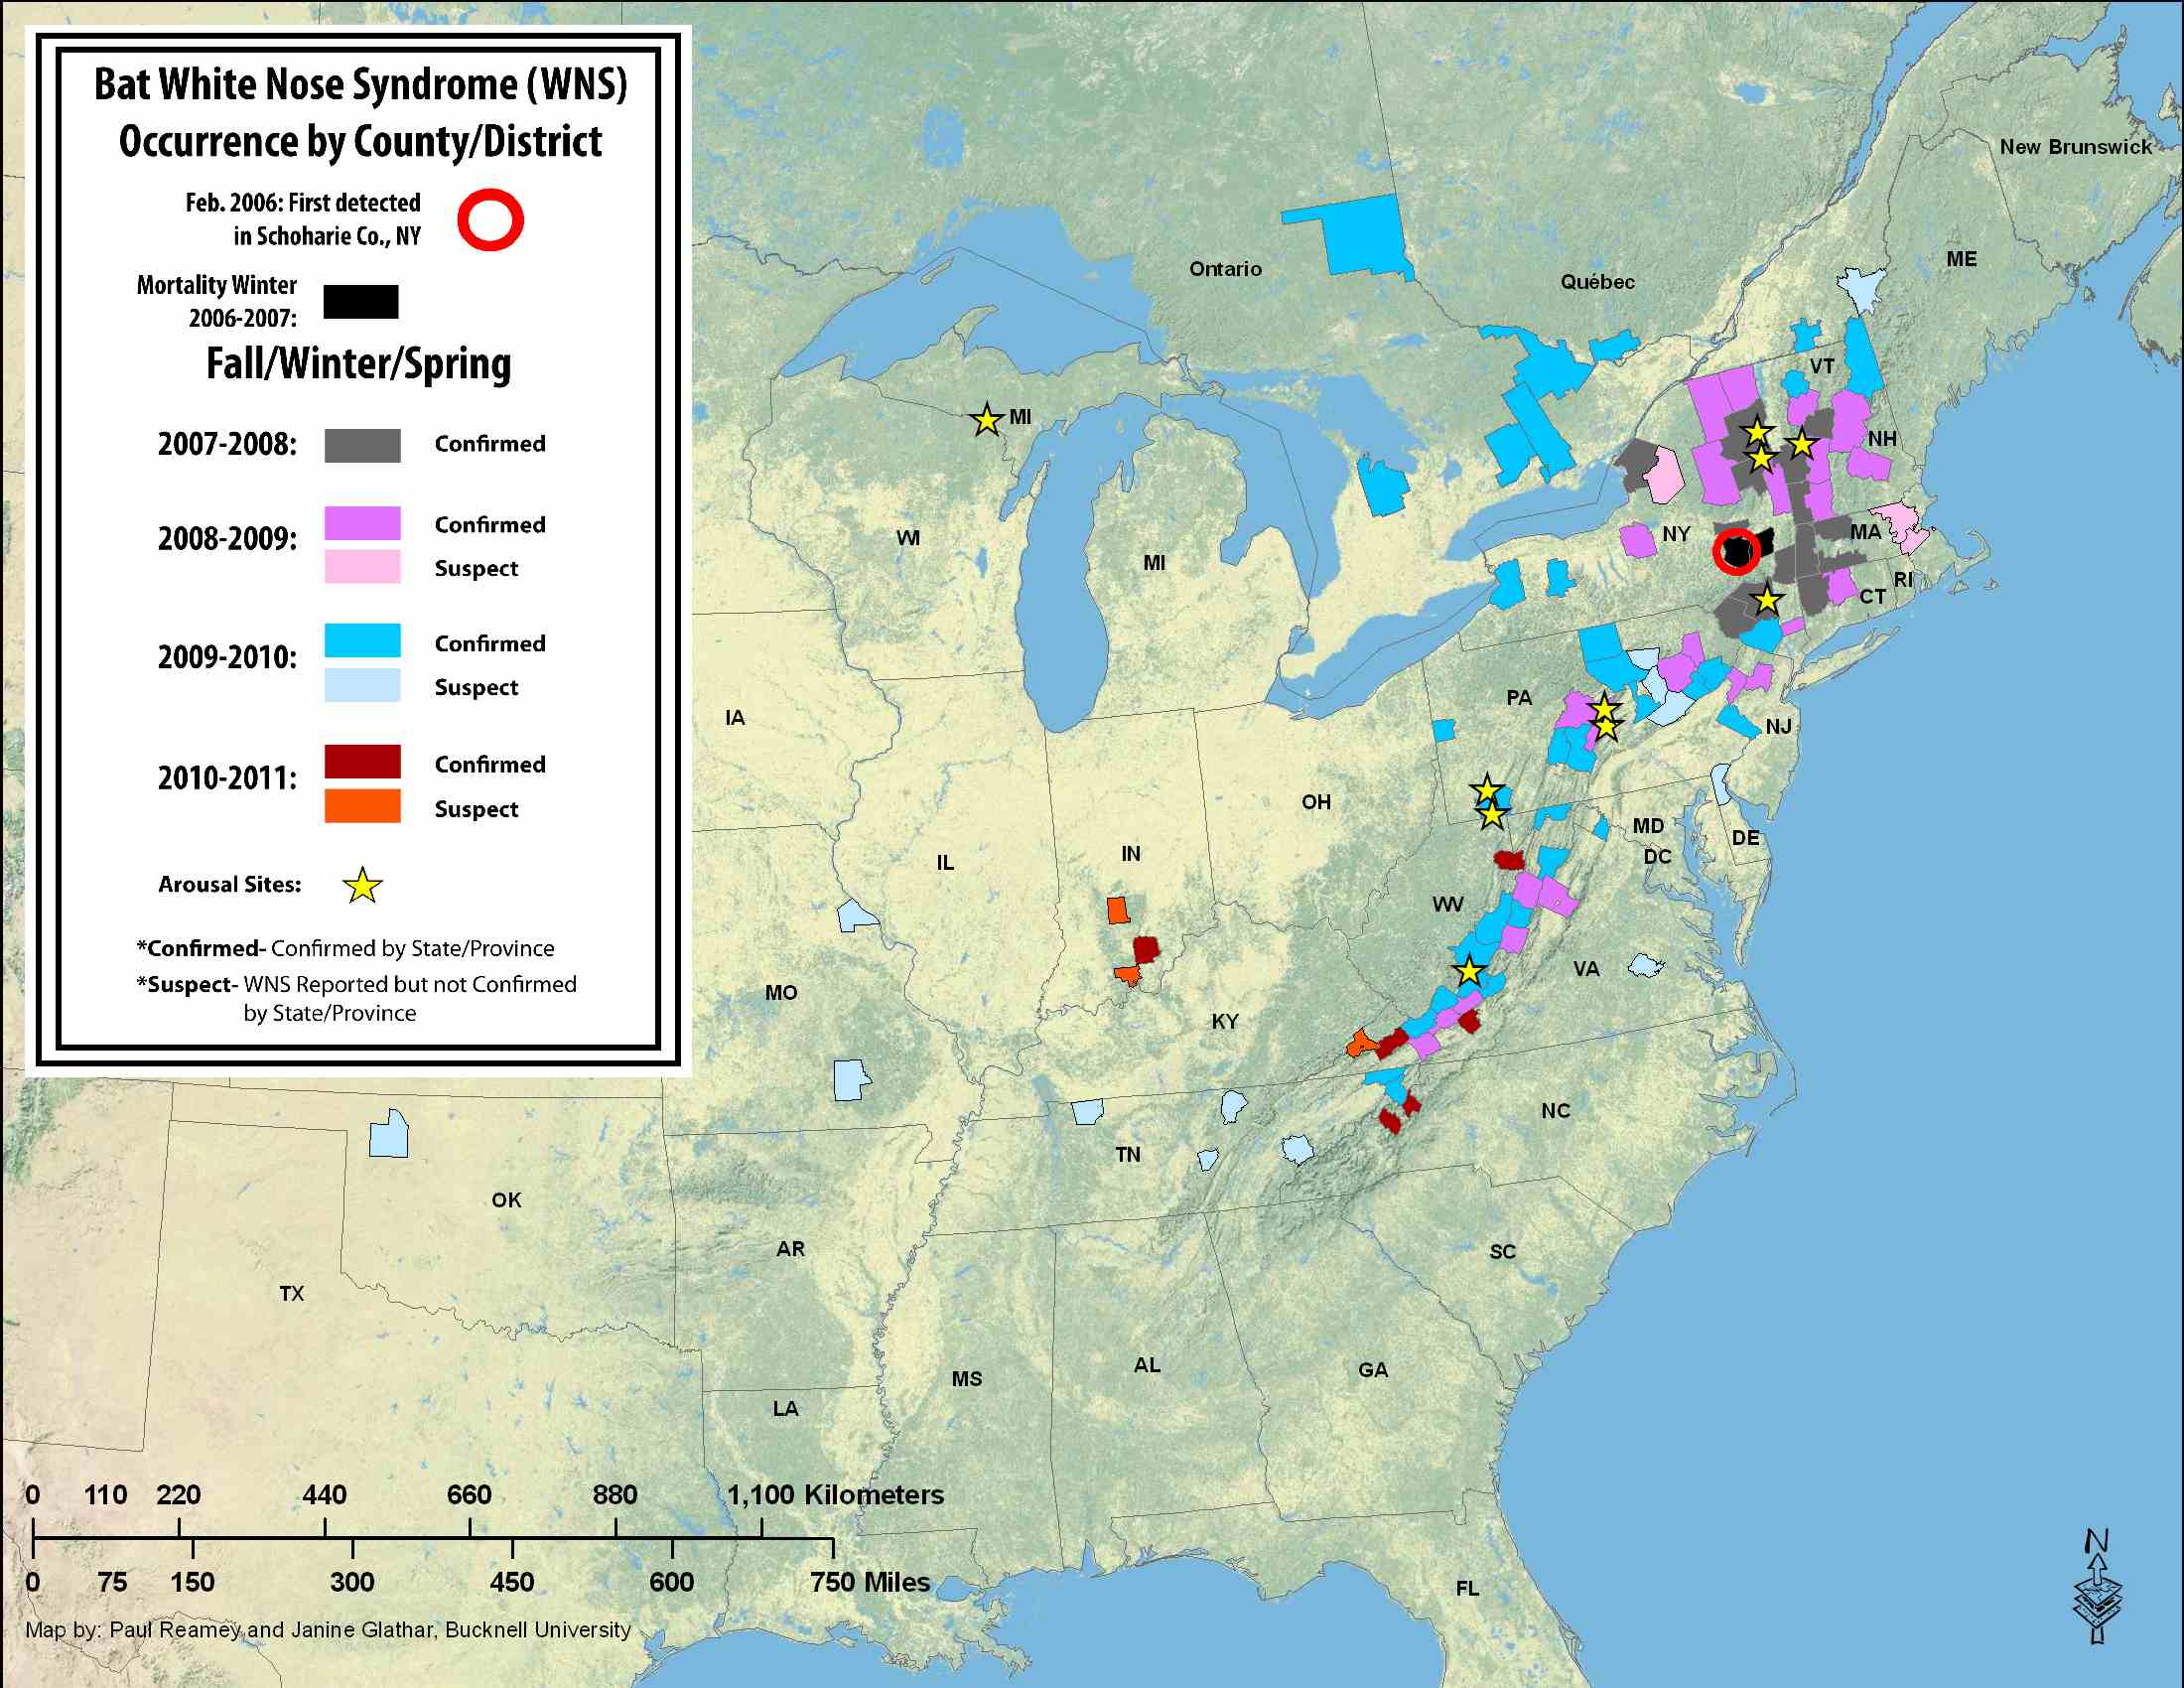
Ted Heitzman, ’12 and Paul Reamey, ’11 developed a series of maps and datasets for Prof. Reeder’s work on white-nose syndrome in bats.

Dan Dougherty, Geography/History ’12 and Mike Grasso, Environmental Studies ’13, worked with with Prof. Reeder and her research assistant Megan Vodzak, Biology ’08, on developing maps for a field guide atlas of mammals in Sudan.

Below is an interview* with Prof. Reeder about those two projects and her future plans for using GIS both in the field and in the classroom.

*One of these days I’ll wear a mic so that you can actually hear my questions.

video platform video management video solutions video player

Categories
Bucknell/Local Interest Environment General GIS GIS in Biology Slideshow

Mapping Species Ranges in the Sudan

Guest post by Dan Dougherty, Geography/History ’12

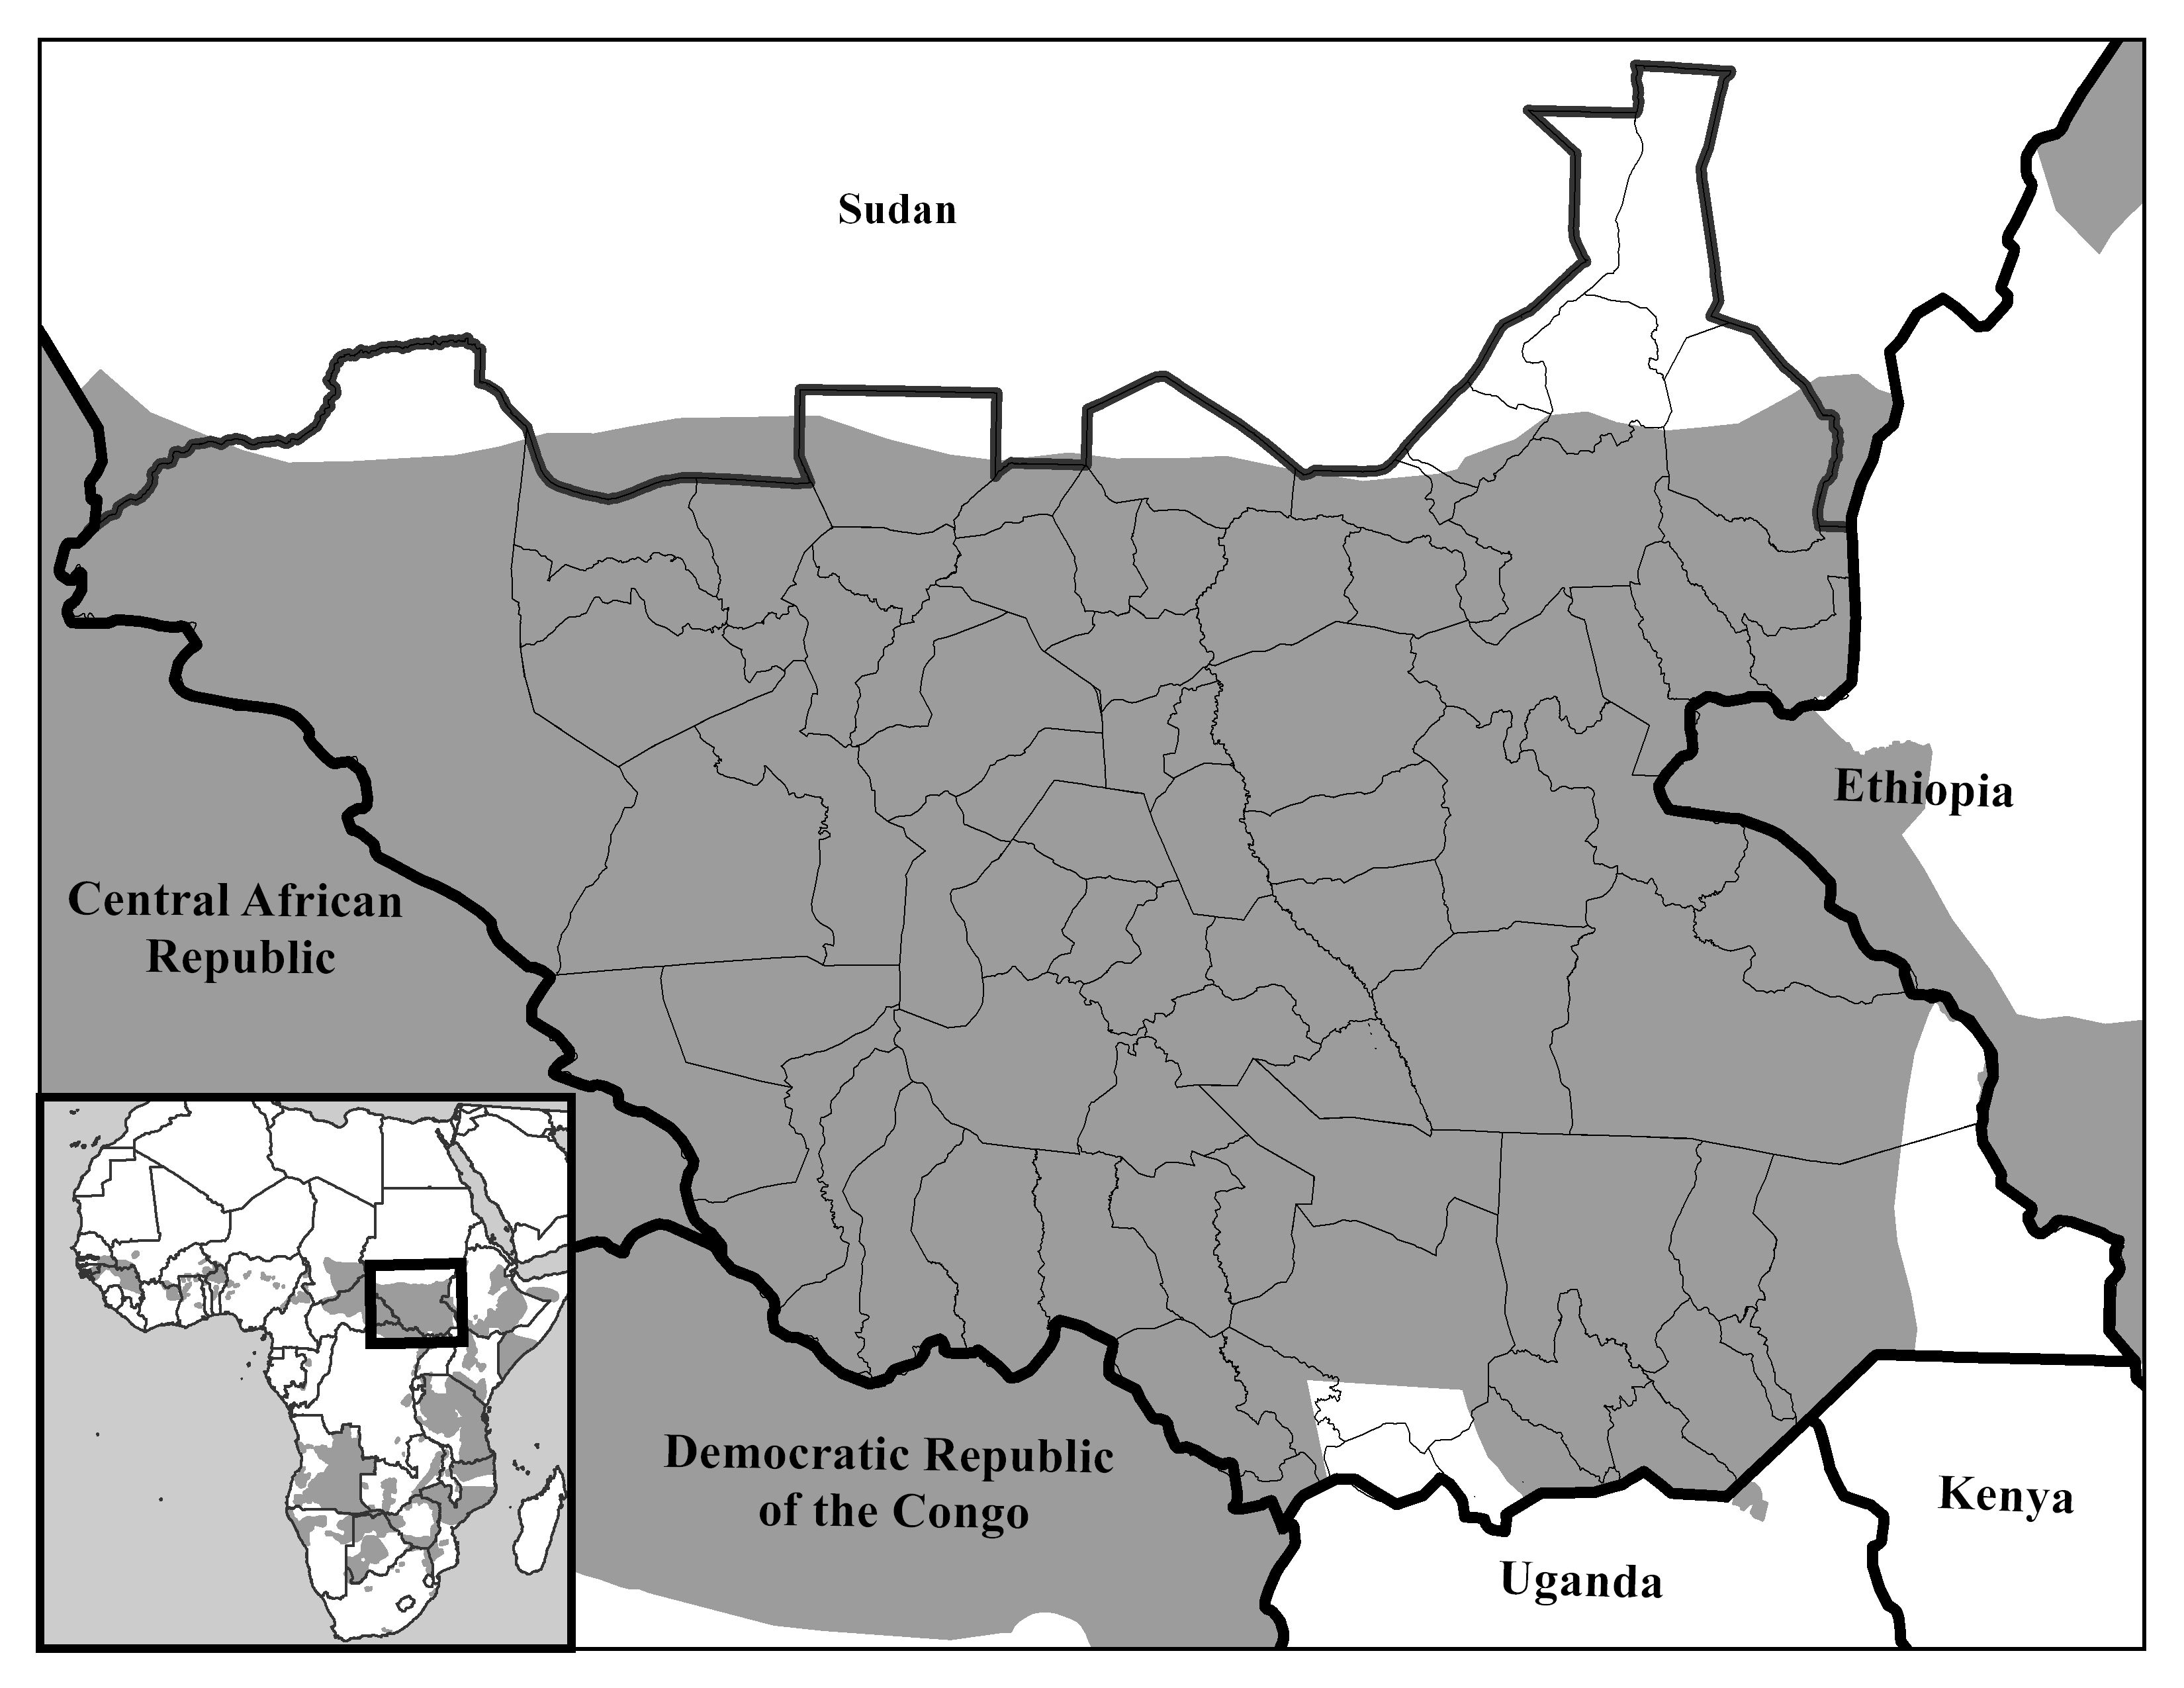
The GIS team here at Bucknell worked on numerous projects throughout the summer. The first of these major projects was the mapping of mammal species ranges in the Sudan. The project began as a request from Biology Professor DeeAnn Reeder, who was interested in adding species maps to the newest, upcoming edition of her publication. The objectives were twofold: make maps which clearly show the range of each species of interest superimposed over political delineations, and make an additional map showing the current political situation in the Sudan, independent of species ranges. Professor Reeder requested range maps for over 300 mammal species, which included large mammals, small mammals, and even bats. The maps do not necessarily show precisely where an animal could be found, however. Instead, the maps show where an animal might potentially be found, under ideal conditions. Human presence throughout the region reduces their numbers and often means that they cannot live in certain areas, even if those areas are favorable in all other aspects.

The species maps were limited to black & white due to publishing constraints. Overcoming this limitation was a particularly difficult cartographic challenge, but hopefully the end result displays the map information clearly and sensibly.

P. leo
This map shows the potential species range of the lion (gray shading)

Data was collected primarily from the International Union for the Conservation of Nature (IUCN) and the United Nations. The IUCN provides a comprehensive shapefile containing species range data for over 50,000 mammals. By querying the shapefile, it was possible to isolate the individual species ranges to be mapped; the queried shapefile was then exported. Political data was gathered from the United Nations Sudan Information Gateway. The regional political data was slightly modified using a clipping extent. An extent rectangle was drawn in Central Africa, encompassing all of Sudan and small portions of the surrounding states. All political data outside the extent was removed from the map after running the clip tool.

Showing species ranges in a political context was especially important to us. On July 9, 2011, South Sudan formally seceded from the rest of Sudan. So while the species maps on a basic level show the species ranges, they also provide a base for further analysis. What will be the effect of this newly formed political boundary on the livelihoods of the innumerable resident animal species, who are not constrained to arbitrary political borders? Specifically, the maps raise some questions about the effect of differing political, cultural, and social attitudes on habitat sustainability and conservation efforts. Furthermore, the potential for resulting conflict over natural resources and regional hegemony in the aftermath of the split might also carry significant consequences for the animal species. In addition, the maps also seek to illustrate the immense biodiversity of the region.

Categories
Bucknell/Local Interest Data Digital Humanities Environment General GIS GIS in Biology GIS in Computer Science GIS in Engineering GIS in Environmental Studies GIS in Geography GIS in Geology GIS in History GIS in Humanities GIS in Psychology GIS in Sociology Map Apps Marcellus Shale Miller Run Restoration Project Slideshow

What we’re up to this summer (and why we’re not posting)

Thanks to the Mellon grant and a huge number of faculty teaching and research projects it’s been a very busy summer of GIS work at Bucknell.  Over the coming weeks I’ll write detailed posts about the work we’re doing on each of the projects.  If I’m really ambitious I might try to post some interviews with faculty and students – and some footage of the aerial drone flights that Nick Urban ’12 is doing. But for now here’s a short overview of who’s doing GIS work at Bucknell this summer and what we’re doing:

GIS Student Assistants:

  • Chad Lawlis, Environmental Studies ’11
  • Dan Dougherty, Geography/History ’12
  • Max Stiss, Geography/Anthropology ’12
  • Nick Urban, Computer Science ’12
  • Mike Grasso, Environmental Studies ’13
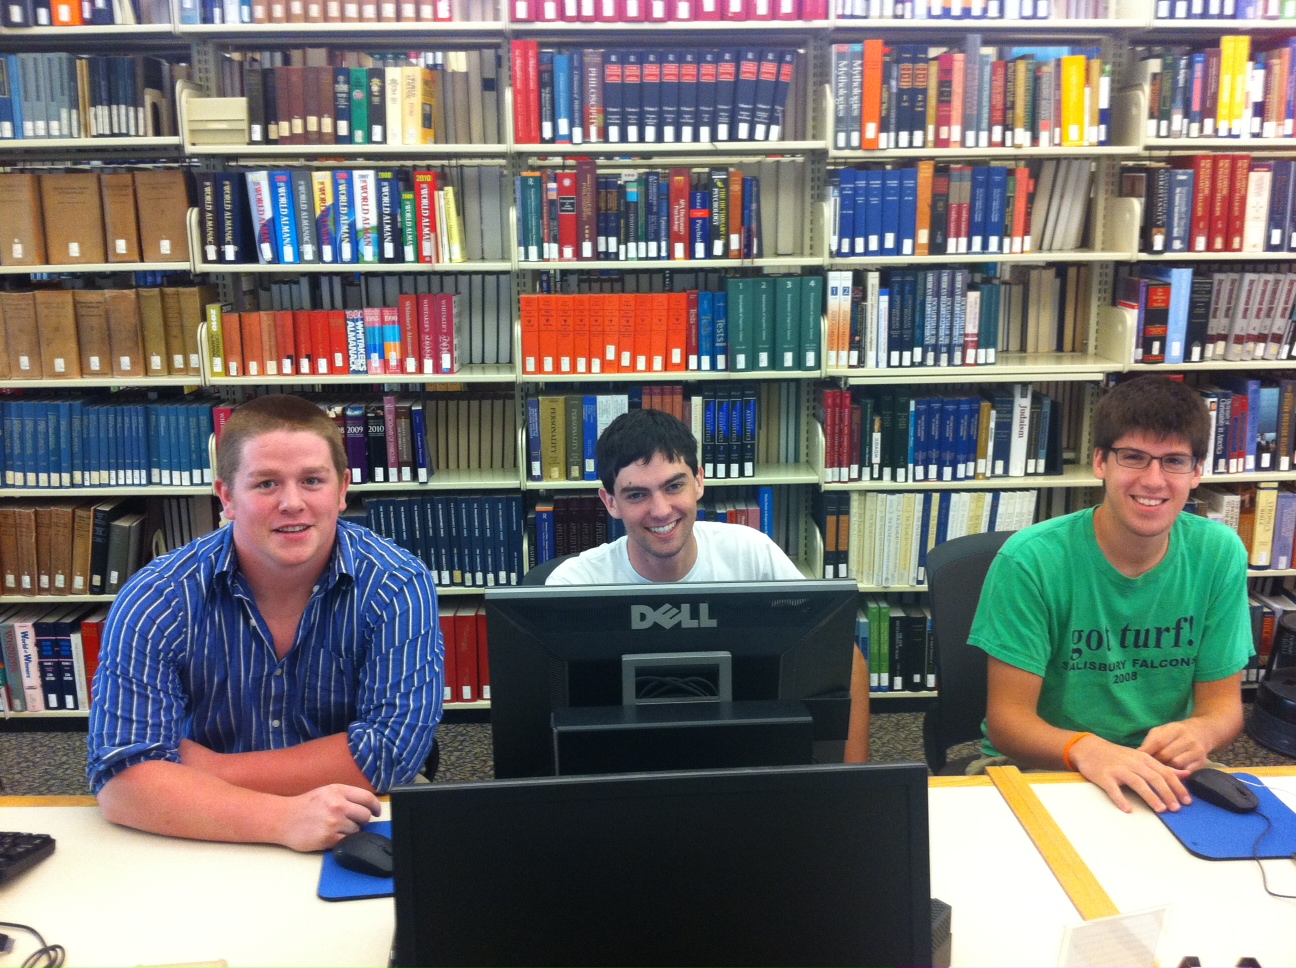
  • Robby Holler, Geography/International Relations ’13 (pictured below)
  • Darin Rockwell, Geography/Geology ’13 (pictured below)
  • Dan Ladd, Middlebury College ’14 (pictured below)

Key Projects:

  • Maps for Sudan field guide atlas to mammals
  • GPS data collection for Lewisburg Cemetary
  • GPS data collection for Miller Run restoration project
  • Aerial drone data collection for Miller Run restoration project
  • Lycoming County/Williamsport community asset mapping
  • Mapping toxic contamination from Marcellus Shale natural gas wells
  • Mapping locations of Marcellus Shale water withdrawl permits
  • Georeferencing & vectorizing 19th century economic maps of Vietnam
  • Georeferencing & vectorizing maps of environmental hazards and resources in Kyrgyzstan
  • Georeferencing & vectorizing 1868 Historic Atlas of Union & Snyder Counties
  • Data development for Stories of the Susquehanna project
  • Support for student research projects – including GPS’ing dumpster locations on campus for an analysis of campus waste and recycling, and updating Arboretum tree dataset with location info for newly planted and felled trees
  • Develop pilot web map apps for showcasing faculty research
  • Develop pilot web map apps for use in teaching
  • Implement backend IT infrastructure to support ArcGIS server
  • Maps for Bucknell admin purposes, including: analysis of parking shortages on campus; maps for task force report on campus climate; maps for SBDC report on services by county; arts festival map.


Categories
Bucknell/Local Interest Environment Events/Calendar General GIS GIS in Biology Slideshow

Do turtles with more powerful predators have stronger shells?

Do turtles with more powerful predators have stronger shells?

Over the last year, Biology professor Tristan Stayton used GIS and finite element analysis methods to explore this question. During Summer 2010, Prof. Stayton participated in a Library & IT workshop designed to give faculty hands-on experience using GIS for academic research and teaching.  Over the course of the summer, Prof. Stayton and his student researchers used ArcGIS to georeference and digitize turtle species ranges to convert them from image files into GIS data that could be used as input in Prof. Stayton’s analysis.  The same techniques were also used to digitize the ranges of 25 known turtle predators.

During the 2010-11 academic year, Prof. Stayton used the GIS datasets created during summer 2010 to calculate range sizes and range overlaps of turtles and their predators – and then to derive measures of turtle predation pressure. Prof. Stayton presented his conclusions last month at the Evolution 11 conference in Norman, Oklahoma and has a paper in the works as well.

The answer to the question? The short answer is that no, turtles with more powerful predators do not have stronger shells – in fact, they appear to have evolved weaker shell shapes.  But be sure to look at the poster below for a full presentation of the methodology, results and possible explanations for the findings.

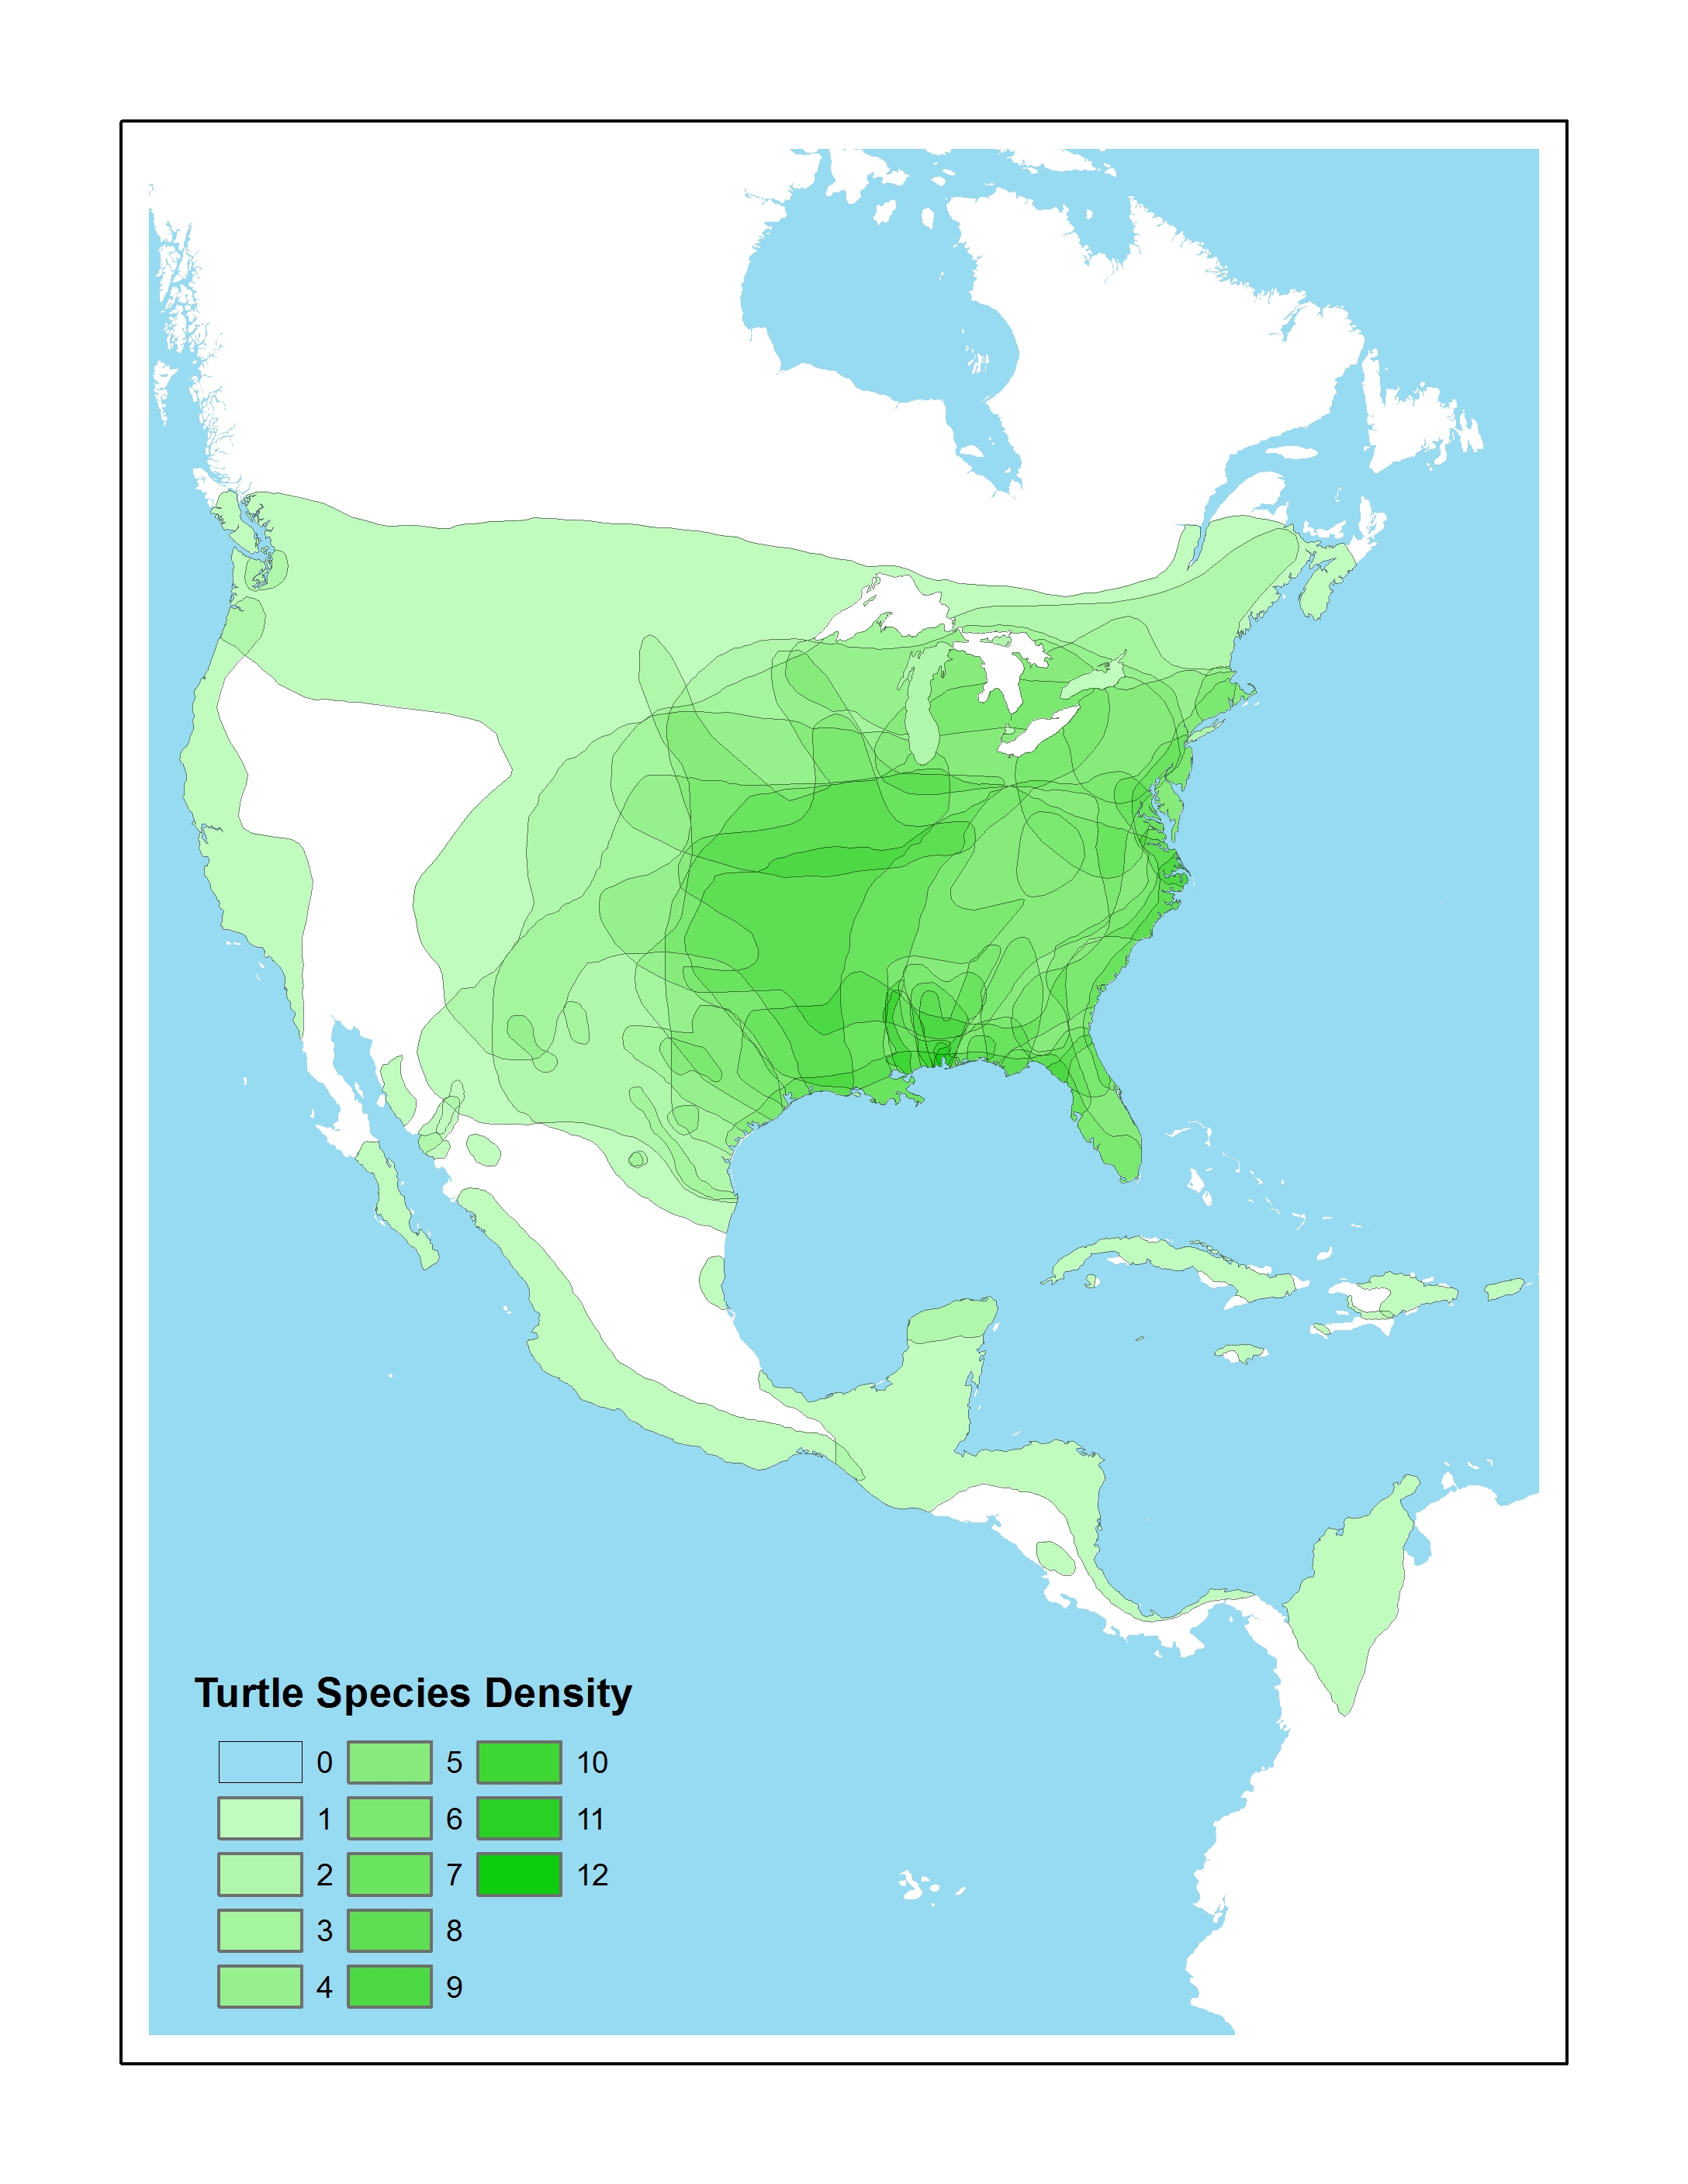
Students involved in this project: Christine Vega ’11, Patrick Caloz ’13 and Joe Budzinski ’11 (georeferencing & vectorizing species ranges); Dan Ladd, GIS Student Assistant, Middlebury College ’14 (created turtle species density map shown in poster)