Categories
Bucknell/Local Interest Digital Humanities Events/Calendar GIS & Environmental Justice GIS by Academic Discipline GIS in Art GIS in Biology GIS in Computer Science GIS in Economics GIS in Engineering GIS in Environmental Studies GIS in Film Studies GIS in Geography GIS in Geology GIS in History GIS in Humanities GIS in Political Science GIS in Psychology GIS in Public Health GIS in Social Science GIS in Sociology GIS in Women's Studies GIScience, Pedagogy & Spatial Thinking Slideshow

Register & Submit Presentations for Bucknell-hosted GIS conference

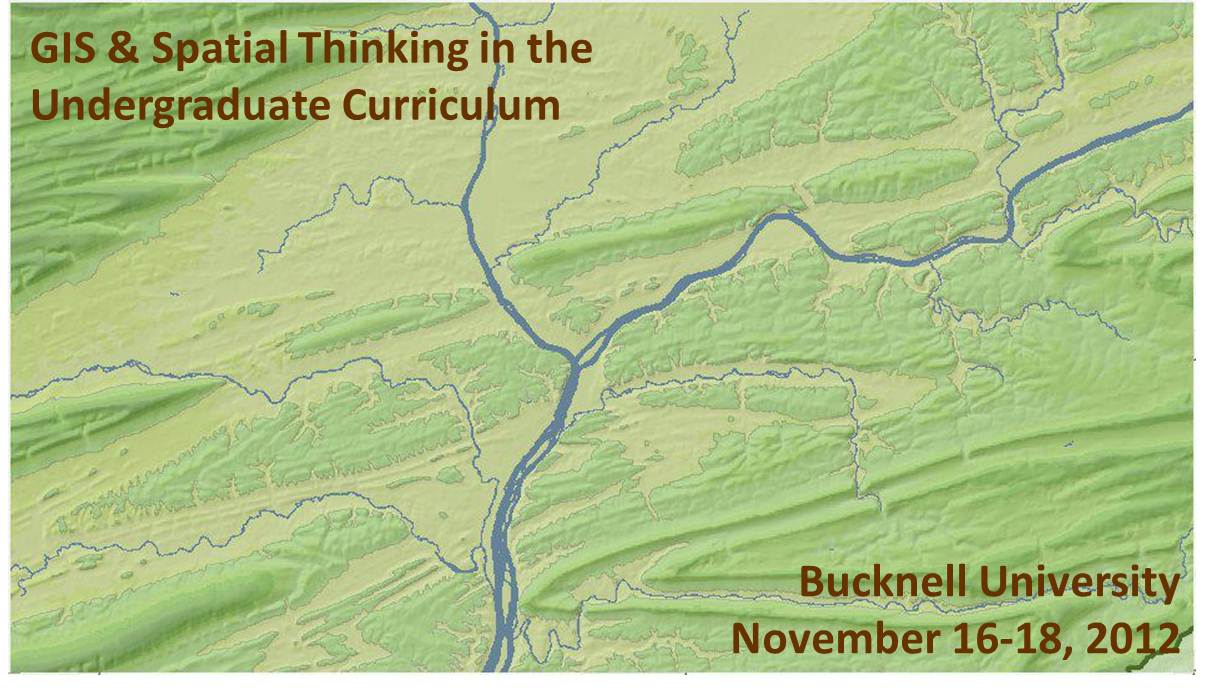
We recently launched the conference website for the upcoming Bucknell-hosted conference GIS & Spatial Thinking in the Undergraduate Curriculum.  Basic info is shown below, but please check out the conference website for details and updates as they become available.

About the Conference:

  • When: November 16-18, 2012
  • Where: Bucknell University, Lewisburg, PA. Click here for a map.
  • Details: Click on the pages shown on the menu above to access information onregistrationlodging, conference schedule, and submitting presentations and maps.
  • Deadlines:  Deadline for early bird registration is September 15, 2012. Deadline forsubmitting presentations and maps is September 21, 2012.
  • Format:  We have chosen a work-group format for the conference in order to maximize opportunities for discussion and brain-storming amongst participants. The main day of the conference will feature five work-group sessions. Each session will consist of 45 minutes of presentations and 45 minutes of open discussion organized around a theme. We are seeking 3 presenters and 1 chairperson for each of the 5 sessions. See the submissions page for a detailed description of each of the session topics:
    • 1a (Concurrent with 1b) – Mapping Human Activity – Qualitative Analysis GIS
    • 1b (Concurrent with 1a) – Quantitative Analysis & Technical Applications of GIS
    • 2   (Single group) – GIS in Pedagogy
    • 3a (Concurrent with 3b) – GIS in Community Outreach & Service Learning
    • 3b (Concurrent with 3a) – Software & Data Issues in GIS Instruction
  • Goals: Desired outcomes include: (1) providing mutual support for imaginative and challenging applications of spatial technology in undergraduate education; (2) fostering potential collaborative efforts between and within participant schools, such as joint research initiatives and/or shared resources for data, web maps and teaching materials, and; (3) creating a regional community of faculty and GIS/IT staff to interact on a regular basis, share information, and exchange ideas about the priorities identified during the conference.

This event is sponsored by Library & Information Technology at Bucknell University. Should you have any questions, please contact Janine Glathar at jlg046@bucknell.edu or (570) 577-1990.


Categories
Data General GIS GIS in Art GIS in Computer Science Slideshow Videos

Phone-call cartography

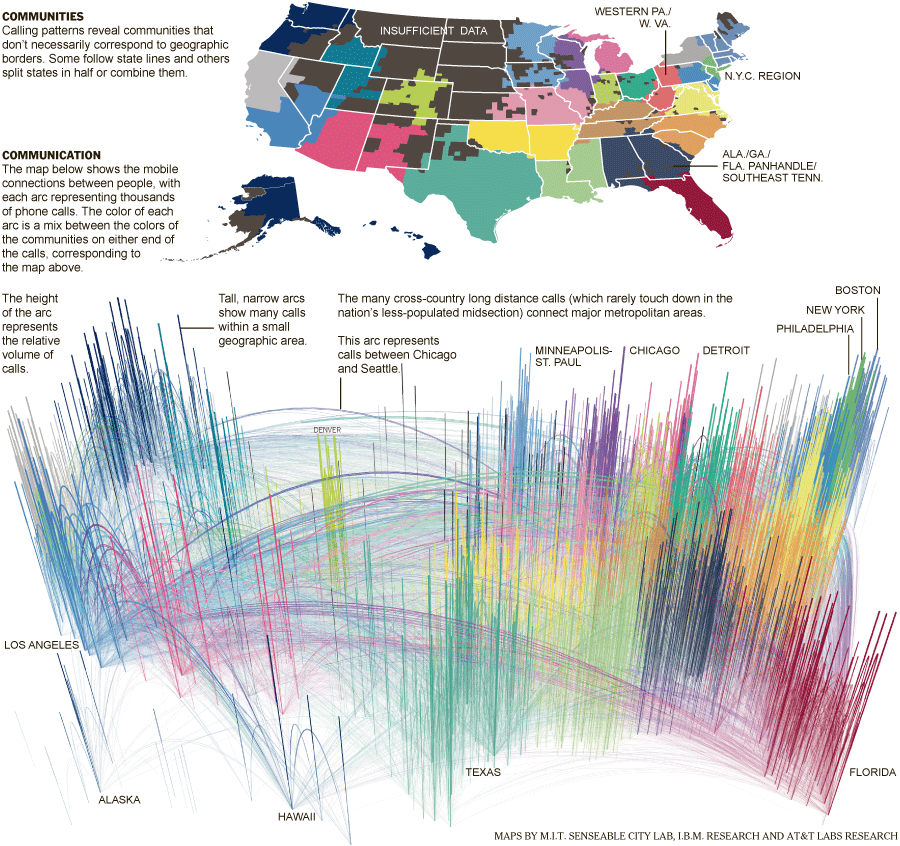
Here’s a link to an interesting NYT story, “Phone-call cartography,”  on mapping connectedness via data points from mobile phone calls.  The accompanying map was produced by M.I.T.’s SENSEable City Lab using the origin and end point locations for cellphone traffic within the U.S. in July of last year.

Phone-call cartography video:

httpv://www.youtube.com/watch?v=eFKZnbIAboI

Phone-call cartography map:


The “Phone-call cartography” map project is just the latest in a long series of projects the SENSEable City Lab has done using cellphone data to explore the idea of connectedness.  In 2008, the group produced a map installation called “New York Time Exchange” for the NYC MoMA’s ‘Design and the Elastic Mind’ exhibition. The installation featured wall-sized maps displaying nearly real-time data on cellphone calls with origins and/or destinations in the New York City area. See this Newsweek article or this NYT article for more information about the “New York Time Exchange” exhibit and how SENSEable’s research is informing our understanding of globalization, the digital divide and other measures of connectedness.

Click here to read an article about SENSEable’s use of real-time cell phone data to analyze the economic impact of New York City’s 2008 ‘Waterfalls’ exhibit in New York Harbor.

Categories
General GIS GIS in Art Slideshow Videos

From the wilderness downtown to a Grammy win

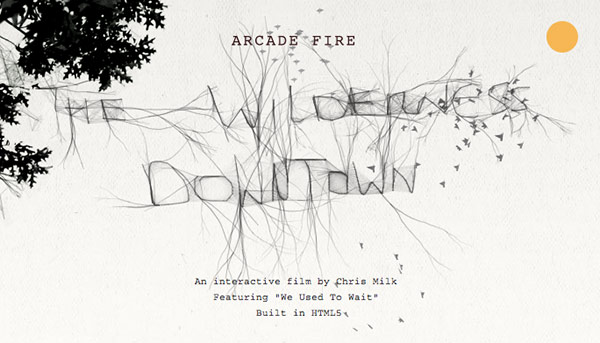
In honor of Arcade Fire’s Grammy win last night for album of the year, here’s a link to their video/interactive map app for song ‘We Used to Wait’ from The Suburbs.  You’ll have to download Google Chrome to experience “The Wilderness Downtown” but it’s worth the couple of seconds it’ll take to do it. As mashable.com put it, “it’s basically one big ball of HTML5/Google Maps/musical goodness.”

Categories
General GIS GIS in Art

Map Your Music Memories

The Grammys and Music Is Life, Life is Music have launched  a new mobile app that allows you to tag locations on a map with a music marker – could be the club you’re going to see a show at later this weekend, the place you heard a song for the first time, or any other music-related comment or memory.

From the Grammys blog:

“You can share your tag by posting to your Facebook profile or Twitter account. The app integrates with Flickr and Foursquare data by highlighting concert venues via Foursquare, and promoting Flickr photo data of GRAMMY-related artists and venues.

As more users tag the map, you’re able to view what music inspires others at any given location, such as your neighborhood, a popular venue or your favorite travel destination. I’d argue the coolest part about the app is that several featured artists will be using the app and their tags are featured on the map by a special marker. For example, by filtering the map for music artists, you can see several tags and notes posted by Katy Perry. The Recording Academy says more artists will be featured within the app as we get closer to the 53rd GRAMMY Awards.”

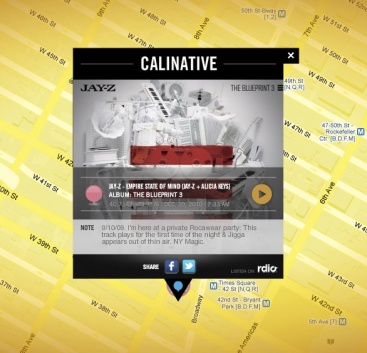
Here’s one of JayZ’s music memories: