Categories
Bucknell/Local Interest Digital Humanities Events/Calendar GIS & Environmental Justice GIS by Academic Discipline GIS in Art GIS in Biology GIS in Computer Science GIS in Economics GIS in Engineering GIS in Environmental Studies GIS in Film Studies GIS in Geography GIS in Geology GIS in History GIS in Humanities GIS in Political Science GIS in Psychology GIS in Public Health GIS in Social Science GIS in Sociology GIS in Women's Studies GIScience, Pedagogy & Spatial Thinking Slideshow

Register & Submit Presentations for Bucknell-hosted GIS conference

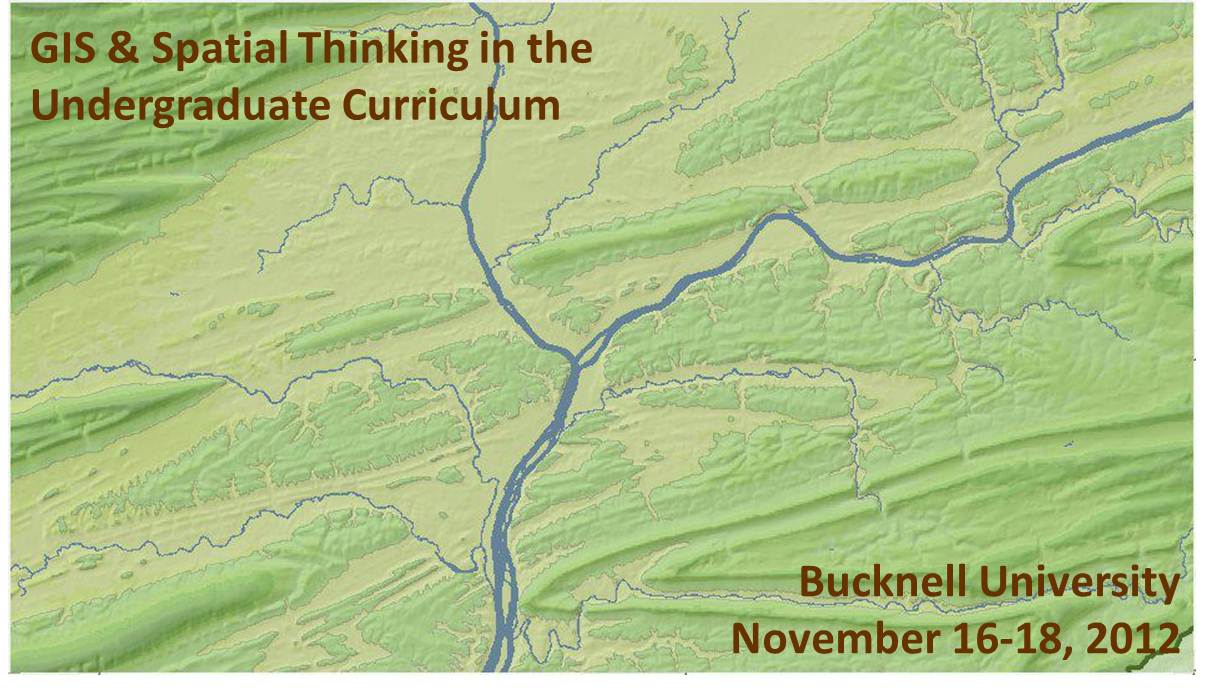
We recently launched the conference website for the upcoming Bucknell-hosted conference GIS & Spatial Thinking in the Undergraduate Curriculum.  Basic info is shown below, but please check out the conference website for details and updates as they become available.

About the Conference:

  • When: November 16-18, 2012
  • Where: Bucknell University, Lewisburg, PA. Click here for a map.
  • Details: Click on the pages shown on the menu above to access information onregistrationlodging, conference schedule, and submitting presentations and maps.
  • Deadlines:  Deadline for early bird registration is September 15, 2012. Deadline forsubmitting presentations and maps is September 21, 2012.
  • Format:  We have chosen a work-group format for the conference in order to maximize opportunities for discussion and brain-storming amongst participants. The main day of the conference will feature five work-group sessions. Each session will consist of 45 minutes of presentations and 45 minutes of open discussion organized around a theme. We are seeking 3 presenters and 1 chairperson for each of the 5 sessions. See the submissions page for a detailed description of each of the session topics:
    • 1a (Concurrent with 1b) – Mapping Human Activity – Qualitative Analysis GIS
    • 1b (Concurrent with 1a) – Quantitative Analysis & Technical Applications of GIS
    • 2   (Single group) – GIS in Pedagogy
    • 3a (Concurrent with 3b) – GIS in Community Outreach & Service Learning
    • 3b (Concurrent with 3a) – Software & Data Issues in GIS Instruction
  • Goals: Desired outcomes include: (1) providing mutual support for imaginative and challenging applications of spatial technology in undergraduate education; (2) fostering potential collaborative efforts between and within participant schools, such as joint research initiatives and/or shared resources for data, web maps and teaching materials, and; (3) creating a regional community of faculty and GIS/IT staff to interact on a regular basis, share information, and exchange ideas about the priorities identified during the conference.

This event is sponsored by Library & Information Technology at Bucknell University. Should you have any questions, please contact Janine Glathar at jlg046@bucknell.edu or (570) 577-1990.


Categories
Bucknell/Local Interest Digital Humanities Environment General GIS GIS in Computer Science GIS in Environmental Studies GIS in Geography GIS in Geology GIS in Public Health GIS in Sociology Slideshow

From the Yale Daily News… “Map on, Maples!”

The Yale Daily News has a great article about the role that the GIS Specialist, Stace Maples, plays on campus. Maples, a fellow ESRI T3G Institute alum from summer 2010, works with faculty and students on integrating GIS into teaching and research at Yale and…

… he is in high demand. Working in the three-person Map Department, a department within the Yale University Library, he trains students and faculty in the use of the arcane computer program. He helps professors in areas from history to public health, in such projects as diverse as mapping correspondence networks and placing photographic collections in a geological context. He is adamant that geographical data is relevant to all academic endeavors.

“Everything is somewhere, and that somewhere matters,” Maples declared.

Although I take issue with the reporter’s use of the word ‘arcane’ to describe GIS software, I’ll second Stace’s assessment that location matters (or, as the Geospatial Revolution team at Penn State put it, “the location of anything is becoming everything“).  In a statement that is sure to resonate with faculty, Peter Bol, the director of the Center for Geographic Analysis at Harvard University, is quoted in the article as saying that:

 “If you want to publish competitive research today, you have to have GIS.”

That might be a bit of an overstatement (for the moment, at least), but there’s no doubt that incorporating GIS and spatial analysis is increasingly becoming an expectation in academic research, much in the same way as it has become part of the fabric of our everyday lives.  Dana Tomlin – who is… a visiting faculty member in the Yale School of Forestry, co-director of the Cartographic Modeling Laboratory at the University of Pennsylvania, a GIS Hall of Fame-r, the creator of map algebra, and, incidentally, the grad school professor who got me hooked on GIS (thanks, Dana!), sums it up this way:

“With the advent of web mapping services like Google Earth and Bing, the ability to sense geographical position in real time via the Global Positioning System (GPS), and the opportunity to place this sort of magic quite literally into the hands of anyone with a smart phone, there is no question that the world at large is already well beyond the point of no return in terms of making routine use of geographical data in digital form.”

GIS has existed as a computing technology since the 1960’s, but until the mid to late 1990’s it was largely the domain of highly-trained specialists working from high-powered servers. GIS software and web-based map apps have become increasingly faster, more powerful and more user-friendly over the last 20 years. If those trends continue, and if we do our jobs well, Stace and I might very well work ourselves out of a job:

It is conceivable that GIS might one day become as ubiquitous within academia as Google Maps is within the broader population. If departments integrate GIS into their own teaching, the role that Maples and other specialists play is likely to diminish. Graduate students in fields employing GIS are expected to understand the program and its functionalities… Meanwhile, academics who only rarely use GIS might consult specialists if and when necessary, while remaining blissfully oblivious of the program’s nitty-gritty.

Today’s graduate students are tomorrow’s professors. And, if the trends hold true, at least a significant proportion of them will soon be using GIS technology to gain deeper insight into diverse fields of study for decades to come. So map on, Maples.

Click here to read the full story and learn more about how Yale faculty and students are using GIS to study history, archaeology, linguistics, environmental studies, forestry, public health and other topics.


Categories
Data General GIS GIS in Environmental Studies GIS in Geography GIS in Humanities GIS in Political Science GIS in Public Health GIS in Sociology Map Apps Slideshow

3 global data visualization tools to use in your class

Last fall the World Bank launched a contest aimed at challenging web developers to create web-based tools using the data available through the World Bank’s Open Data Initiative. Click here to read an article from Programmable Web about the contest winners (excerpt below).

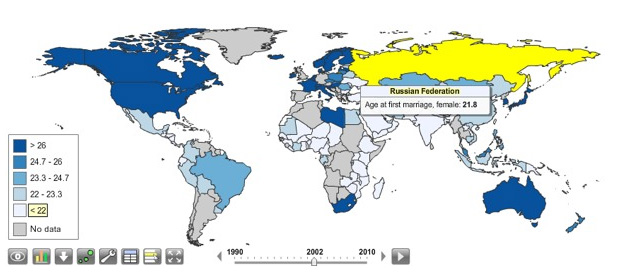
You can visualize nearly every indicator of economic, social and human development on StatPlanet World Bank, the winner of World Bank’s ambitious developer contest launched last October challenging new uses of the World Bank API. After voting from distinguished judges and the public, the organization announced the top three apps at an event in Washington, D.C., this afternoon.

StatPlanet is already a platform used by non-profits and other groups to map and visualize data. Its creator Frank van Cappelle said the application is aimed toward “evidence-based decision making.” For the World Bank contest, van Cappelle connected his platform to World Bank’s API. Where one of the challenges with World Bank’s data is how much of it there is, StatPlanet does a great job of helping users zero in on and visualize what interests them.

StatPlanet enables users to visualize global development indicators via customizeable maps and charts – and also provides a data download tool.  StatPlanet could be used in combination with WorldMapper and Gapminder – two other web-based global data visualization tools – for in-class demos and/or as a resource for student projects.  Click here to go to the StatPlanet main landing page or here to go directly to the tool.

Categories
Bucknell/Local Interest Data Environment General GIS GIS in Geography GIS in Psychology GIS in Public Health GIS in Sociology Slideshow

Williamsport and Lycoming County Asset Mapping

Guest post by Dan Ladd, Middlebury College ’14

One of the major projects the GIS team worked  on for much of the early part of the summer was mapping community assets in Williamsport and Lycoming County. This project was requested by Professors Ben Marsh (Geography) and Carl Milofsky (Sociology). Chad Lawlis (Environmental Studies ’11) and I worked on putting together the information for this project.

The project involved understanding regional community needs in public health, sustainability, social services, homelessness, etc. We explored how community needs like these match, or don’t match, the assets landscape that residents have access to. GIS gives a sophisticated way to understand this match at the scale at which people actuallyinteract with the world.

Much contemporary discourse about community development considers ‘sustainability’ to be ageneralized measure of the capacity of a community to replicate itself into the future. This broader idea of community sustainability describes residents as living in a series of ‘environments’ – a food environment and an activity environment support nutritional well-being, a housing environment affects homelessness, lead-paint risk, community activity, commuting costs and impacts, etc.

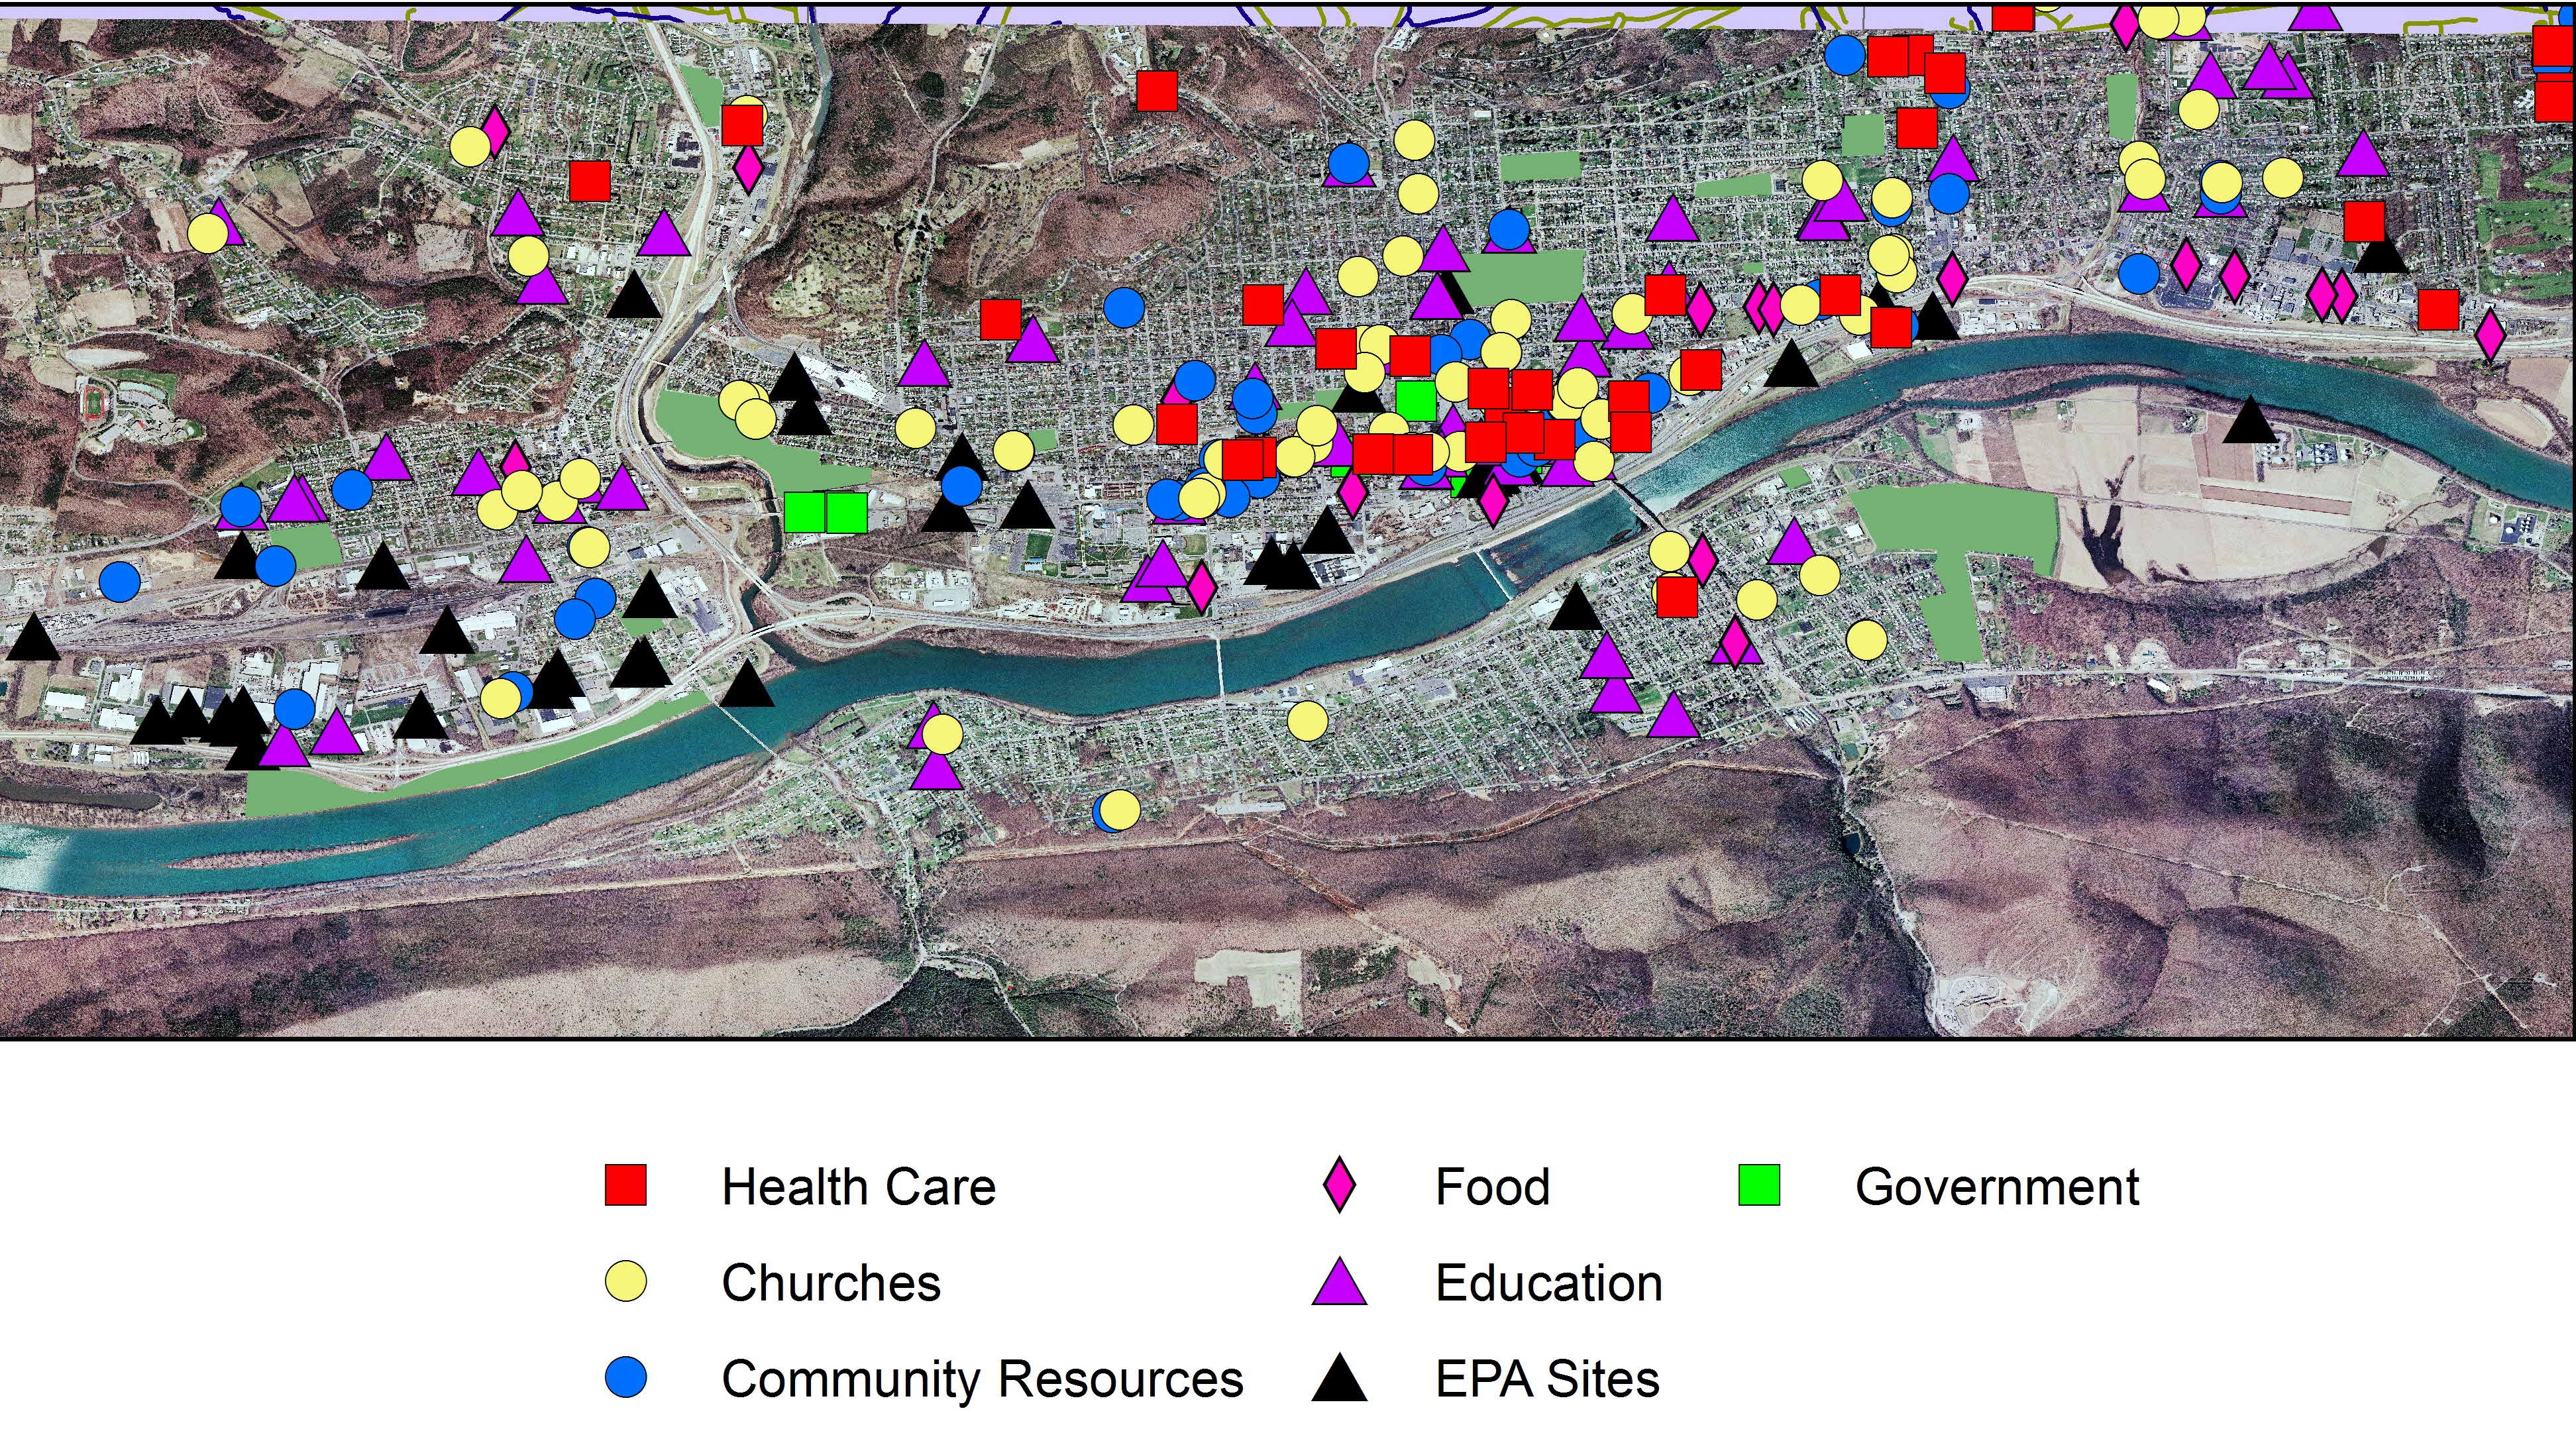
Data was collected on different Community Asset Classes (Churches, Healthcare providers, Food store, schools etc.). This information ranged from street address, contact information and a classification of what services each asset provided. These assets were then combined and mapped to give an idea of the spacial distribution of these assets.


Williamsport Community Assets

This project also serves as a template for future community asset data collection projects as the eventual goal is to expand this information to cover the Greater Central Susquehanna Valley. These proposed databases will serve as the foundation of a larger data project incorporating a ‘Community Platform’ that the university is contracting for from The Urban Institute and anascent regional ‘2-1-1’ social services phone line project.


Categories
Bucknell/Local Interest Data Digital Humanities Environment General GIS GIS in Biology GIS in Computer Science GIS in Engineering GIS in Environmental Studies GIS in Geography GIS in Geology GIS in History GIS in Humanities GIS in Psychology GIS in Sociology Map Apps Marcellus Shale Miller Run Restoration Project Slideshow

What we’re up to this summer (and why we’re not posting)

Thanks to the Mellon grant and a huge number of faculty teaching and research projects it’s been a very busy summer of GIS work at Bucknell.  Over the coming weeks I’ll write detailed posts about the work we’re doing on each of the projects.  If I’m really ambitious I might try to post some interviews with faculty and students – and some footage of the aerial drone flights that Nick Urban ’12 is doing. But for now here’s a short overview of who’s doing GIS work at Bucknell this summer and what we’re doing:

GIS Student Assistants:

  • Chad Lawlis, Environmental Studies ’11
  • Dan Dougherty, Geography/History ’12
  • Max Stiss, Geography/Anthropology ’12
  • Nick Urban, Computer Science ’12
  • Mike Grasso, Environmental Studies ’13
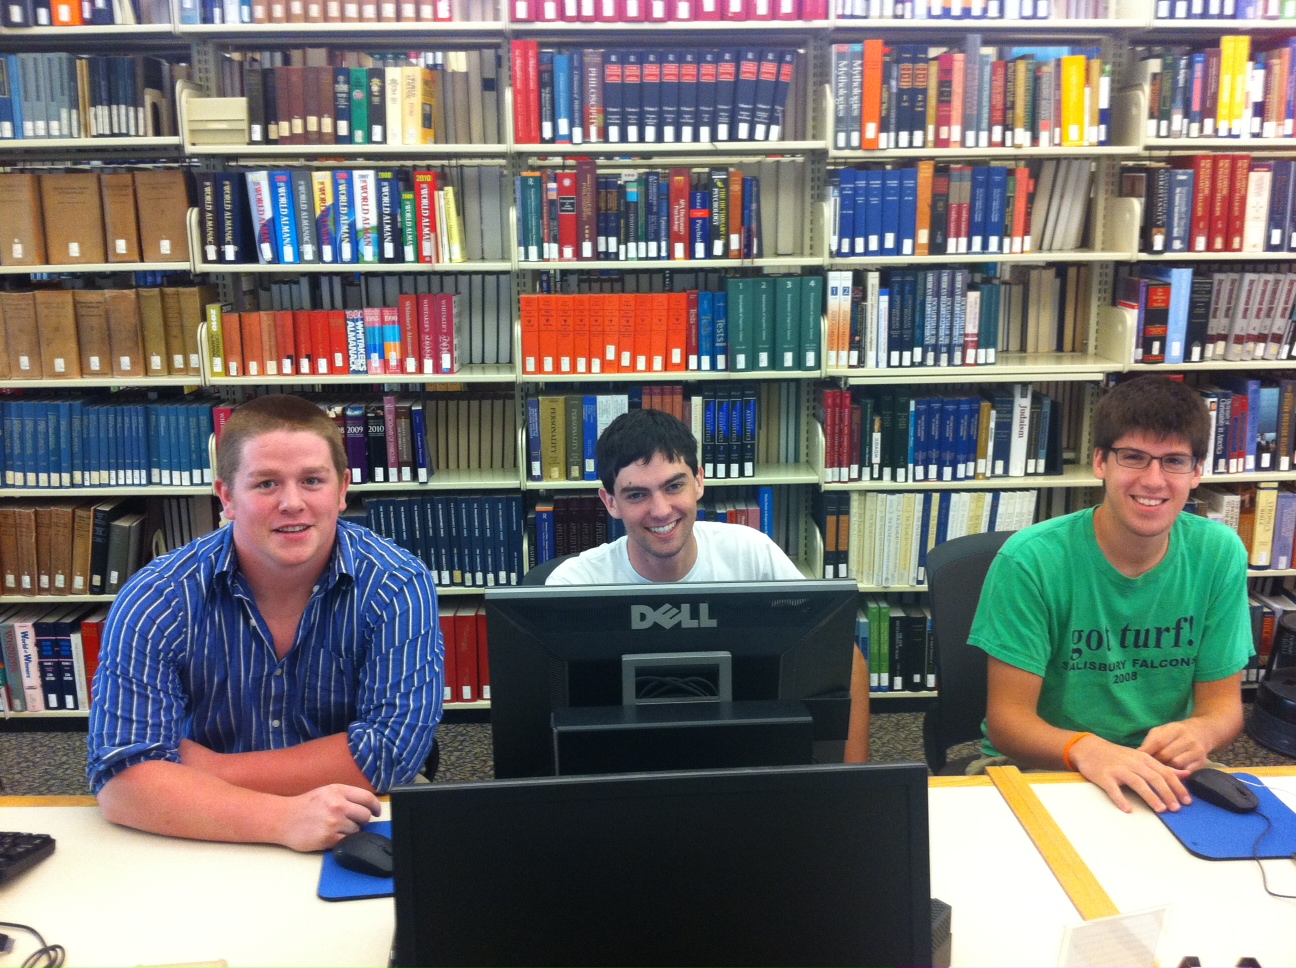
  • Robby Holler, Geography/International Relations ’13 (pictured below)
  • Darin Rockwell, Geography/Geology ’13 (pictured below)
  • Dan Ladd, Middlebury College ’14 (pictured below)

Key Projects:

  • Maps for Sudan field guide atlas to mammals
  • GPS data collection for Lewisburg Cemetary
  • GPS data collection for Miller Run restoration project
  • Aerial drone data collection for Miller Run restoration project
  • Lycoming County/Williamsport community asset mapping
  • Mapping toxic contamination from Marcellus Shale natural gas wells
  • Mapping locations of Marcellus Shale water withdrawl permits
  • Georeferencing & vectorizing 19th century economic maps of Vietnam
  • Georeferencing & vectorizing maps of environmental hazards and resources in Kyrgyzstan
  • Georeferencing & vectorizing 1868 Historic Atlas of Union & Snyder Counties
  • Data development for Stories of the Susquehanna project
  • Support for student research projects – including GPS’ing dumpster locations on campus for an analysis of campus waste and recycling, and updating Arboretum tree dataset with location info for newly planted and felled trees
  • Develop pilot web map apps for showcasing faculty research
  • Develop pilot web map apps for use in teaching
  • Implement backend IT infrastructure to support ArcGIS server
  • Maps for Bucknell admin purposes, including: analysis of parking shortages on campus; maps for task force report on campus climate; maps for SBDC report on services by county; arts festival map.