Categories
Bucknell/Local Interest Digital Humanities Environment General GIS GIS in Computer Science GIS in Environmental Studies GIS in Geography GIS in Geology GIS in Public Health GIS in Sociology Slideshow

From the Yale Daily News… “Map on, Maples!”

The Yale Daily News has a great article about the role that the GIS Specialist, Stace Maples, plays on campus. Maples, a fellow ESRI T3G Institute alum from summer 2010, works with faculty and students on integrating GIS into teaching and research at Yale and…

… he is in high demand. Working in the three-person Map Department, a department within the Yale University Library, he trains students and faculty in the use of the arcane computer program. He helps professors in areas from history to public health, in such projects as diverse as mapping correspondence networks and placing photographic collections in a geological context. He is adamant that geographical data is relevant to all academic endeavors.

“Everything is somewhere, and that somewhere matters,” Maples declared.

Although I take issue with the reporter’s use of the word ‘arcane’ to describe GIS software, I’ll second Stace’s assessment that location matters (or, as the Geospatial Revolution team at Penn State put it, “the location of anything is becoming everything“).  In a statement that is sure to resonate with faculty, Peter Bol, the director of the Center for Geographic Analysis at Harvard University, is quoted in the article as saying that:

 “If you want to publish competitive research today, you have to have GIS.”

That might be a bit of an overstatement (for the moment, at least), but there’s no doubt that incorporating GIS and spatial analysis is increasingly becoming an expectation in academic research, much in the same way as it has become part of the fabric of our everyday lives.  Dana Tomlin – who is… a visiting faculty member in the Yale School of Forestry, co-director of the Cartographic Modeling Laboratory at the University of Pennsylvania, a GIS Hall of Fame-r, the creator of map algebra, and, incidentally, the grad school professor who got me hooked on GIS (thanks, Dana!), sums it up this way:

“With the advent of web mapping services like Google Earth and Bing, the ability to sense geographical position in real time via the Global Positioning System (GPS), and the opportunity to place this sort of magic quite literally into the hands of anyone with a smart phone, there is no question that the world at large is already well beyond the point of no return in terms of making routine use of geographical data in digital form.”

GIS has existed as a computing technology since the 1960’s, but until the mid to late 1990’s it was largely the domain of highly-trained specialists working from high-powered servers. GIS software and web-based map apps have become increasingly faster, more powerful and more user-friendly over the last 20 years. If those trends continue, and if we do our jobs well, Stace and I might very well work ourselves out of a job:

It is conceivable that GIS might one day become as ubiquitous within academia as Google Maps is within the broader population. If departments integrate GIS into their own teaching, the role that Maples and other specialists play is likely to diminish. Graduate students in fields employing GIS are expected to understand the program and its functionalities… Meanwhile, academics who only rarely use GIS might consult specialists if and when necessary, while remaining blissfully oblivious of the program’s nitty-gritty.

Today’s graduate students are tomorrow’s professors. And, if the trends hold true, at least a significant proportion of them will soon be using GIS technology to gain deeper insight into diverse fields of study for decades to come. So map on, Maples.

Click here to read the full story and learn more about how Yale faculty and students are using GIS to study history, archaeology, linguistics, environmental studies, forestry, public health and other topics.
 

Categories
Bucknell/Local Interest Data Environment General GIS GIS in Computer Science GIS in Engineering GIS in Environmental Studies GIS in Geography GIS in Geology Slideshow Videos

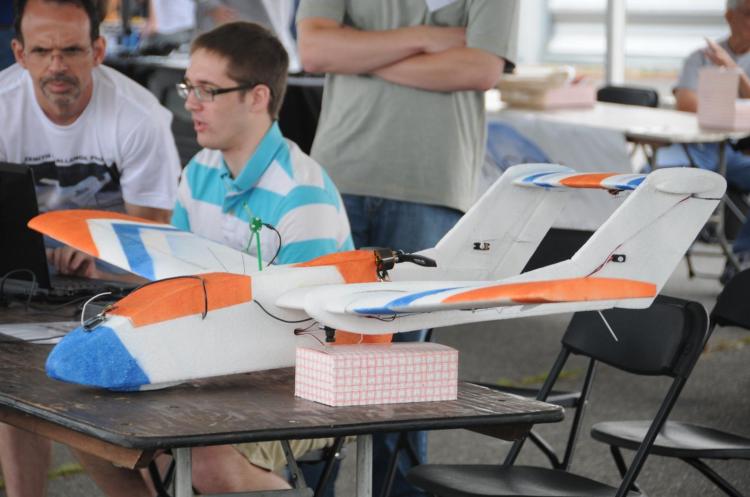
Computer science major builds aerial drone for a bird’s-eye view of local stream

Bucknell communications recently published an article on the work that Nick Urban and the other GIS student assistants did this summer for the Miller Run Restoration project.  Excerpt below – click here to read the full article.

LEWISBURG, Pa. – As the son of an aircraft mechanic, Nick Urban learned a thing or two about planes.

The rising senior at Bucknell University started out putting together model airplanes when he was a child but later became more interested in the technology that makes them work.

This summer, Urban, a computer science major from New Jersey, has combined the two interests in a research project in which he is designing, building and flying a remote-controlled aerial drone. The so-called “Flying Bison,” outfitted with video and still cameras and GIS technology, is being used to capture high-resolution images of Miller Run Creek for an ongoing restoration of the waterway that runs through Lewisburg. The data also will be used to assess how well unmanned aerial vehicles monitor environmental change.

“Pretty much all the equipment you would find on a regular plane is squeezed onto this remote-control plane,” Urban said during a recent test flight at the Bucknell University Golf Course. “It has a manual takeoff and landing, but I flip a switch on the transmitter and it will fly itself and navigate on its own.”

Categories
Bucknell/Local Interest Data Environment General GIS GIS in Engineering GIS in Environmental Studies GIS in Geography GIS in Geology Miller Run Restoration Project Slideshow

Miller Run Restoration: The Details

Guest post by Michael Grasso, Environmental Studies ’13 and Dan Ladd, Middlebury College ’14

The G.I.S. team started the Miller Run Restoration Project at Abby Lane in and around an oat field adjacent to the driving range at the Bucknell golf course. We spent the majority of the first day becoming accustomed to the equipment. Some of us took continuous topographical measurements with the mobile RTK-OPUS GPS unit and the others used the theodolite Total Station to collect coordinate and elevation data at the culverts in the area. Culverts are concrete or corrugated steel structures jutting out of the ground where drainage pipes release water. There were 5 culverts in this first area we worked on. The water these culverts expel is polluted and travels at a high velocity which unnaturally increases the flow of the stream, disturbing the ecosystem. That problem will hopefully be alleviated (if not solved) by the creation of the wetlands at the culmination of the Restoration Project.

Actually using the equipment to get measurements is fairly simple. The aspect that we spent the most time learning was setting up the equipment and getting it ready to record data. On that first day it took us 30-45 minutes to set up the Total Station, but now it takes us only 5-10 minutes. To prepare the equipment, we first set up the theodolite tripod directly over a point marked with a nail in the ground. Then, using a bubble level, we adjust the tripod to make it as level as we can. When we put the theodolite on the tripod, we can achieve a more accurate measure by using a level that’s part of the theodolite. Once the equipment is as level as possible, we look through an eyepiece located on the theodolite which has a mirror that is angled directly at the ground with a cross hair in the view. We are able adjust the theodolite to position the cross hair at the middle of the nail. We are then ready to begin syncing the equipment. This process is time consuming because when we look through the eyepiece more often than not we cannot adjust the theodolite enough to get it directly over the nail, so we have to go back to step one and reposition and re-level the tripod.

After the first day of week one at Abby lane, we began the real work. That was the week of the heat wave when temperatures were 95+ everyday, so we agreed to meet at the geology building to get the equipment at 7am (an hour earlier than we usually meet) to try to beat the heat. The rest of the week was spent collecting elevation and coordinate data. After the second day we had taken all the continuous topographic measurements we could before the farmer harvests his crops, so we focused on taking cross sections of the stream. The stream bed was almost completely dry at this point, so we had two people collecting measurements and two up ahead looking for the stream bed and pushing the vegetation out of the way so it was easier to see. Thursday and Friday of that week the part of the stream we were collecting data from was in an area of very thick vegetation that towered over us. We were given machetes and sickles to clear a path along the stream bed so we could record data. Professor Duane Griffin pointed out certain plants we should avoid hacking because they were native and would be included in the vegetation that will be added to the wetlands. A large majority of the plants we cut down were Japanese knotweed–an invasive species that chokes out most other vegetation in the area. There were at least 3 different significant stream beds in this area, so we did a lot of hacking and searching.

Once we finished taking cross sections and stream profile points at Abby Lane, we moved across the driving range to the other side of Smoketown road and began collecting data in front of the Sunflower daycare building. It was much easier to get points there because there was little vegetation and flowing water. As we moved downstream towards the mods, however, the vegetation became much thicker than it was over by Abby Lane, so we contacted facilities and asked them to clear the brush. There were large areas covered with poison ivy so the school wanted to minimize the amount of contact between us and the vegetation. After facilities cleared paths for us, and if weather permitted, we collected continuous topographic and stream profile data, and took cross sections every 2-3 meters on Miller Run right in front of the mods.We also recorded dense continuous topographic data for the area between the mods and the stream (near where the solar panels are). This is an area of interest to the Miller Run restoration committee as this is a proposed area for a possible wetland.

Currently we are waiting for the farmer to harvest so we can finish collecting data by Abby Lane. Once we finish the data we collected will be combined and merged into a Digital Elevation Model (DEM) that can be used by Geologists, Geographers, Biologists and Environmental Scientists to figure out flow models, habitat zones and decide where to place wetlands.


Categories
Bucknell/Local Interest Data Environment General GIS GIS in Computer Science GIS in Engineering GIS in Environmental Studies GIS in Geography GIS in Geology Miller Run Restoration Project Slideshow Videos

Video footage from Flying Bison test run

On July 26th, Nick Urban and the summer 2011 GIS team conducted a test flight of the Flying Bison. See video to learn more about the Miller Run Restoration Project and to see footage captured by the drone during its flight.

Thanks to Lindsay Coffee and Erin Murphy for their work on shooting & editing the video footage.

video platform video management video solutions video player

Categories
Bucknell/Local Interest Data Environment GIS in Engineering GIS in Environmental Studies GIS in Geography GIS in Geology Miller Run Restoration Project Slideshow

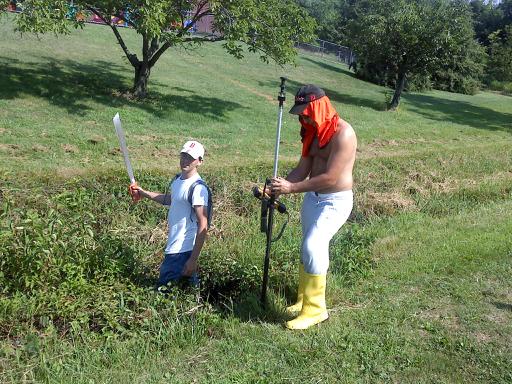
Machetes, Wellies and 100 degree heat close out week 1 of Miller Run data collection

Dan Ladd, Geography (Middlebury College) ’14 and Max Stiss, Geography/Anthropology ’12,  weilded machetes and Wellingtons in an effort to collect detailed elevation data for the Miller Run restoration project. And did I mention the 100+ degree heat? Actually, the funniest part of this photo is that it was taken directly in front of the playground at Sunflower Day Care.  Wonder how the pre-school teachers explained this scene?