Categories
Bucknell/Local Interest Digital Humanities General GIS GIS in History Slideshow

Faculty GIS Profiles: Song Chen, Assistant Professor of Chinese History

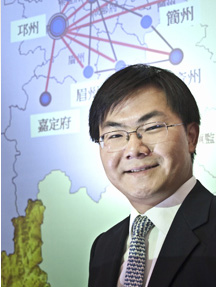
The following is a guest post by Prof. Song Chen, Assistant Professor of Chinese History, who arrived on campus in fall 2011. Click here to read the profile of Prof. Chen that was posted on the Bucknell website. In addition to his use of GIS for research purposes, Prof. Chen is planning to integrate GIS into a Spring 2013 quantitative methods course for history majors. Below is Prof. Chen’s description of how he uses GIS in his research on connections between the imperial state and local elites in 10th-13th century China:

My research combines GIS, network analysis, and prosopographical research. To understand the relationship between the imperial state and local elites in China, I use GIS to map out geographical patterns of civil servants and their marriage networks. Though my recent work relies primarily on a dataset I have personally built from a collection of several hundred funerary biographies from the 10th to the 13th century, I have also benefited significantly from other existing data collections and databases. I owe much to the China Biographical Database (CBDB) and China Historical GIS (CHGIS) projects.

CBDB is an online relational database under development but already contains about 120,000 historical figures. It contains massive geo-biographical data points, which are easily cross-queried and exported. CHGIS provides the most complete and authoritative point and polygon files for places in Chinese history. In future projects, I also plan to use GIS tools to visualize and analyze patterns of demographic settlement, economic activities, and social and intellectual interactions. I have also found G. William Skinner’s datasets on China tremendously useful.

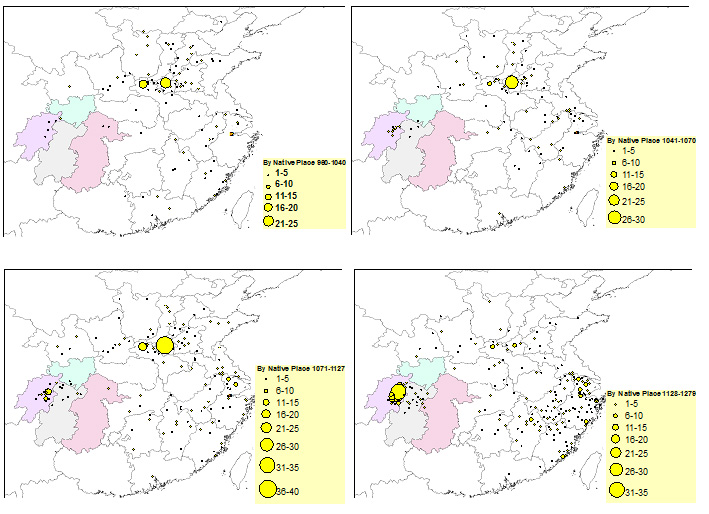
The following maps, for example, are generated by combining CBDB data and CHGIS polygon files and coordinates, with graduated symbology in ArcGIS. They show the native places of civil officials who were in the Sichuan region (the four highlighted administrative divisions) between 960 and 1279. These maps allow me to discover macrohistorical patterns of local governance during these centuries: a growing tendency of having native men staffing local offices in the Sichuan region.

Click image below for larger view.
 

Categories
Bucknell/Local Interest Events/Calendar General GIS Slideshow

Call for faculty interest in summer 2012 ‘Mapping Communities’ fellowship at University of Redlands

For the last two years, the LENS program at the University of Redlands has offered fellowships to faculty from around the country who are interested in exploring different ways to incorporate maps and spatial perspectives in their teaching and research. The fellowships include a week-long summer institute in Redlands, CA organized around a spatial theme. This year’s institute will run from June 13th-16th and is organized around the theme of ‘Mapping Communities’ (including sub-themes on history, world religion and human impacts on local environments). Lodging, registration and some meals are provided by the institute.

Please e-mail me at jlg046@bucknell.edu if you think you might be interested in applying for a LENS fellowship for summer 2012.

The website for this year’s LENS institute is not yet up, but you can click here to read about the 2010 institute and click here to read about the 2011 institute. Or read below for a more detailed description of the LENS Fellows program.

Each year, several Redlands faculty will be selected as LENS Fellows to collaborate around a unifying spatial theme or concept. Through consultations, workshops, and technical support, the Fellows will explore ways in which their teaching and research can be informed by innovative mapping ideas. At the center of this is a summer Institute, when the Fellows will be joined by colleagues from other institutions as well as domain experts who will give presentations, lead discussions, and share their insights.

During the Institute, participants will explore that year’s topic in discussions that will be both structured and open-ended. The Institute is not a “technology workshop” per se, though there will be times when we use technologies to illustrate or demonstrate a point. Instead, this Institute provides an opportunity to understand new questions and gain insights into these topics from an intellectual perspective. We will in particular explore the connections between the participants’ domain areas and the spatial or geographic questions we have about those, the capacity for existing technologies to align with those questions, and how we can help students learn through mapping to appreciate and address the questions themselves.


Categories
Bucknell/Local Interest Digital Humanities Environment General GIS GIS in Computer Science GIS in Environmental Studies GIS in Geography GIS in Geology GIS in Public Health GIS in Sociology Slideshow

From the Yale Daily News… “Map on, Maples!”

The Yale Daily News has a great article about the role that the GIS Specialist, Stace Maples, plays on campus. Maples, a fellow ESRI T3G Institute alum from summer 2010, works with faculty and students on integrating GIS into teaching and research at Yale and…

… he is in high demand. Working in the three-person Map Department, a department within the Yale University Library, he trains students and faculty in the use of the arcane computer program. He helps professors in areas from history to public health, in such projects as diverse as mapping correspondence networks and placing photographic collections in a geological context. He is adamant that geographical data is relevant to all academic endeavors.

“Everything is somewhere, and that somewhere matters,” Maples declared.

Although I take issue with the reporter’s use of the word ‘arcane’ to describe GIS software, I’ll second Stace’s assessment that location matters (or, as the Geospatial Revolution team at Penn State put it, “the location of anything is becoming everything“).  In a statement that is sure to resonate with faculty, Peter Bol, the director of the Center for Geographic Analysis at Harvard University, is quoted in the article as saying that:

 “If you want to publish competitive research today, you have to have GIS.”

That might be a bit of an overstatement (for the moment, at least), but there’s no doubt that incorporating GIS and spatial analysis is increasingly becoming an expectation in academic research, much in the same way as it has become part of the fabric of our everyday lives.  Dana Tomlin – who is… a visiting faculty member in the Yale School of Forestry, co-director of the Cartographic Modeling Laboratory at the University of Pennsylvania, a GIS Hall of Fame-r, the creator of map algebra, and, incidentally, the grad school professor who got me hooked on GIS (thanks, Dana!), sums it up this way:

“With the advent of web mapping services like Google Earth and Bing, the ability to sense geographical position in real time via the Global Positioning System (GPS), and the opportunity to place this sort of magic quite literally into the hands of anyone with a smart phone, there is no question that the world at large is already well beyond the point of no return in terms of making routine use of geographical data in digital form.”

GIS has existed as a computing technology since the 1960’s, but until the mid to late 1990’s it was largely the domain of highly-trained specialists working from high-powered servers. GIS software and web-based map apps have become increasingly faster, more powerful and more user-friendly over the last 20 years. If those trends continue, and if we do our jobs well, Stace and I might very well work ourselves out of a job:

It is conceivable that GIS might one day become as ubiquitous within academia as Google Maps is within the broader population. If departments integrate GIS into their own teaching, the role that Maples and other specialists play is likely to diminish. Graduate students in fields employing GIS are expected to understand the program and its functionalities… Meanwhile, academics who only rarely use GIS might consult specialists if and when necessary, while remaining blissfully oblivious of the program’s nitty-gritty.

Today’s graduate students are tomorrow’s professors. And, if the trends hold true, at least a significant proportion of them will soon be using GIS technology to gain deeper insight into diverse fields of study for decades to come. So map on, Maples.

Click here to read the full story and learn more about how Yale faculty and students are using GIS to study history, archaeology, linguistics, environmental studies, forestry, public health and other topics.


Categories
Digital Humanities General GIS GIS in History Slideshow

Using G.I.S. to Visualize Historical Landscapes

Guest post by Michael Grasso, Environmental Studes 13′

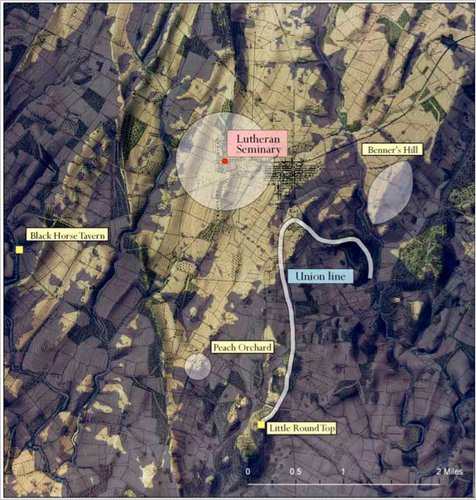
Geographic Information Systems can be used recreate a landscape that no longer exists. Historians can use this technology to help explain confusing, or even previously unexplainable, events that took place in the past. For example, General Robert E. Lee issued a series of orders (Pickett’s Charge) that directly caused the Confederates to lose the battle of Gettysburg and inevitably the Civil War. If anyone stood today where General Lee stood that fateful day they would be able to clearly see the fortified, superior Union force waiting for the charge – and wonder why Gen. Lee made the decision that he did. However, the landscape has dramatically changed in the 150 years since the Civil War.  Using historical maps and other documentation, geographers and historian were able to re-create the landscape that General Lee saw and to determine that – from his position 150 years ago -one could not see the eastern end of the battle field where Union forces were amassing.

This is a link to an article explaining how G.I.S. was used to answer questions be recreating historical landscapes such as the Battle of Gettysburg, the 1930s dust bowl, and the Salem Witchcraft Trials.