Categories
Bucknell/Local Interest GIS Jobs, Internships, Scholarships & Grad Programs Slideshow

GIS Job Opportunities

Congratulations to rising senior and GIS Student Assistant Darin Rockwell, Geography/Geology ’13, for landing a very competitive GIS internship for summer 2012 with Lockheed Martin. Currently ranked #58 on the Fortune 500 listLockheed Martin is a

global security and aerospace company that employs about 123,000 people worldwide and is principally engaged in the research, design, development, manufacture, integration and sustainment of advanced technology systems, products and services. 

GIS is integrated across Lockheed Martin’s operations and the company recently joined the ESRI Partner Network in order to 

collaborate [with ESRI] on technologies to put online geospatial apps and services in the hands of more military, intelligence, homeland security and emergency response users worldwide…  Lockheed Martin and Esri have previously worked together on several geospatial-intelligence programs for the U.S. Government and international customers. The companies will continue to collaborate on future geospatial opportunities for global customers, with a focus on enterprise GIS solutions that connect desktop and mobile users across a range of devices with a secure worldwide network.

Hopefully at some point this summer we’ll be able to get a guest blog post from Darin about his internship (assuming of course he’s allowed to talk about it!).
Categories
Bucknell/Local Interest General GIS GIS Jobs, Internships, Scholarships & Grad Programs Slideshow

GIS Job Opportunities – ESRI

If you are a second semester senior looking for a full-time job or a returning student considering summer internship options, check out the links below from the ESRI newsletter for students and recent graduates.If you don’t already know, ESRI is more or less the Microsoft of the GIS world. Having an ESRI job or internship on your resume will open a lot of doors for you in the GIS world. Having worked at ESRI’s Philadelphia regional office for a number of years I can tell you from first hand experience that ESRI is an incredibly exciting, challenging and rewarding place to work (whether you are at the mothership in Redlands or any one of the many regional offices).

Read through the info below and/or set up an appointment to talk with me about GIS job options.

 Students looking for an opportunity to earn while they learn are invited to check out Esri’s summer programs.

  • The Internship Program provides students with personal and professional development skills as they are mentored by staff from all disciplines. We will have more than 60 interns this summer, primarily in software and product development, professional services, and support, but interns are placed throughout the company. Check your major and see where you might fit, and then learn what former interns have to say in this video or on the Esri Careers blog.
  • Participants in the Student Assistantship Program attend the Esri International User Conference, the ultimate event for anyone working with GIS. In exchange for helping out during the conference, students attend sessions and network with others who share their passion for GIS. Watch a video of former assistants.

Attend an Esri Conference Free

  • We are seeking student volunteers to help out at the annual Esri Federal GIS Conference, February 22 – 24, 2012, in Washington, D.C. If selected, you will attend this event for free in exchange for volunteering a day or more of your time. Some of the duties include greeting attendees, working registration, and monitoring sessions. View details [PDF].

Meet Esri Staff at AAG

  • If you’re planning on attending the Association of American Geographers (AAG) annual meeting in New York, New York, February 24 – 28, 2012, make time to stop by the Esri booth to meet staff from our software development and industry solutions teams. See a demo of our latest software and learn what it’s like to be part of the Esri team. We’ll also have a booth in the Jobs in Geography Center.

Career Opportunities for New Grads

  • Graduating soon? There’s no better way to start your career than with a world-leading software development company. Esri offers a number of opportunities for new grads such as programmers, product engineers, support analysts, test engineers, and geospatial analysts.
  • Qualifications for these positions vary, but in general, we are seeking graduates with degrees in GIS, geography, computer science, computer engineering, or related fields. Learn where you might fit at Esri, and then search our current openings.
Categories
Bucknell/Local Interest Data General GIS Slideshow

Coming soon to your ArcMap session – a GIANT JACKPOT OF DATA

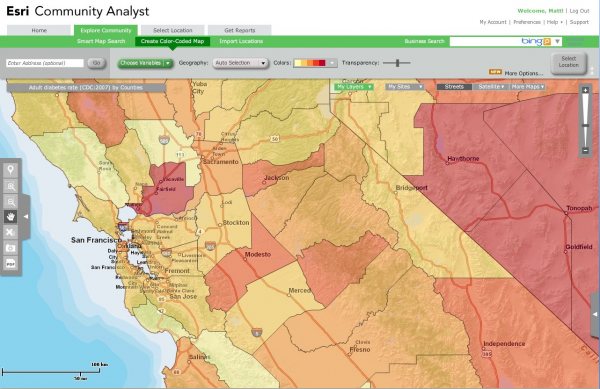
ESRI just added Business Analyst and Community Analyst to  Bucknell’s site license. What that means for you is that you will soon have access to several thousand ‘ready-to-map’ data variables – all within ArcMap.  You’ll also be able to use tools from the Business Analyst extension to do site selection, customer profiling, market penetration and other types of business analysis. But really, the exciting part here is the GIANT JACKPOT OF DATA.  Check out the lists below to get an idea of the types of variables that you will be able to add to ArcMap with just the click of a mouse.

I’m working on getting these datasets pushed out to the labs and faculty computers as soon as possible. Stay tuned for more details.

 Business Analyst Datasets:

Demographic Data

Current-year updates and five-year projections of Esri’s Updated Demographics use more than 1,600 variables about employee population, population by occupation/industry, disposable income, and consumer expenditures all at the United States, state, county, ZIP Code, census tract, block group, core-based statistical area, and designated market area geography levels.

Segmentation Data

Esri’s Tapestry Segmentation classifies U.S. neighborhoods into 65 segments based on their socioeconomic and demographic compositions. The market segmentation data is available at the census tract level and above.

Consumer Spending

Annually updated data details which products and services consumers buy. Approximately 90 variables in 15 categories such as apparel, food, and financial are included.

Business Data

A national database of approximately 12 million U.S. businesses from Infogroup to identify customers and competitors, business data is arranged by business name, industry description or SIC/North American Industry Classification System, sales, employees, and location.

Major Shopping Centers

The national database from the Directory of Major Malls, Inc., lists detailed information for more than 4,200 major shopping centers, malls, and lifestyle/specialty centers in the United States. Major shopping centers’ variables include center name, gross leasable area, type of center, total retail sales, distance to the nearest competing center, name of and distance to the nearest major city, and total number of stores.

Street Data

Tele Atlas’ high-quality, nationwide street and geocoding databases provide routing attributes and attractive map displays as a single street database source. Business Analyst Desktop includes Esri’s geocoder that integrates an address-based approach with more than 54 million residential and commercial U.S. structure addresses from the Tele Atlas Address Points database. This database maps street addresses to a physical location, so each address is a fixed point and not an interpolation from an address range.


Community Analyst Datasets:

Bing Facility and Business Search
Infogroup Facility and Business Search
Mapping of Crime Data
Behavior and Preferences Reports
Electronics and Internet Market Potential
Financial Investments Market Potential
Health and Beauty Market Potential
Pets and Products Market Potential
Restaurant Market Potential
Retail Market Potential
Sports and Leisure Market Potential
Demographic Reports
1990–2000 Comparison Profile
Age 50+ Profile
Age by Income Profile
Age by Sex by Race Profile
Age by Sex Profile
American Community Survey (ACS) Housing Summary
American Community Survey (ACS) Population Summary
Census 2010 Geography Profile
Census 2000 Detailed Race Profile
Census 2000 Summary Profile
Community Profile
Demographic and Income Comparison Profile
Demographic and Income Profile
Detailed Age Profile
Detailed Income Profile
Demographic Reports (continued)
Disposable Income Profile
Executive Summary
Graphic Profile
Housing Profile
Net Worth Profile
Quarterly Demographic Profile
Neighborhood Type Reports
Dominant TapestryTM
Tapestry Segmentation Area Profile
Spending Reports
Automotive Aftermarket Expenditures
Financial Expenditures
House and Home Expenditures
Household Budget Expenditures
Medical Expenditures
Recreation Expenditures
Retail Goods and Services Expenditures
Economic Activity Reports
Business Locator
Business Summary
Major Shopping Center Locator
Major Shopping Center Map
Retail MarketPlace Profile
Maps and Aerial Imagery
Site Details Map
Site Map
Site Map with Satellite Imagery
Traffic Maps and Reports
Traffic Count Profile
Traffic Count Profile Map
Color-Coded Maps and Smart Map Search
AGS CrimeRisk Data
Behavior and Preferences Data
Consumer Spending Data
Demographic Data
Economic Activity/Business Data
Neighborhood Type/Tapestry Data
Public Data (USDA, EPA, CDC, and more)
Categories
Bucknell/Local Interest Digital Humanities Environment General GIS GIS in Computer Science GIS in Environmental Studies GIS in Geography GIS in Geology GIS in Public Health GIS in Sociology Slideshow

From the Yale Daily News… “Map on, Maples!”

The Yale Daily News has a great article about the role that the GIS Specialist, Stace Maples, plays on campus. Maples, a fellow ESRI T3G Institute alum from summer 2010, works with faculty and students on integrating GIS into teaching and research at Yale and…

… he is in high demand. Working in the three-person Map Department, a department within the Yale University Library, he trains students and faculty in the use of the arcane computer program. He helps professors in areas from history to public health, in such projects as diverse as mapping correspondence networks and placing photographic collections in a geological context. He is adamant that geographical data is relevant to all academic endeavors.

“Everything is somewhere, and that somewhere matters,” Maples declared.

Although I take issue with the reporter’s use of the word ‘arcane’ to describe GIS software, I’ll second Stace’s assessment that location matters (or, as the Geospatial Revolution team at Penn State put it, “the location of anything is becoming everything“).  In a statement that is sure to resonate with faculty, Peter Bol, the director of the Center for Geographic Analysis at Harvard University, is quoted in the article as saying that:

 “If you want to publish competitive research today, you have to have GIS.”

That might be a bit of an overstatement (for the moment, at least), but there’s no doubt that incorporating GIS and spatial analysis is increasingly becoming an expectation in academic research, much in the same way as it has become part of the fabric of our everyday lives.  Dana Tomlin – who is… a visiting faculty member in the Yale School of Forestry, co-director of the Cartographic Modeling Laboratory at the University of Pennsylvania, a GIS Hall of Fame-r, the creator of map algebra, and, incidentally, the grad school professor who got me hooked on GIS (thanks, Dana!), sums it up this way:

“With the advent of web mapping services like Google Earth and Bing, the ability to sense geographical position in real time via the Global Positioning System (GPS), and the opportunity to place this sort of magic quite literally into the hands of anyone with a smart phone, there is no question that the world at large is already well beyond the point of no return in terms of making routine use of geographical data in digital form.”

GIS has existed as a computing technology since the 1960’s, but until the mid to late 1990’s it was largely the domain of highly-trained specialists working from high-powered servers. GIS software and web-based map apps have become increasingly faster, more powerful and more user-friendly over the last 20 years. If those trends continue, and if we do our jobs well, Stace and I might very well work ourselves out of a job:

It is conceivable that GIS might one day become as ubiquitous within academia as Google Maps is within the broader population. If departments integrate GIS into their own teaching, the role that Maples and other specialists play is likely to diminish. Graduate students in fields employing GIS are expected to understand the program and its functionalities… Meanwhile, academics who only rarely use GIS might consult specialists if and when necessary, while remaining blissfully oblivious of the program’s nitty-gritty.

Today’s graduate students are tomorrow’s professors. And, if the trends hold true, at least a significant proportion of them will soon be using GIS technology to gain deeper insight into diverse fields of study for decades to come. So map on, Maples.

Click here to read the full story and learn more about how Yale faculty and students are using GIS to study history, archaeology, linguistics, environmental studies, forestry, public health and other topics.


Categories
Bucknell/Local Interest General GIS GIS in Geography Slideshow Videos

More web tools for helping students understand scale

In previous posts here, here and here I’ve mentioned different resources that can be useful in helping students understand scale.  Joseph Kerski, ESRI’s Education Curriculum Development Manager, recently posted to one of the GIS in higher ed listserves about some new web-based tools for teaching students about scale.

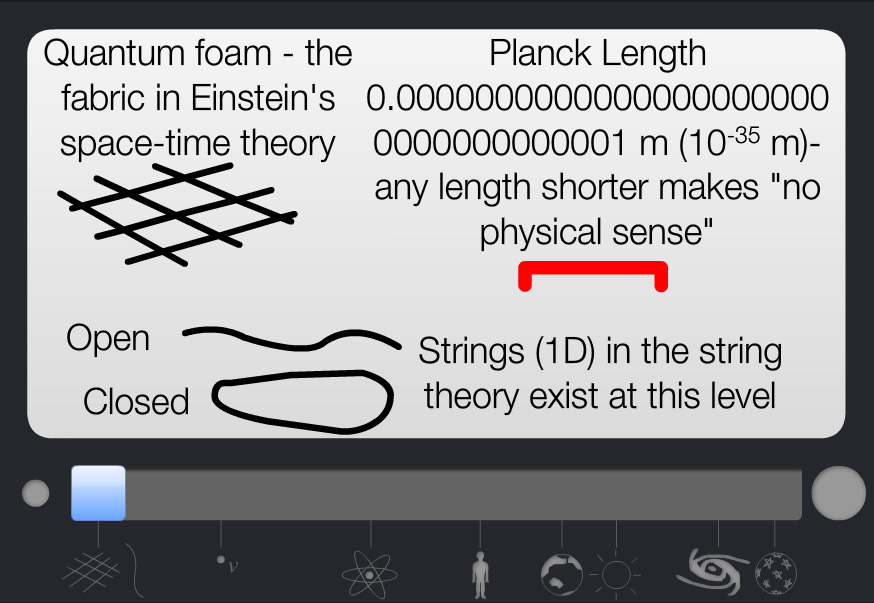
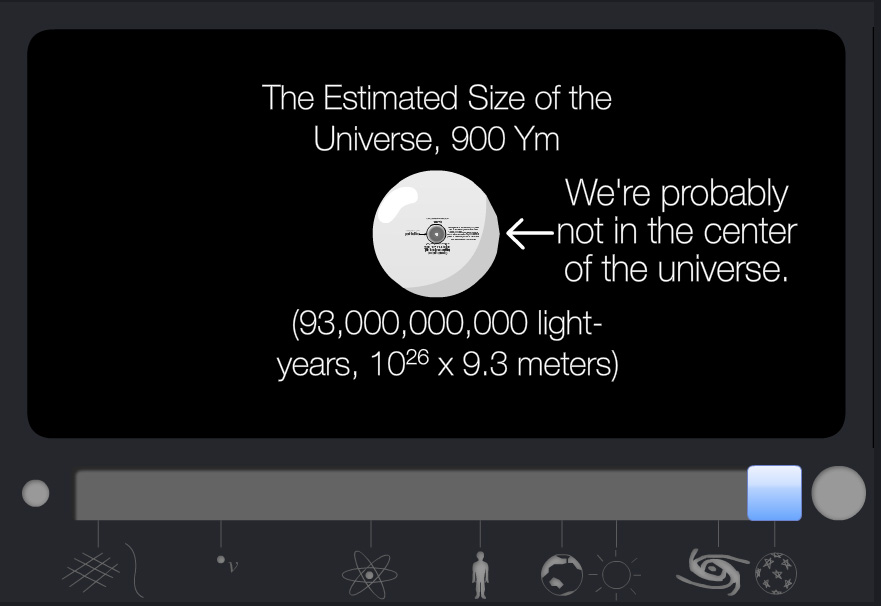
One of the websites, Scale of the Universe (created by Primaxstudio.com), features an interactive graphic that enables users to toggle a slider bar to zoom out from quantum to galactic scales while viewing where a variety of objects and measurements (quarks, bacteria, ostrich eggs, Redwood Trees, Marathon distance, planets, a light year)  fall along that spectrum.

Min                                                                                                   Mid

Max

Max

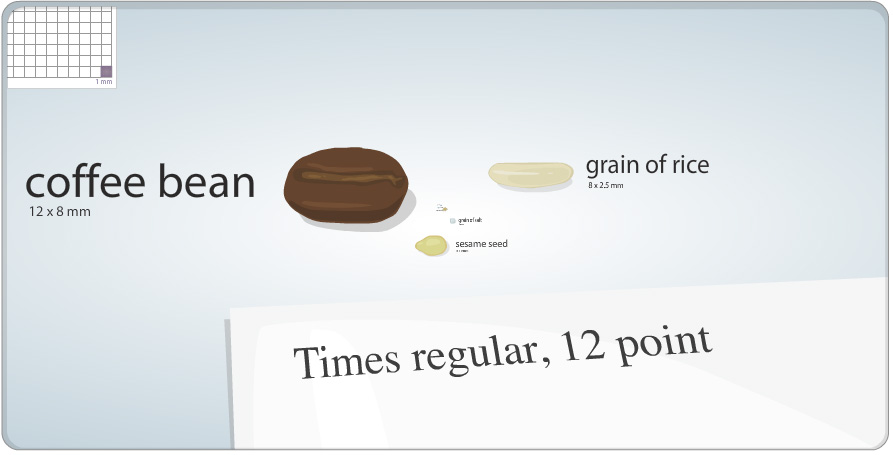
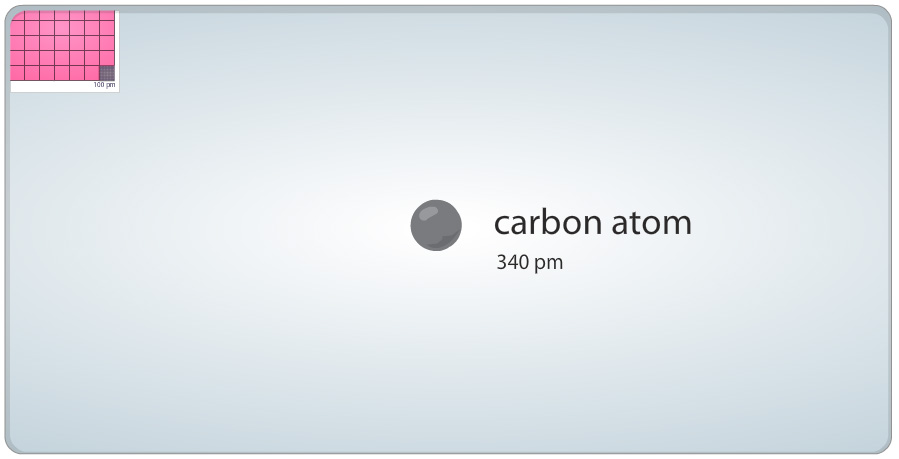
The other site, Cell Size and Scale (from the Genetics Science Learning Center at the University of Utah), uses the same slider bar device but starts with a 1 square millimeter cell size, a coffee bean and 12 pt Times font and then zooms in – passing an X chromosome, Baker’s yeast, hemoglobin and glucose on the way – until it eventually reaches the size of a carbon atom.


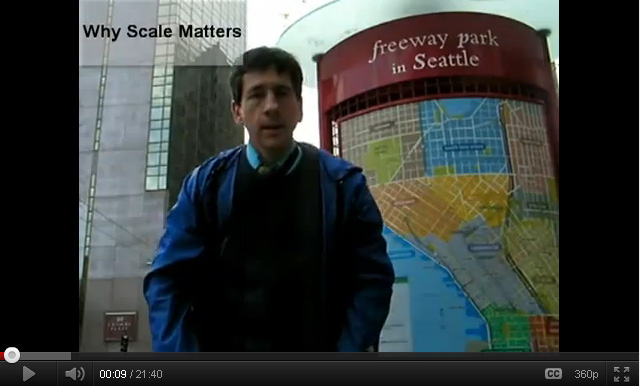
Joseph also shared a link to a movie he created, entitled “Why Scale Matters,” that illustrates concepts related to scale in geography:

httpv://youtu.be/blF0fXMCFZU