Categories
Bucknell/Local Interest Digital Humanities Environment General GIS GIS in Environmental Studies Marcellus Shale Slideshow

GIS in the Classroom (and dorms): Environmental Residential College

In fall 2011, Professors Steve Jordan and Chris Daniels assigned a semester-long documentary project to students in Bucknell’s Environmental Residential College. The goal was to create video essays to tell the story of how the Marcellus Shale gas boom is impacting communities in northeastern Pennsylvania. Students visited communities impacted by the gas boom to conduct interviews and capture video footage that would help them tell the story of the local contexts in which the gas boom is taking place across the state.

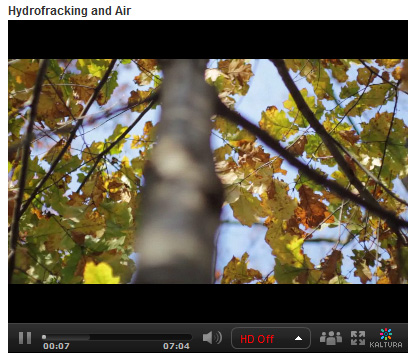
In addition to other research methods, the teams of students used GIS to explore the spatial footprint of the gas boom on different communities. Students were tasked with integrating the spatial aspect of the story into their video essays. The clip below is taken from the ‘Hydrofracking & Air’ video created by students Zoe Gaston, Claire Rapp, Sarah Baker, Thuyvan Luu, Colin Lind and Kyle Montgomery – all first-year students in Bucknell’s Environmental Residential College.

video platform video management video solutions video player

To create the map animation seen in the video, the students worked with me to visualize GIS data in ArcMap and export the data to a GoogleEarth KML format. Next, the students used GoogleEarth to draw the estimated pathway of the pipeline connecting several air compressor stations in their area of interest. Then the students created an animation in GoogleEarth that was spliced into the video essay to illustrate the point they were trying to make about air pollution associated with natural gas infrastructure. By the way… in a few months Bucknell GIS expects to have data on all infrastructure related to natural gas and electricity generation in Pennsylvania – including pipelines and transmission lines (so that next time we’ll be able to be more precise than we were with the ‘connect the dot’ approach we employed in this video).

Click here to see the full-length ‘Hydrofracking & Air’ video and other videos submitted by students in the class.


Categories
Data Digital Humanities General GIS GIS in History Slideshow

Free, GIS-ready historic maps from New York Public Library

Here’s another treasure trove of data that’s ready and waiting to be added to your ArcMap session.

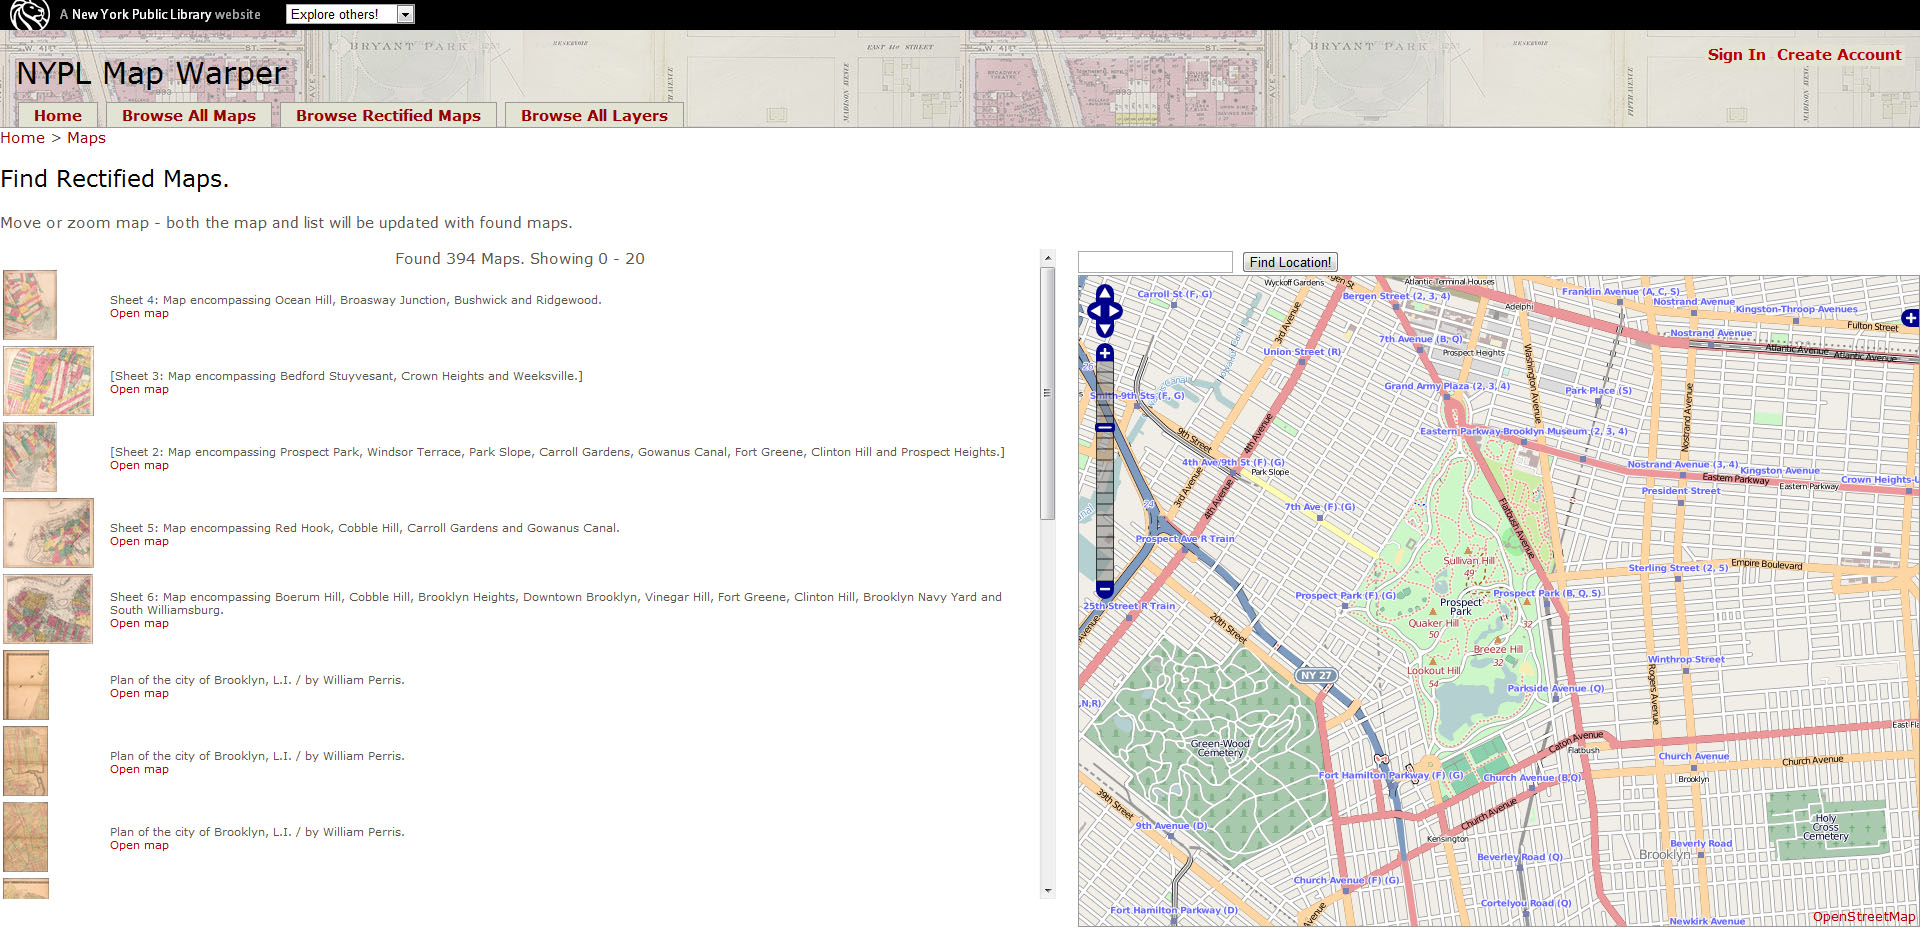
Over the last several years the New York Public Library has scanned more than 10,000 public domain historic maps and atlases of New York City and made digital copies of those maps available via its website. Recently NYPL took this project to the next level by creating a web tool that can be used (by NYPL staff as well as volunteers from the general public) to georeference the maps – i.e. pin the historic maps down to their location on a modern-day reference map.  Click here to check out their blog post about the project. Or click here to check out the do-it-yourself MapWarper tool and/or browse through the thousands of maps that have already been georectified.

What’s the big deal about being able to look at historic maps in GIS? Here’s an excerpt from the NYPL blog post on the project that does a great job of explaining how GIS can shed new light on old maps.

So, what does this all mean? If we have documents related to past times and past places (old maps), then we can create data to “rebuild” those past times and past places. And if we “rebuild” old places in virtual space, we can then organize a universe of other information around those old places. Wouldn’t it be great to haveyelp.com and menupages.com, but for old restaurants and with old menus and prices? Or to have at least a smattering of old photos in a historical street view? Or to search the National Newspaper Digitization Project using a map interface? At the core of all of these dream-like research futures is geographic information, in machine-readable format. And to get there, we need to warp, crop, mosaic, and trace our old maps. That’s why we’re doing what we’re doing. And as a positive byproduct, the maps just so happen to become more useful at each step along the way.

Using the NYPL website to find GIS-ready historic maps is incredibly easy. I used the ‘search by map’ option to zoom into Prospect Park in Brooklyn to find georectified historic maps that I could download and add straight to my ArcMap session. A whopping 394 maps were returned in the results – i.e. 394 maps that I could download as a KMZ file and add directly to ArcMap to explore how this small chunk of turf grew, changed and evolved through time to become the place that it is now.


If you find maps in the NYPL collection that have the historic places or events that you are interested in, but are not yet GIS-ready, you can use the MapWarper tool to georeference them yourself. Here’s a link to instructions for using the MapWarper – along with a YouTube video that describes the process.

httpv://youtu.be/G8ms_eBU8MQ


Categories
Bucknell/Local Interest Data General GIS Slideshow

Coming soon to your ArcMap session – a GIANT JACKPOT OF DATA

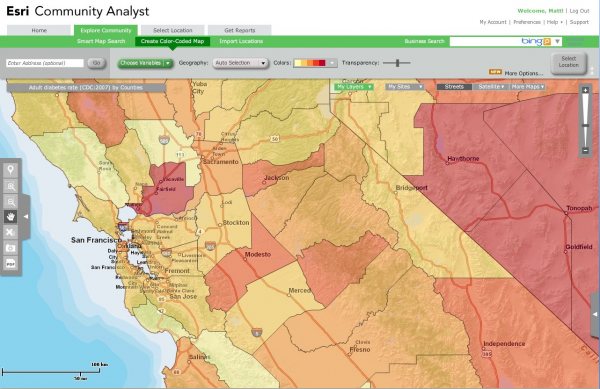
ESRI just added Business Analyst and Community Analyst to  Bucknell’s site license. What that means for you is that you will soon have access to several thousand ‘ready-to-map’ data variables – all within ArcMap.  You’ll also be able to use tools from the Business Analyst extension to do site selection, customer profiling, market penetration and other types of business analysis. But really, the exciting part here is the GIANT JACKPOT OF DATA.  Check out the lists below to get an idea of the types of variables that you will be able to add to ArcMap with just the click of a mouse.

I’m working on getting these datasets pushed out to the labs and faculty computers as soon as possible. Stay tuned for more details.

 Business Analyst Datasets:

Demographic Data

Current-year updates and five-year projections of Esri’s Updated Demographics use more than 1,600 variables about employee population, population by occupation/industry, disposable income, and consumer expenditures all at the United States, state, county, ZIP Code, census tract, block group, core-based statistical area, and designated market area geography levels.

Segmentation Data

Esri’s Tapestry Segmentation classifies U.S. neighborhoods into 65 segments based on their socioeconomic and demographic compositions. The market segmentation data is available at the census tract level and above.

Consumer Spending

Annually updated data details which products and services consumers buy. Approximately 90 variables in 15 categories such as apparel, food, and financial are included.

Business Data

A national database of approximately 12 million U.S. businesses from Infogroup to identify customers and competitors, business data is arranged by business name, industry description or SIC/North American Industry Classification System, sales, employees, and location.

Major Shopping Centers

The national database from the Directory of Major Malls, Inc., lists detailed information for more than 4,200 major shopping centers, malls, and lifestyle/specialty centers in the United States. Major shopping centers’ variables include center name, gross leasable area, type of center, total retail sales, distance to the nearest competing center, name of and distance to the nearest major city, and total number of stores.

Street Data

Tele Atlas’ high-quality, nationwide street and geocoding databases provide routing attributes and attractive map displays as a single street database source. Business Analyst Desktop includes Esri’s geocoder that integrates an address-based approach with more than 54 million residential and commercial U.S. structure addresses from the Tele Atlas Address Points database. This database maps street addresses to a physical location, so each address is a fixed point and not an interpolation from an address range.


Community Analyst Datasets:

Bing Facility and Business Search
Infogroup Facility and Business Search
Mapping of Crime Data
Behavior and Preferences Reports
Electronics and Internet Market Potential
Financial Investments Market Potential
Health and Beauty Market Potential
Pets and Products Market Potential
Restaurant Market Potential
Retail Market Potential
Sports and Leisure Market Potential
Demographic Reports
1990–2000 Comparison Profile
Age 50+ Profile
Age by Income Profile
Age by Sex by Race Profile
Age by Sex Profile
American Community Survey (ACS) Housing Summary
American Community Survey (ACS) Population Summary
Census 2010 Geography Profile
Census 2000 Detailed Race Profile
Census 2000 Summary Profile
Community Profile
Demographic and Income Comparison Profile
Demographic and Income Profile
Detailed Age Profile
Detailed Income Profile
Demographic Reports (continued)
Disposable Income Profile
Executive Summary
Graphic Profile
Housing Profile
Net Worth Profile
Quarterly Demographic Profile
Neighborhood Type Reports
Dominant TapestryTM
Tapestry Segmentation Area Profile
Spending Reports
Automotive Aftermarket Expenditures
Financial Expenditures
House and Home Expenditures
Household Budget Expenditures
Medical Expenditures
Recreation Expenditures
Retail Goods and Services Expenditures
Economic Activity Reports
Business Locator
Business Summary
Major Shopping Center Locator
Major Shopping Center Map
Retail MarketPlace Profile
Maps and Aerial Imagery
Site Details Map
Site Map
Site Map with Satellite Imagery
Traffic Maps and Reports
Traffic Count Profile
Traffic Count Profile Map
Color-Coded Maps and Smart Map Search
AGS CrimeRisk Data
Behavior and Preferences Data
Consumer Spending Data
Demographic Data
Economic Activity/Business Data
Neighborhood Type/Tapestry Data
Public Data (USDA, EPA, CDC, and more)