Categories
Bucknell/Local Interest Digital Humanities Environment General GIS GIS in Environmental Studies Marcellus Shale Slideshow

GIS in the Classroom (and dorms): Environmental Residential College

In fall 2011, Professors Steve Jordan and Chris Daniels assigned a semester-long documentary project to students in Bucknell’s Environmental Residential College. The goal was to create video essays to tell the story of how the Marcellus Shale gas boom is impacting communities in northeastern Pennsylvania. Students visited communities impacted by the gas boom to conduct interviews and capture video footage that would help them tell the story of the local contexts in which the gas boom is taking place across the state.

In addition to other research methods, the teams of students used GIS to explore the spatial footprint of the gas boom on different communities. Students were tasked with integrating the spatial aspect of the story into their video essays. The clip below is taken from the ‘Hydrofracking & Air’ video created by students Zoe Gaston, Claire Rapp, Sarah Baker, Thuyvan Luu, Colin Lind and Kyle Montgomery – all first-year students in Bucknell’s Environmental Residential College.

video platform video management video solutions video player

To create the map animation seen in the video, the students worked with me to visualize GIS data in ArcMap and export the data to a GoogleEarth KML format. Next, the students used GoogleEarth to draw the estimated pathway of the pipeline connecting several air compressor stations in their area of interest. Then the students created an animation in GoogleEarth that was spliced into the video essay to illustrate the point they were trying to make about air pollution associated with natural gas infrastructure. By the way… in a few months Bucknell GIS expects to have data on all infrastructure related to natural gas and electricity generation in Pennsylvania – including pipelines and transmission lines (so that next time we’ll be able to be more precise than we were with the ‘connect the dot’ approach we employed in this video).

Click here to see the full-length ‘Hydrofracking & Air’ video and other videos submitted by students in the class.
 

Categories
Bucknell/Local Interest Environment General GIS GIS in Geology Marcellus Shale Slideshow

Mapping Marcellus Shale Flowback Water Chemistry

Guest post by Darin Rockwell, Geography/Geology ’13

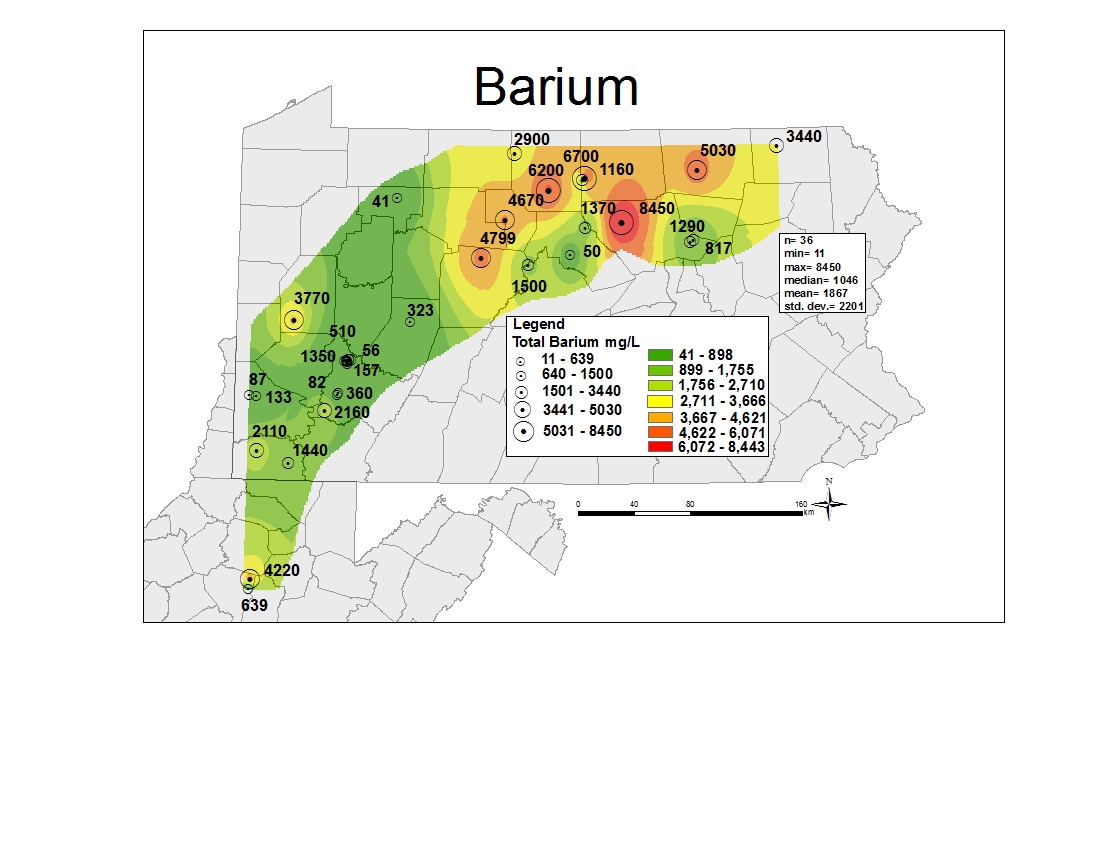
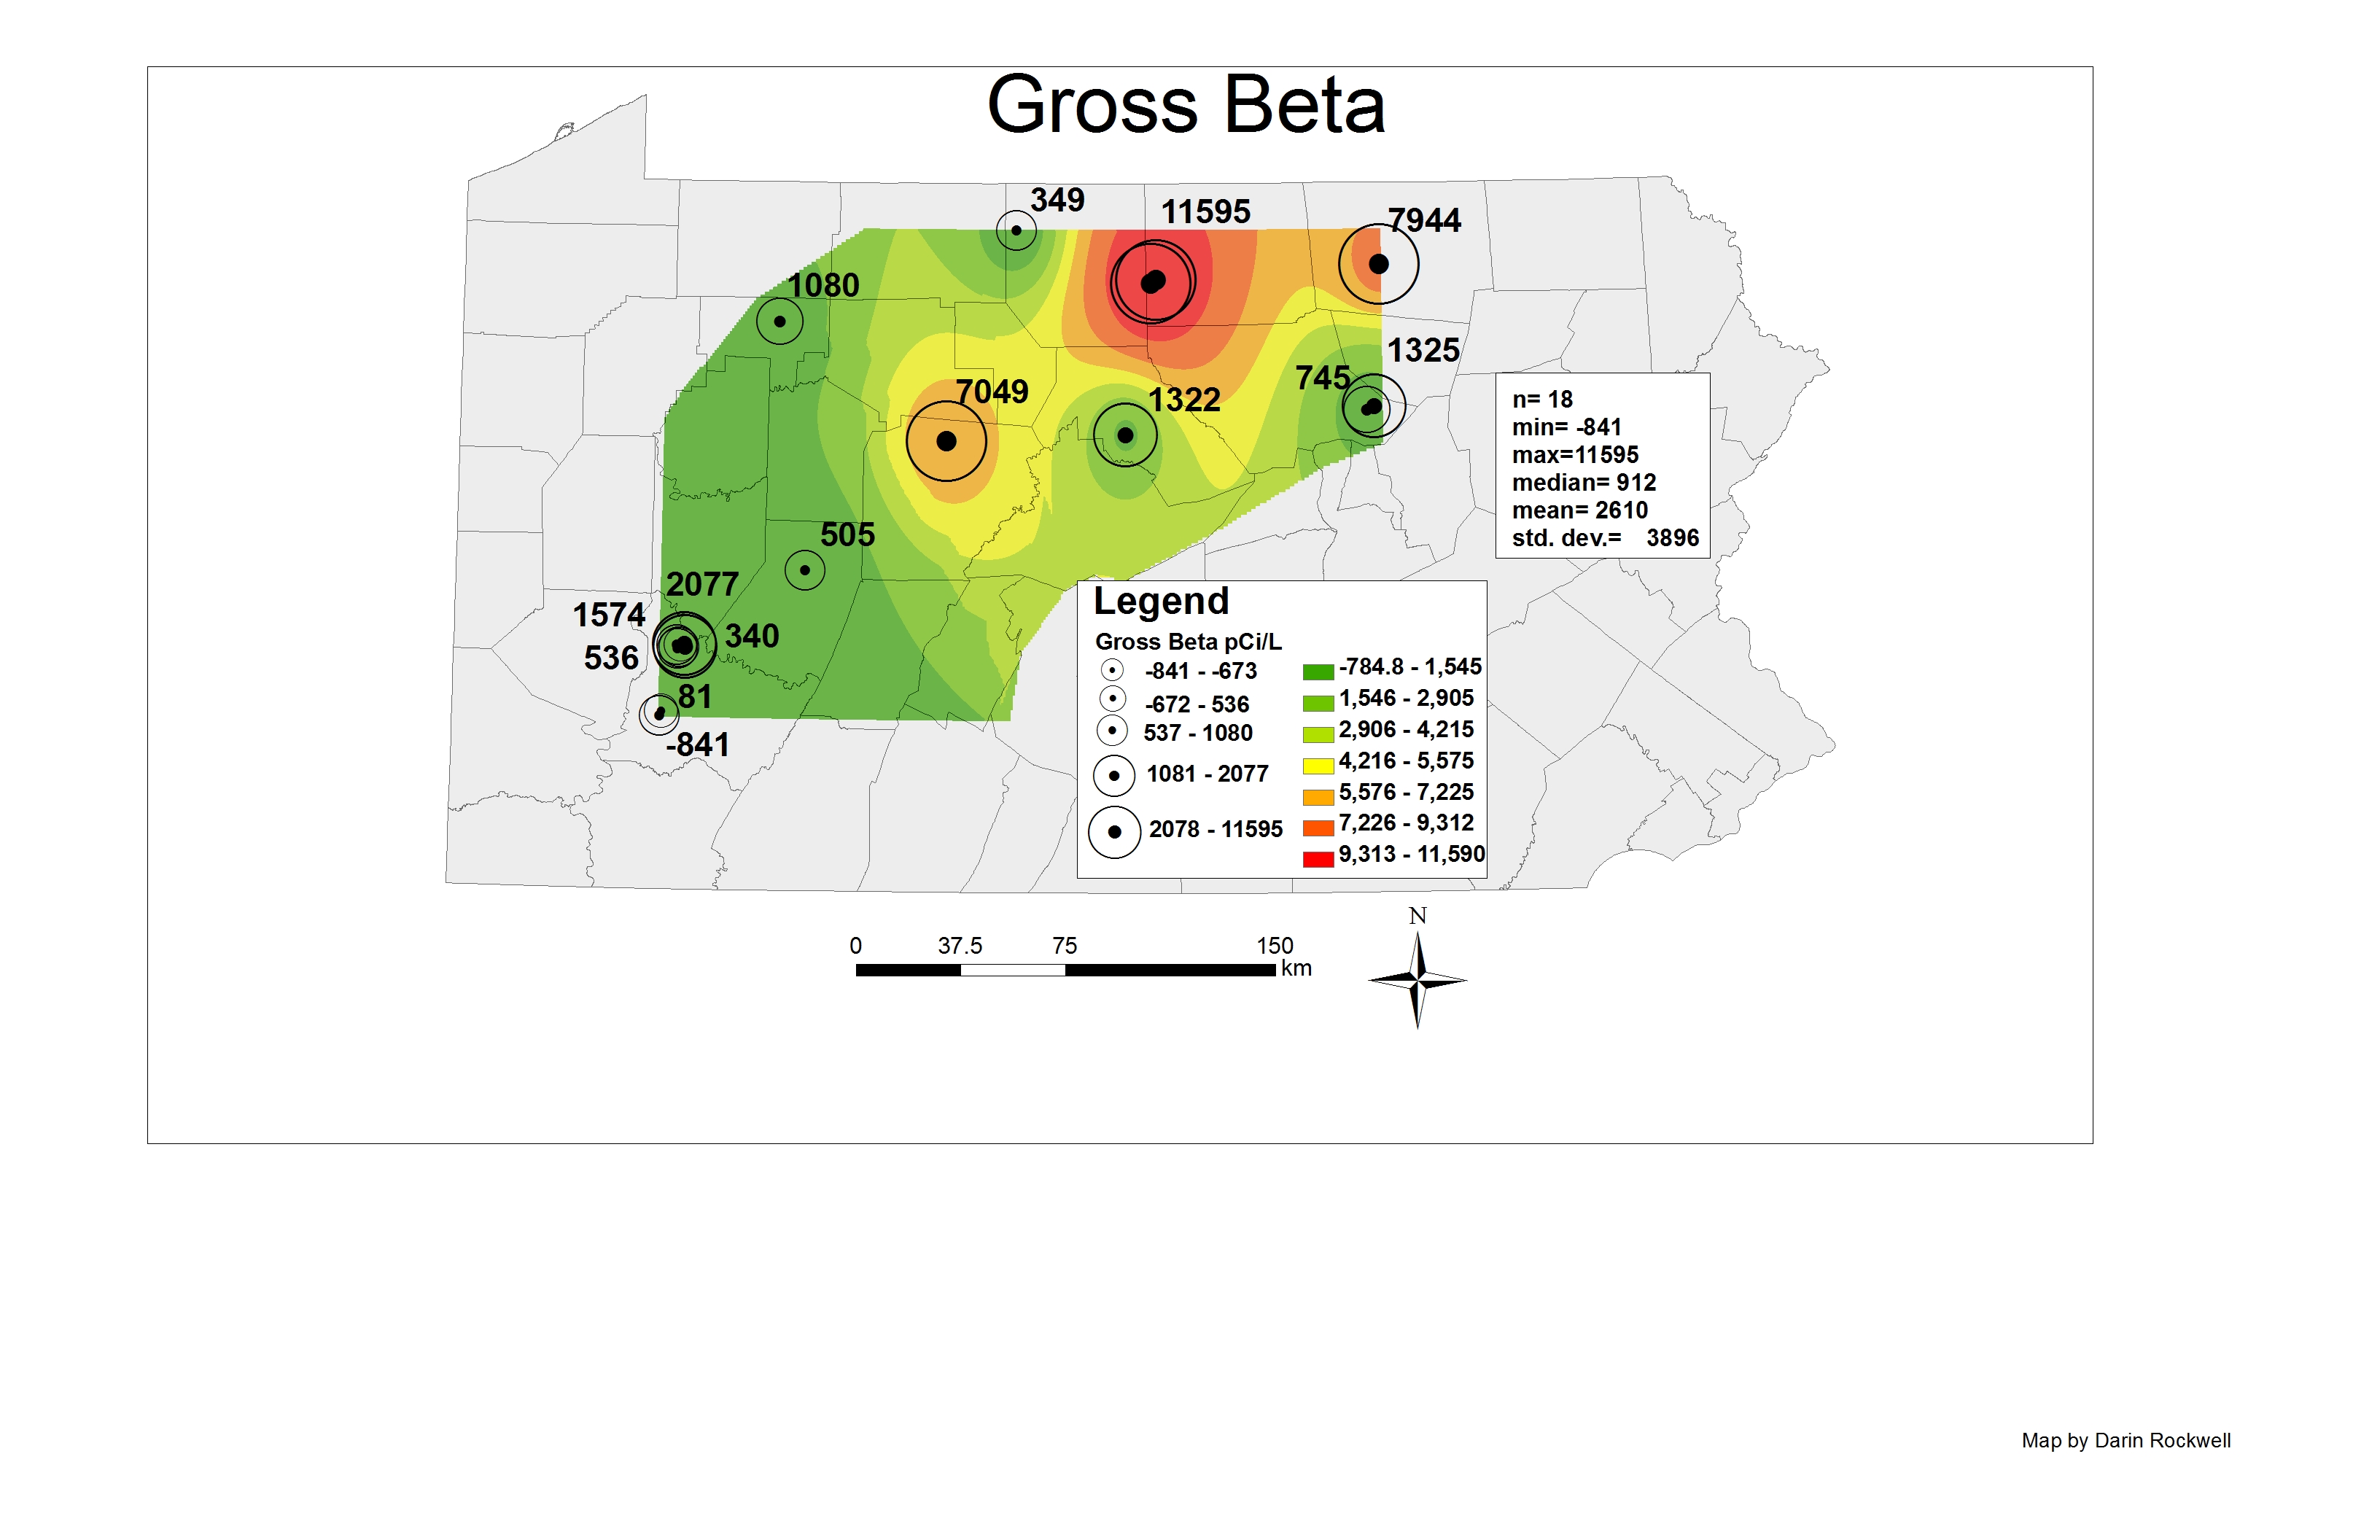
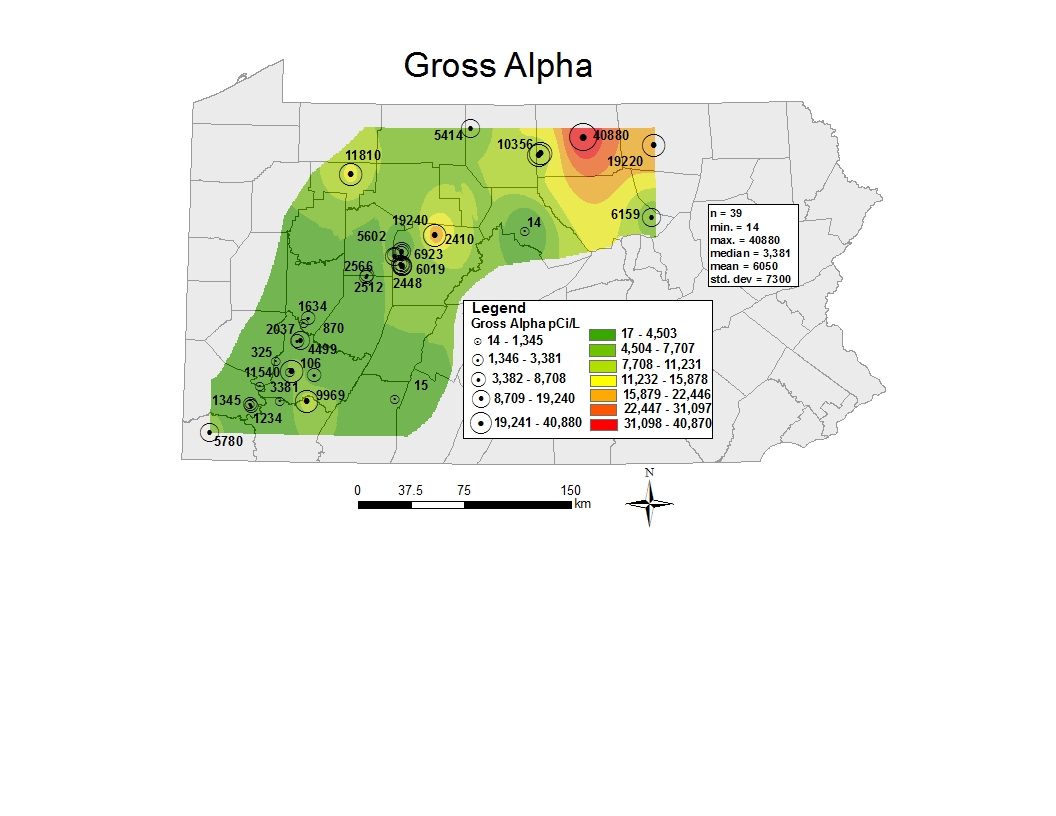
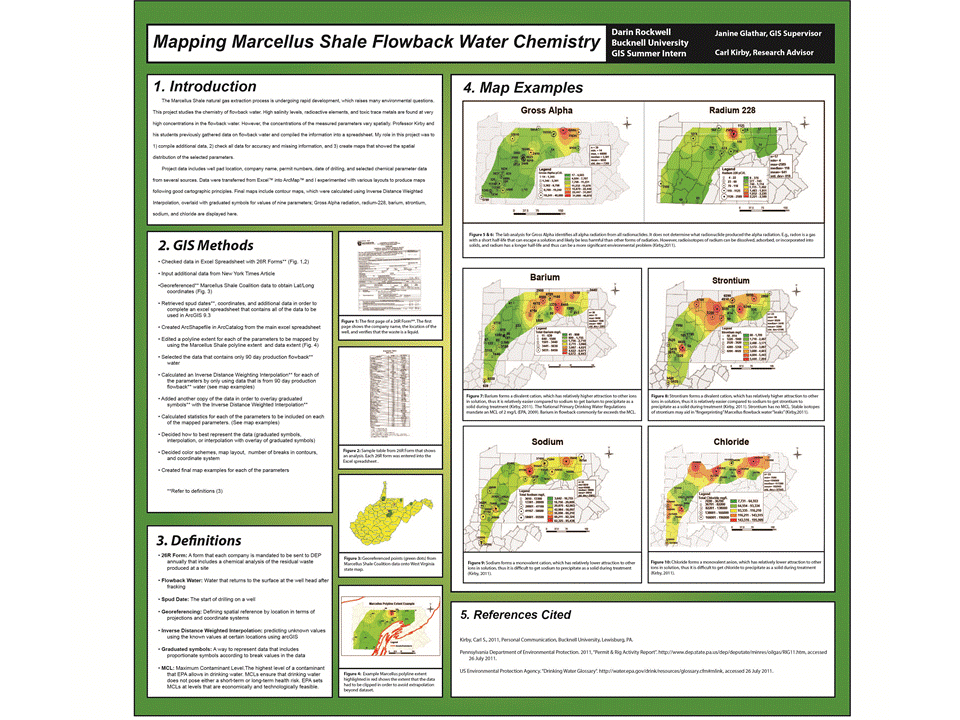
The Marcellus Shale natural gas extraction process is undergoing rapid development, which raises many environmental questions. This project studies the chemistry of flowback water[1]. High salinity levels, radioactive elements, and toxic trace metals are   found at very high concentrations in the flowback water. However, the concentrations of the measured parameters vary spatially. Professor Kirby and his students previously gathered data on flowback water and compiled the information into a spreadsheet.


My role in this project was to:

  1) compile additional data

  2) check all data for accuracy and missing information

  3) create maps that showed the spatial distribution of the selected parameters.


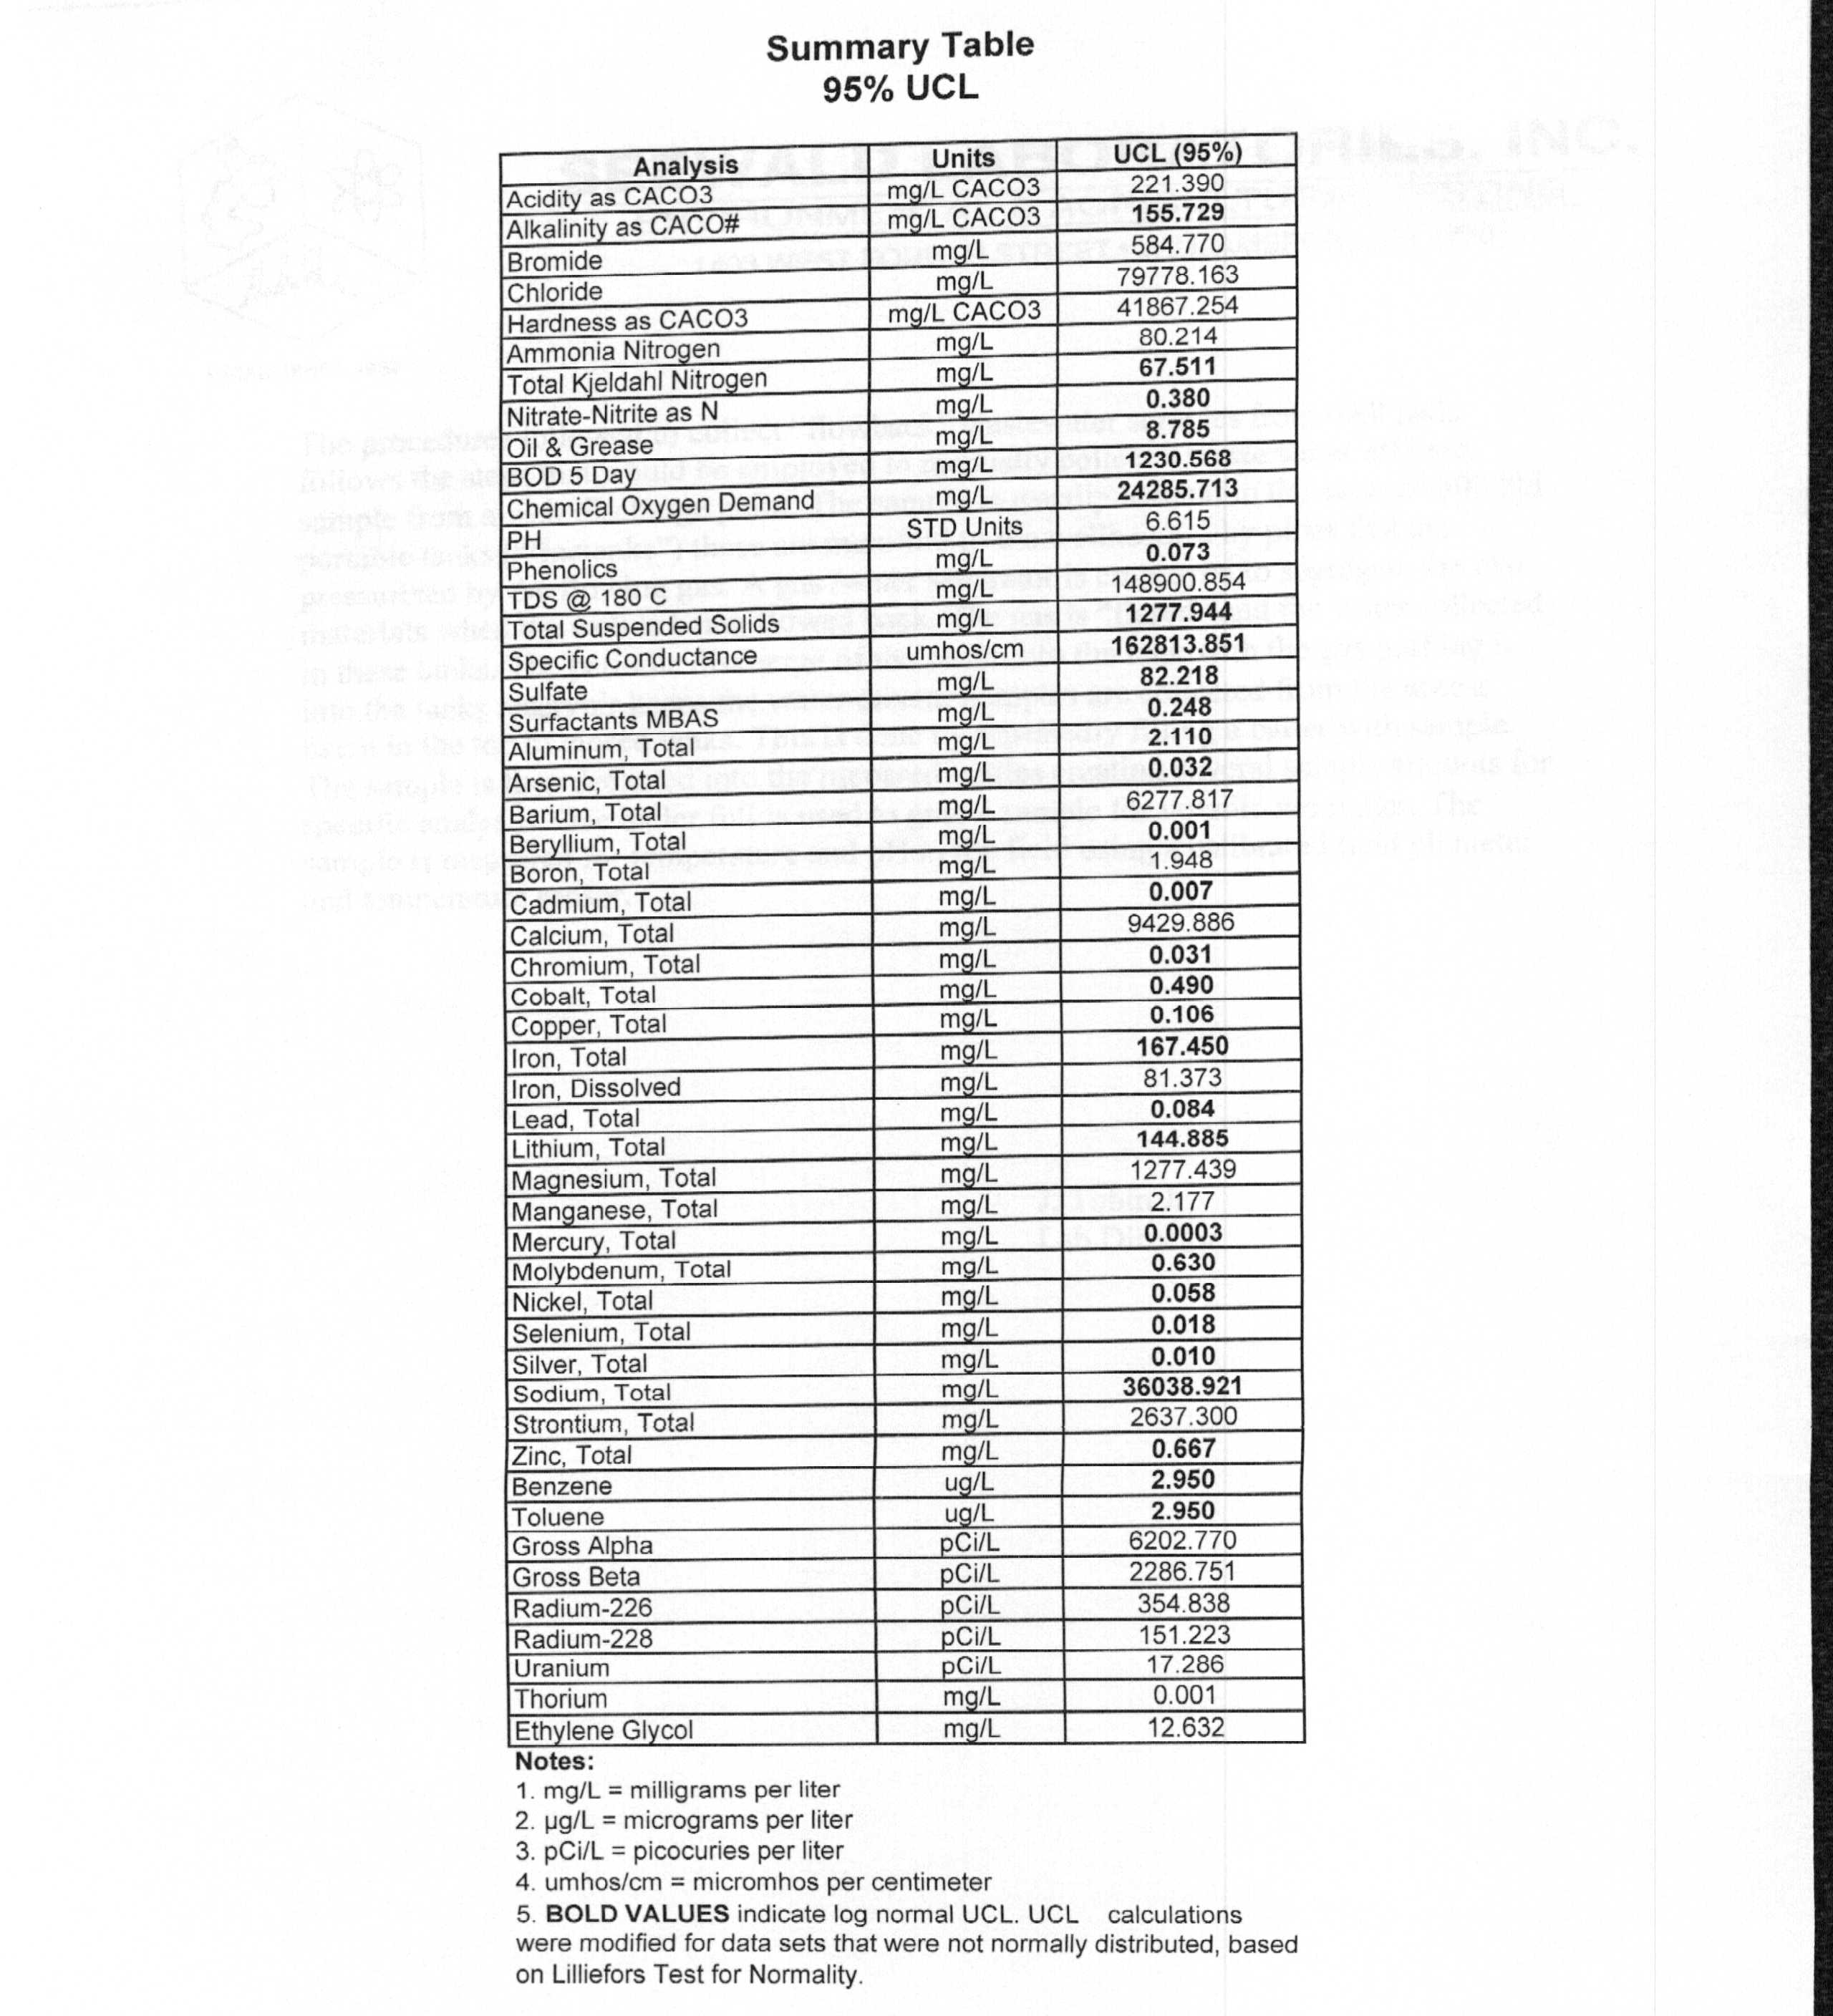
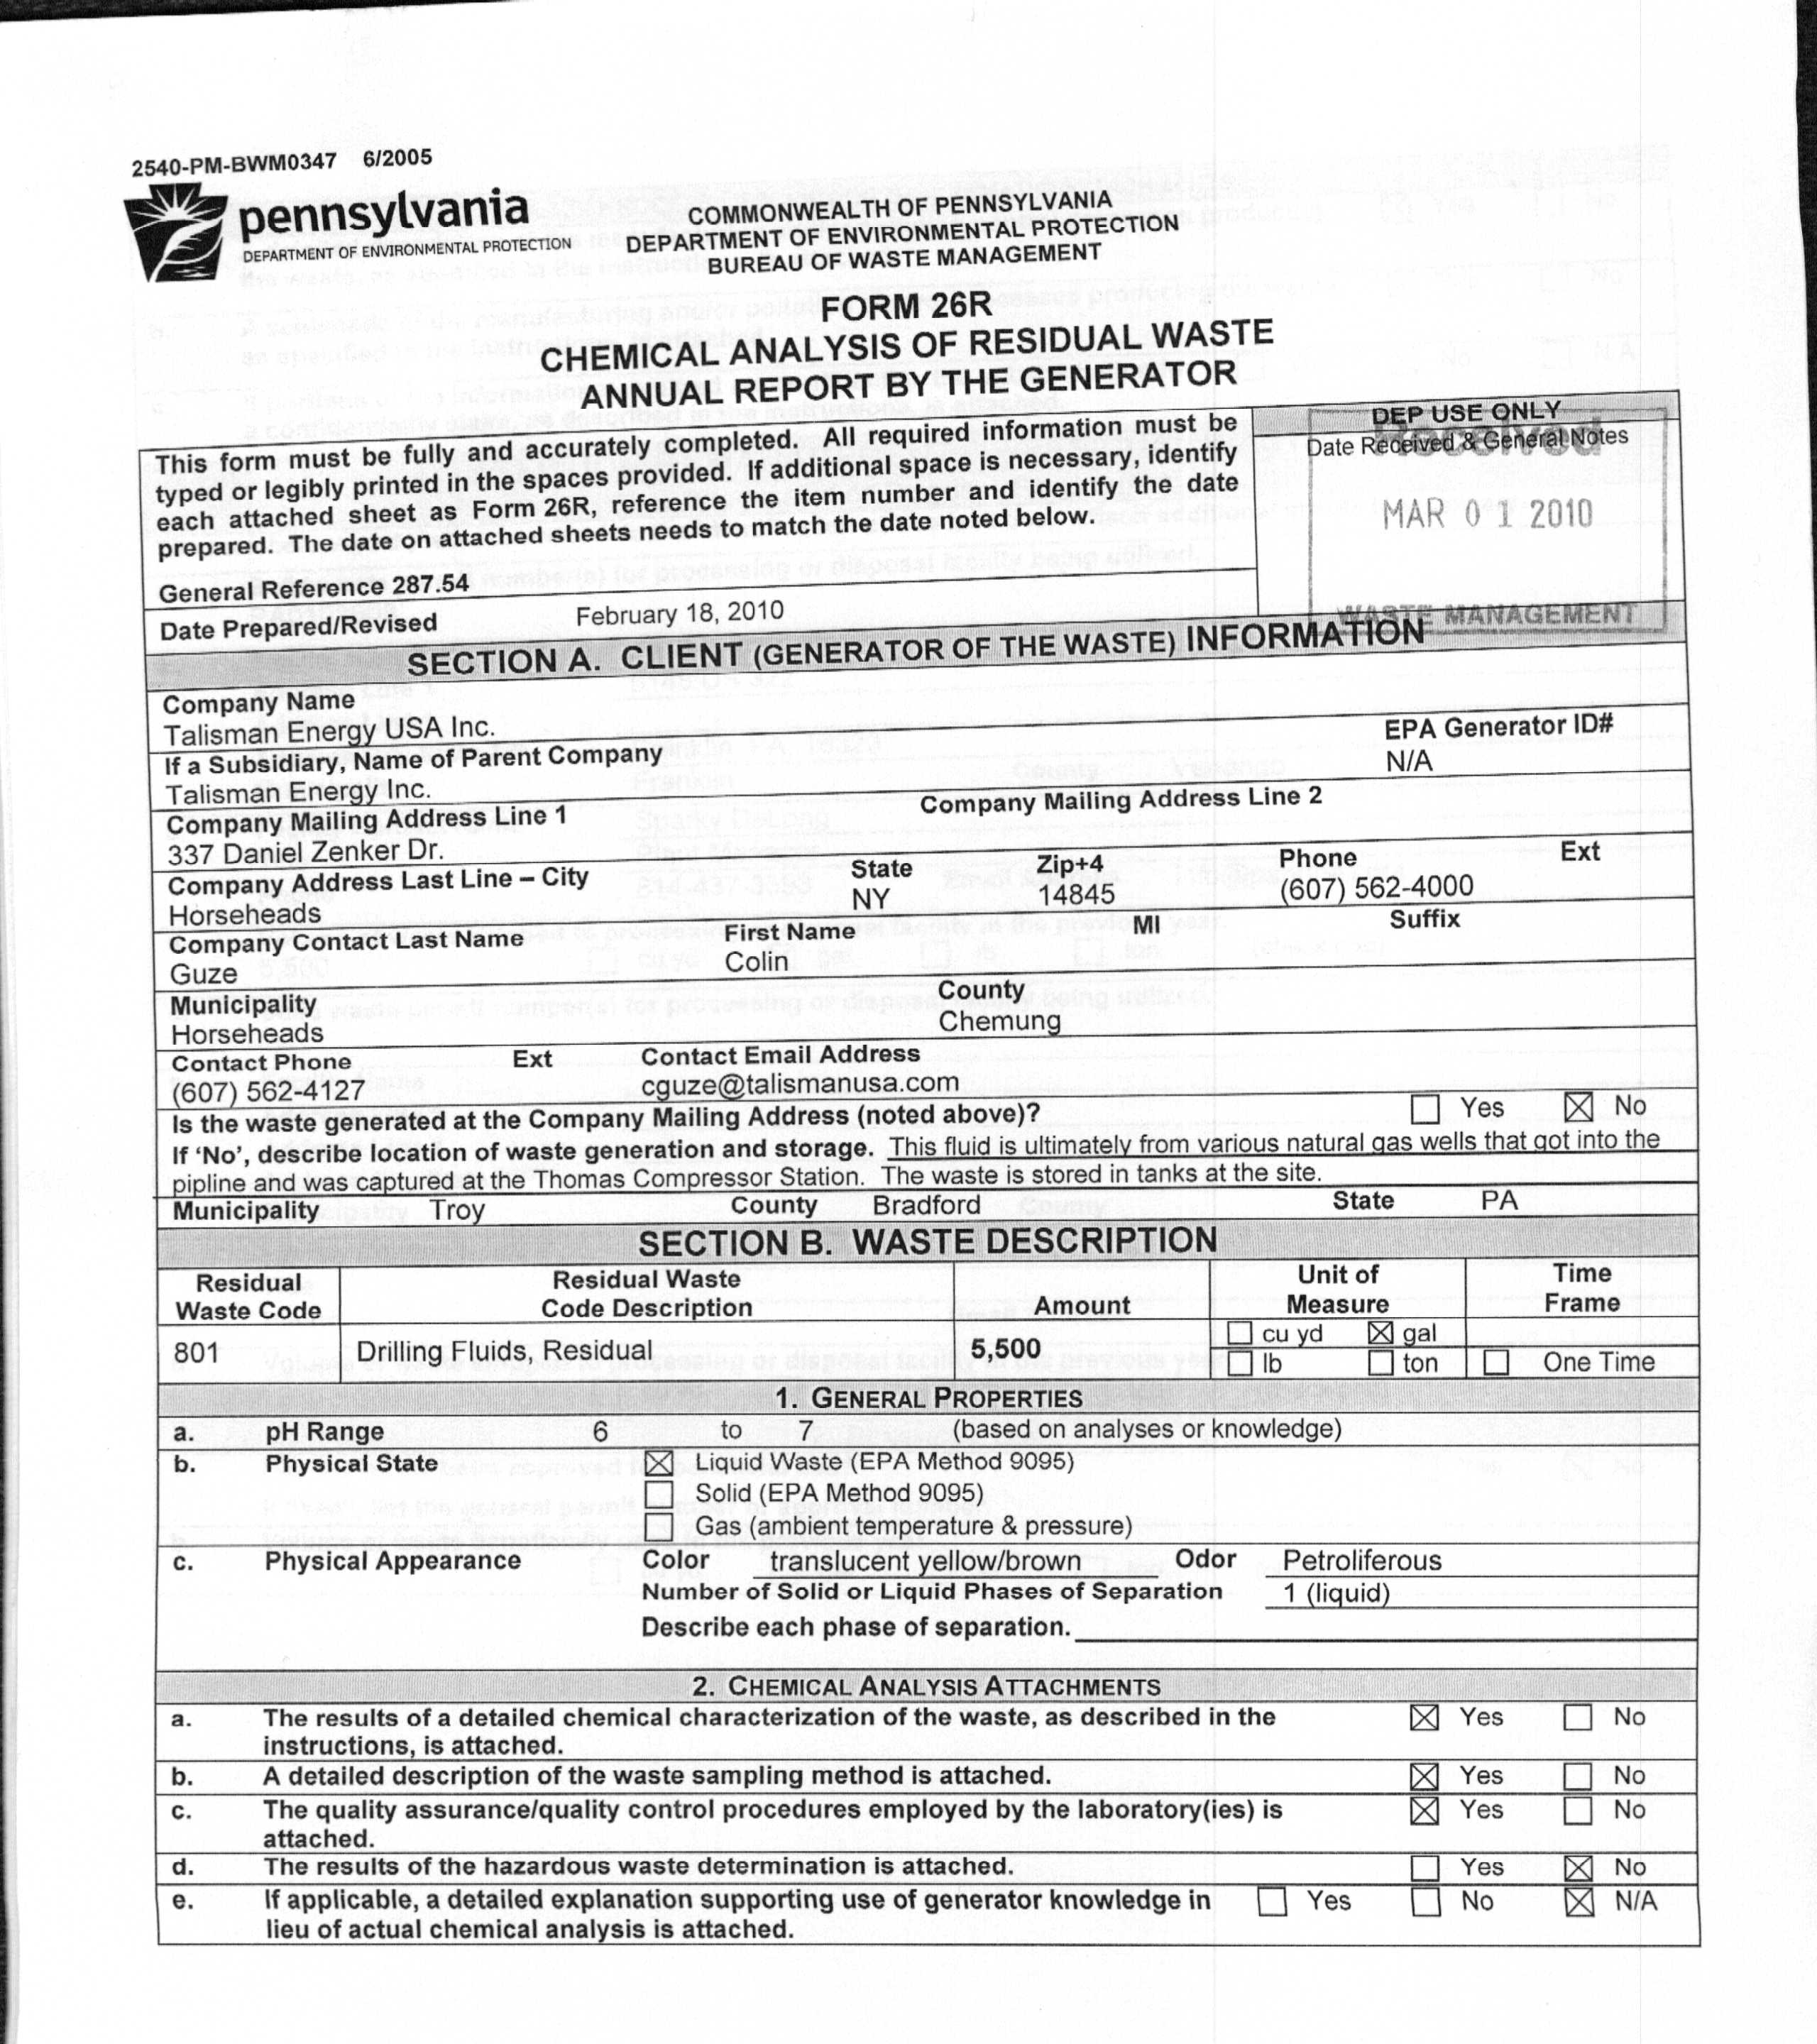
Project data includes well pad location, company name, permit numbers, date of drilling, and selected chemical parameter data from several sources. Sources include data from 26R forms[2] and a New York Times article. Data were transferred from Excel™ into ArcMap™. Data was narrowed down to only 90 day production data. 90 day production data is used due to the comparison of the 26R form analysis dates and spud dates[3]. The date differences seemed to mostly fall around 90 days. Latitude and longitude coordinates were retrieved from data on the Department of Environmental Protection website. For some data, coordinates were unavailable to retrieve. Therefore, I georeferenced[4] points using ArcGis in order to gain xy coordinates. Each parameter is mapped to its own extent in which data is available.

I experimented with various layouts to produce maps following good cartographic principles. Final maps include contour maps, which were calculated using Inverse Distance Weighted Interpolation[5], overlaid with graduated symbols[6] for values of nine parameters; Gross Alpha radiation, Gross Beta radiation, radium-226, radium-228, barium, strontium, sodium, and calcium.  A final poster, 26R forms, and a few  other sample maps are shown at the bottom of this blog post. It is important to note that the parameters are strictly from flowback water from the Marcellus Shale natural gas extraction process and the levels are not necessarily drinking water levels; the values are before treatment.   

Guest Post Darin Rockwell, Geology & Geography Bucknell ’13

______________________________________________________________________________________________________________________________________________________________________

[1] Flowback Water: Water that returns to the surface at the well head after fracking

[2] 26R forms: A form that each company is mandated to be sent to DEP annually that includes a chemical analysis of the residual waste produced at a site

 [3] Spud Dates: The start of drilling on a well

[4] Georeferenced: Defining spatial reference by location in terms of projections and coordinate systems

[5] Inverse Distance Weighted Interpolation: predicting unknown values using the known values at certain locations using arcGIS

[6] Graduated Symbols: A way to represent data that includes proportionate symbols according to break values in the data


Categories
Bucknell/Local Interest Environment Events/Calendar General GIS Slideshow

GIS posters at Sigma Xi summer research symposium

Come to the Sigma Xi summer research symposium on Wednesday, July 27th from 2-4pm at the Langone Center’s Terrace room to check out posters by student researchers.  There will be a variety of posters that feature GIS as a research methodology and/or visualization tool – including posters about the Flying Bison drone, community asset mapping, georeferencing historic maps, Marcellus Shale research, recycling & waste at Bucknell and other topics.

Categories
Bucknell/Local Interest Events/Calendar Marcellus Shale Slideshow

Presentation Monday, May 2nd, 8pm – “Guinea Pigs Atop the Marcellus Shale”

From a press release from the Bucknell Environmental Center:

Presentation – “Guinea Pigs Atop the Marcellus Shale”
8 – 9:30 pm on Monday, May 2nd at the Union County Government Center, 155 North 15th Street in Lewisburg.

The event is free and open to the public.

Barbara Jarmoska, who serves on the Board of Directors of the Responsible Drilling Alliance (RDA), a grassroots organization based in Williamsport, will be the speaker. RDA is an education and advocacy coalition seeking to educate the public about the truth and consequences of deep shale gas drilling. (www.responsibledrillingalliance.org).   Jarmoska states, “After receiving numerous requests from colleges,
civic groups and organizations asking for someone to come and speak on the topic of gas drilling, I sought the help of local photographers tocreate this slide presentation. It is my hope that this talk will help
people to realize the gravity and scope of what is happening to Pennsylvania as our farm and forest lands are transformed intoindustrial landscapes by multinational energy companies who have moved
in to stake their claim to the gas that lies a mile below the land on which we live, work and play.”

Categories
Bucknell/Local Interest Events/Calendar General GIS Marcellus Shale Slideshow

TNC Presentation on Marcellus Shale – Monday, April 4 @ 4:30pm

What: Presentation by The Nature Conservancy on Marcellus Shale/PA Energy Impacts
When: Monday, April 4th at 4:30pm
Where: Bertrand Library, Traditional Reading Room

Refreshments will be served.

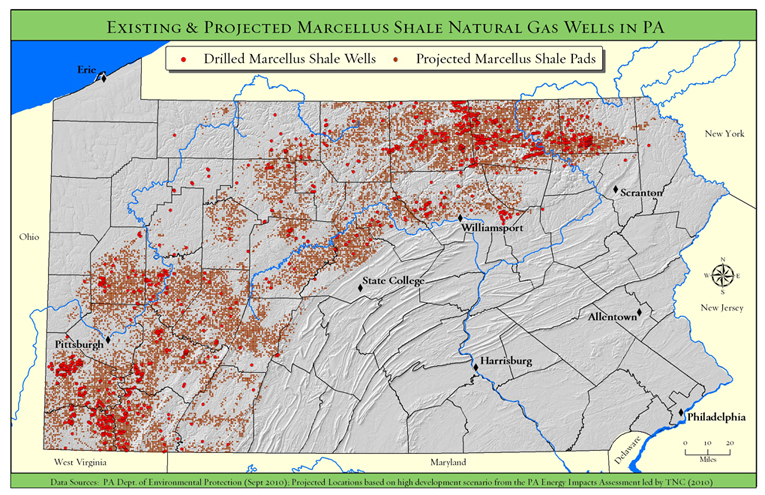
Come and hear Tamara Gagnolet, GIS Analyst and Conservation Data Manager for the Pennsylvania chapter of the Nature Conservancy, discuss her work in using GIS to analyze potential impacts of Marcellus Shale gas drilling in Pennsylvania. Ms. Gagnolet’s presentation will focus on how GIS and spatial analysis were used to project how much energy might be developed in PA during the next 20 years, where that development is more or less likely to occur and what types of strategies might need to be employed to mitigate potential habitat impacts.

Students are welcome and encouraged to attend.