Categories
Bucknell/Local Interest Digital Humanities Environment General GIS GIS in Environmental Studies Marcellus Shale Slideshow

GIS in the Classroom (and dorms): Environmental Residential College

In fall 2011, Professors Steve Jordan and Chris Daniels assigned a semester-long documentary project to students in Bucknell’s Environmental Residential College. The goal was to create video essays to tell the story of how the Marcellus Shale gas boom is impacting communities in northeastern Pennsylvania. Students visited communities impacted by the gas boom to conduct interviews and capture video footage that would help them tell the story of the local contexts in which the gas boom is taking place across the state.

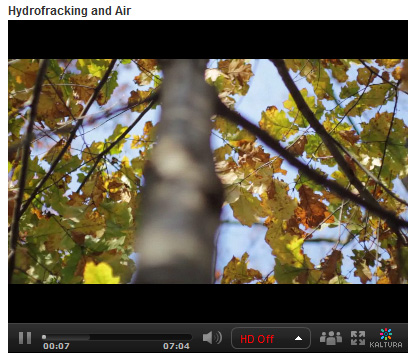
In addition to other research methods, the teams of students used GIS to explore the spatial footprint of the gas boom on different communities. Students were tasked with integrating the spatial aspect of the story into their video essays. The clip below is taken from the ‘Hydrofracking & Air’ video created by students Zoe Gaston, Claire Rapp, Sarah Baker, Thuyvan Luu, Colin Lind and Kyle Montgomery – all first-year students in Bucknell’s Environmental Residential College.

video platform video management video solutions video player

To create the map animation seen in the video, the students worked with me to visualize GIS data in ArcMap and export the data to a GoogleEarth KML format. Next, the students used GoogleEarth to draw the estimated pathway of the pipeline connecting several air compressor stations in their area of interest. Then the students created an animation in GoogleEarth that was spliced into the video essay to illustrate the point they were trying to make about air pollution associated with natural gas infrastructure. By the way… in a few months Bucknell GIS expects to have data on all infrastructure related to natural gas and electricity generation in Pennsylvania – including pipelines and transmission lines (so that next time we’ll be able to be more precise than we were with the ‘connect the dot’ approach we employed in this video).

Click here to see the full-length ‘Hydrofracking & Air’ video and other videos submitted by students in the class.
 

Categories
Bucknell/Local Interest Digital Humanities General GIS GIS in History Slideshow

Bucknell HGIS presentation at Yale

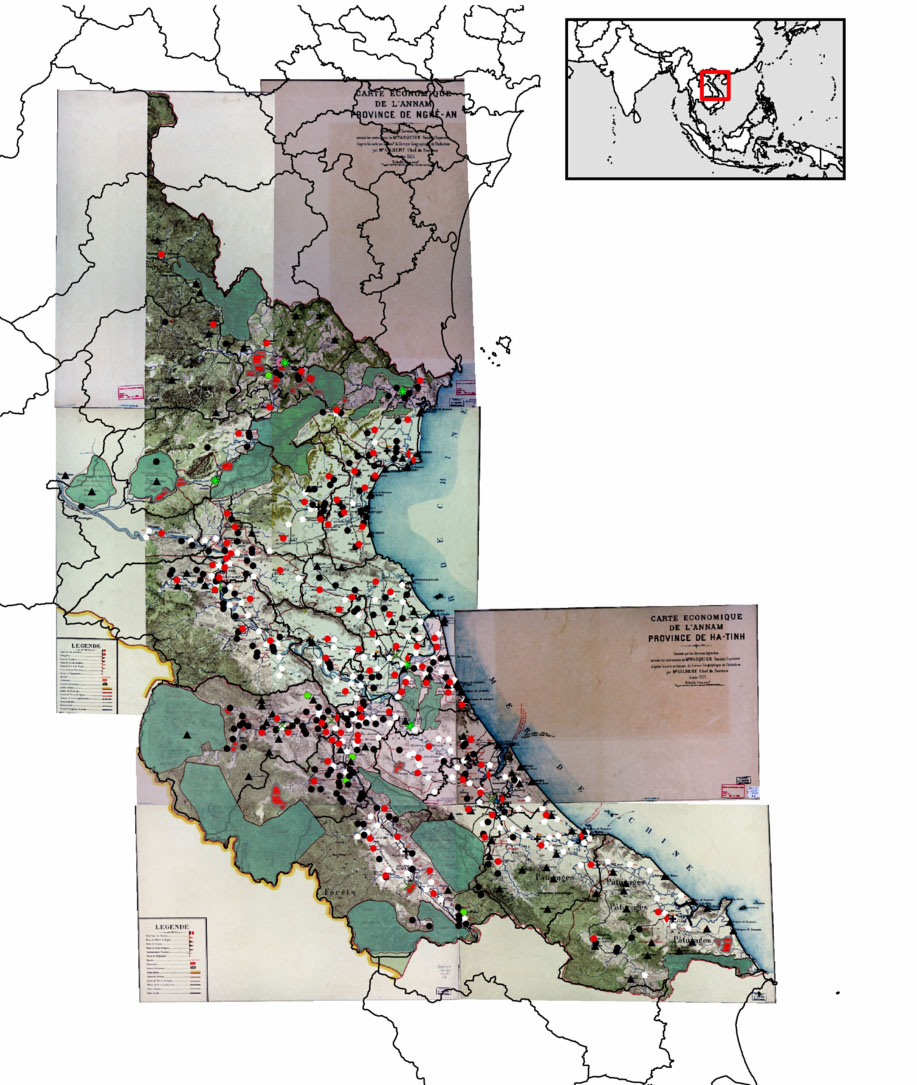
Over the last two and a half years, Bucknell History professor David Del Testa has been working – on his own and in collaboration with me and the GIS Student Assistants – on integrating GIS into his research on historical protest events in Vietnam.  Last October, Prof. Del Testa presented preliminary results from this work at UC Berkeley’s Center for Southeast Asia Studies. Click here to see a video of his presentation and to check out his H-GIS (historical GIS) blog Places, Spaces, Peoples, History.

On Wednesday, February 8th, Prof. Del Testa will be travelling to New Haven, CT to deliver another presentation of his work in progress. The presentation, called ‘Re-Evaluating Vietnam’s Nghe-Tinh Soviets (1930-31) using a Historical GIS,’ will be hosted by the Yale University Council for Southeast Asian Studies and is open to the public (in case you happen to be in the neighborhood… the talk will be held in Room 203, Luce Hall, 34 Hillhouse Avenue).

Here’s a link to the presentation announcement, along with an abstract:

“Reevaluating the Nghe-Tinh Soviets of 1930-1931 using a Historical GIS: Refining Some Preliminary Observations”
David Del Testa, Department of History, Bucknell University

The Nghe-Tinh Soviets of 1930-1931, a rebellion against colonial authority in north-central and central colonial Vietnam, has received extensive analysis by a variety of commentators and scholars, both Vietnamese and not. Most scholars, Vietnam and internationally, settled on some view of immiseration combined with the presence of pro-communist organizers as the motive forces for the rebellion, but a few have favored questions of political dissatisfaction and local empowerment as underlying motivations for revolt. Until recently, examining the rebellion on a gross scale in order to test either theory has proven difficult, with a surfeit of information but no easy way to process it in order to underwrite large-scale analyses. Del Testa is using a historical GIS (geographical information system) analysis, which blends statistics with digitized maps, in order to display correlations between factors, such as wealth, religion, and so on of those who rebelled in order to reexamine the Nghe-Tinh Soviets movement on a grand scale. His presentation will illustrate some initial findings as well as the techniques used.


Categories
Bucknell/Local Interest General GIS GIS in Film Studies Slideshow Videos

Mapping wheel-chair access at Bucknell

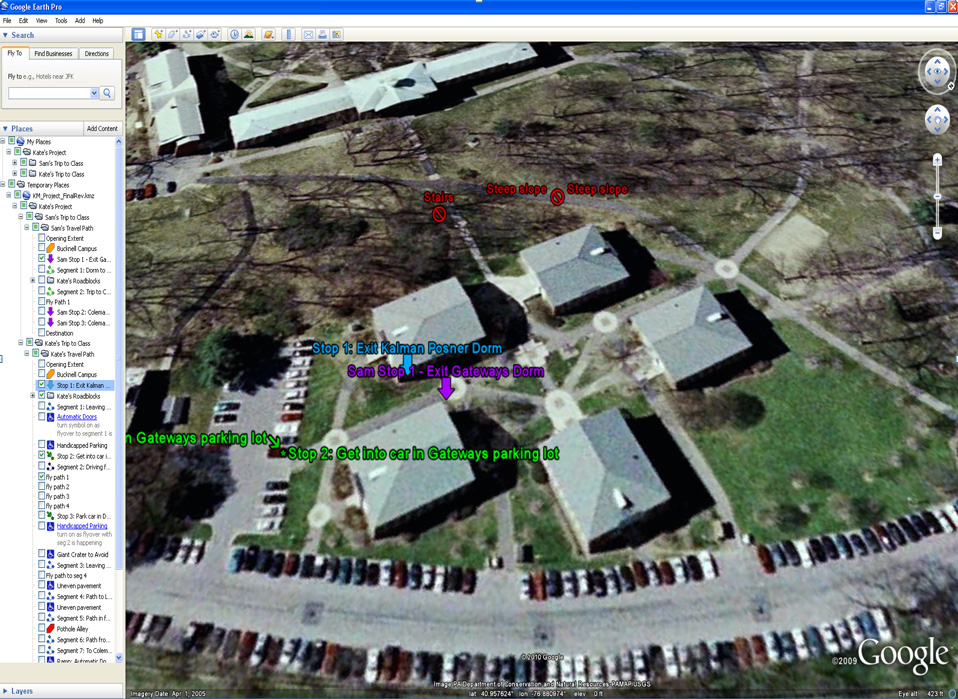
In spring 2010, Bucknell student Kate Matelan, ’10  worked with film professor Eric Faden to produce a documentary film focused on her experiences as a disabled student on campus.  To illustrate the differences between navigating the Bucknell campus in a wheelchair vs. on foot, Kate and I developed a GoogleEarth project with placemarks and travel paths to mark and annotate both her route and an able-bodied student’s route to a class held in Coleman 221.

In the film a 4-panel split screen (aka ’24’ style) approach was used to simultaneously present a GoogleEarth fly-over of each student’s travel path synced to video footage of the students describing the course of their daily trip to Coleman 221. See video excerpt and screenshot from GoogleEarth project below. I’ll make the KML file available as soon as I can figure how to to do that on WordPress.


Video Platform Video Management Video Solutions Video Player

Note: video footage was shot using several cameras including the GoPro Hero and Kodak Zi8. Editing was done in Final Cut Pro.

Categories
Bucknell/Local Interest Data Environment General GIS GIS in Computer Science GIS in Engineering GIS in Environmental Studies GIS in Geography GIS in Geology Slideshow Videos

Computer science major builds aerial drone for a bird’s-eye view of local stream

Bucknell communications recently published an article on the work that Nick Urban and the other GIS student assistants did this summer for the Miller Run Restoration project.  Excerpt below – click here to read the full article.

LEWISBURG, Pa. – As the son of an aircraft mechanic, Nick Urban learned a thing or two about planes.

The rising senior at Bucknell University started out putting together model airplanes when he was a child but later became more interested in the technology that makes them work.

This summer, Urban, a computer science major from New Jersey, has combined the two interests in a research project in which he is designing, building and flying a remote-controlled aerial drone. The so-called “Flying Bison,” outfitted with video and still cameras and GIS technology, is being used to capture high-resolution images of Miller Run Creek for an ongoing restoration of the waterway that runs through Lewisburg. The data also will be used to assess how well unmanned aerial vehicles monitor environmental change.

“Pretty much all the equipment you would find on a regular plane is squeezed onto this remote-control plane,” Urban said during a recent test flight at the Bucknell University Golf Course. “It has a manual takeoff and landing, but I flip a switch on the transmitter and it will fly itself and navigate on its own.”

Categories
Bucknell/Local Interest Data Environment General GIS GIS in Computer Science GIS in Engineering GIS in Environmental Studies GIS in Geography GIS in Geology Miller Run Restoration Project Slideshow Videos

Video footage from Flying Bison test run

On July 26th, Nick Urban and the summer 2011 GIS team conducted a test flight of the Flying Bison. See video to learn more about the Miller Run Restoration Project and to see footage captured by the drone during its flight.

Thanks to Lindsay Coffee and Erin Murphy for their work on shooting & editing the video footage.

video platform video management video solutions video player