Categories
Bucknell/Local Interest Data Environment General GIS GIS in Engineering GIS in Environmental Studies Slideshow

GIS in the Classroom: Civil & Environmental Engineering 432

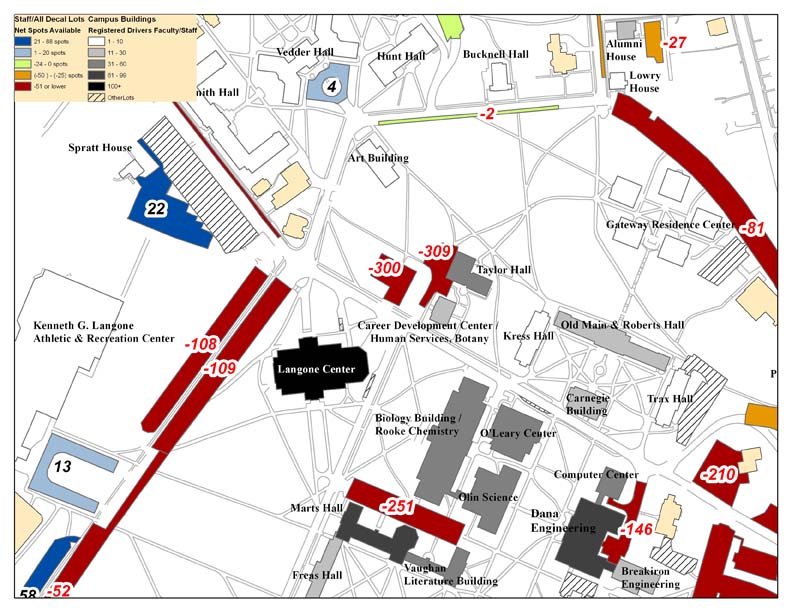
Last summer, Bucknell’s administration asked our GIS team to conduct an analysis of parking availability across campus.  The project was assigned to Dan Dougherty, Geography/History ’12 and is summarized in Dan’s guest post here. This spring, a team of four students in Prof. Michelle Oswald’s CENG 432 course, Sustainable Transportation Engineering, are picking up where Dan left off. The team – comprised of Meredith Menzel, Emily Liggett, Dennis Lee and Jordan Roder (all CENG majors from the class of 2012) – intends to add new data, extend the analysis and propose environmentally-friendly solutions to the parking shortages across campus. Says Menzel,

“We are planning on doing some of our own surveying to update these parking lot ratios and update the maps with any new parking lots, especially in relation to the current construction, the Bucknell South campus project, and the Master Plan.

We are also planning on surveying Bucknell students and staff to collect more information about who drives, walks, etc. to evaluate the parking demand which will help us propose new parking solutions. If some of these solutions involve physically redesigning the parking lots at Bucknell, we were planning on creating some new maps to present our solutions.”

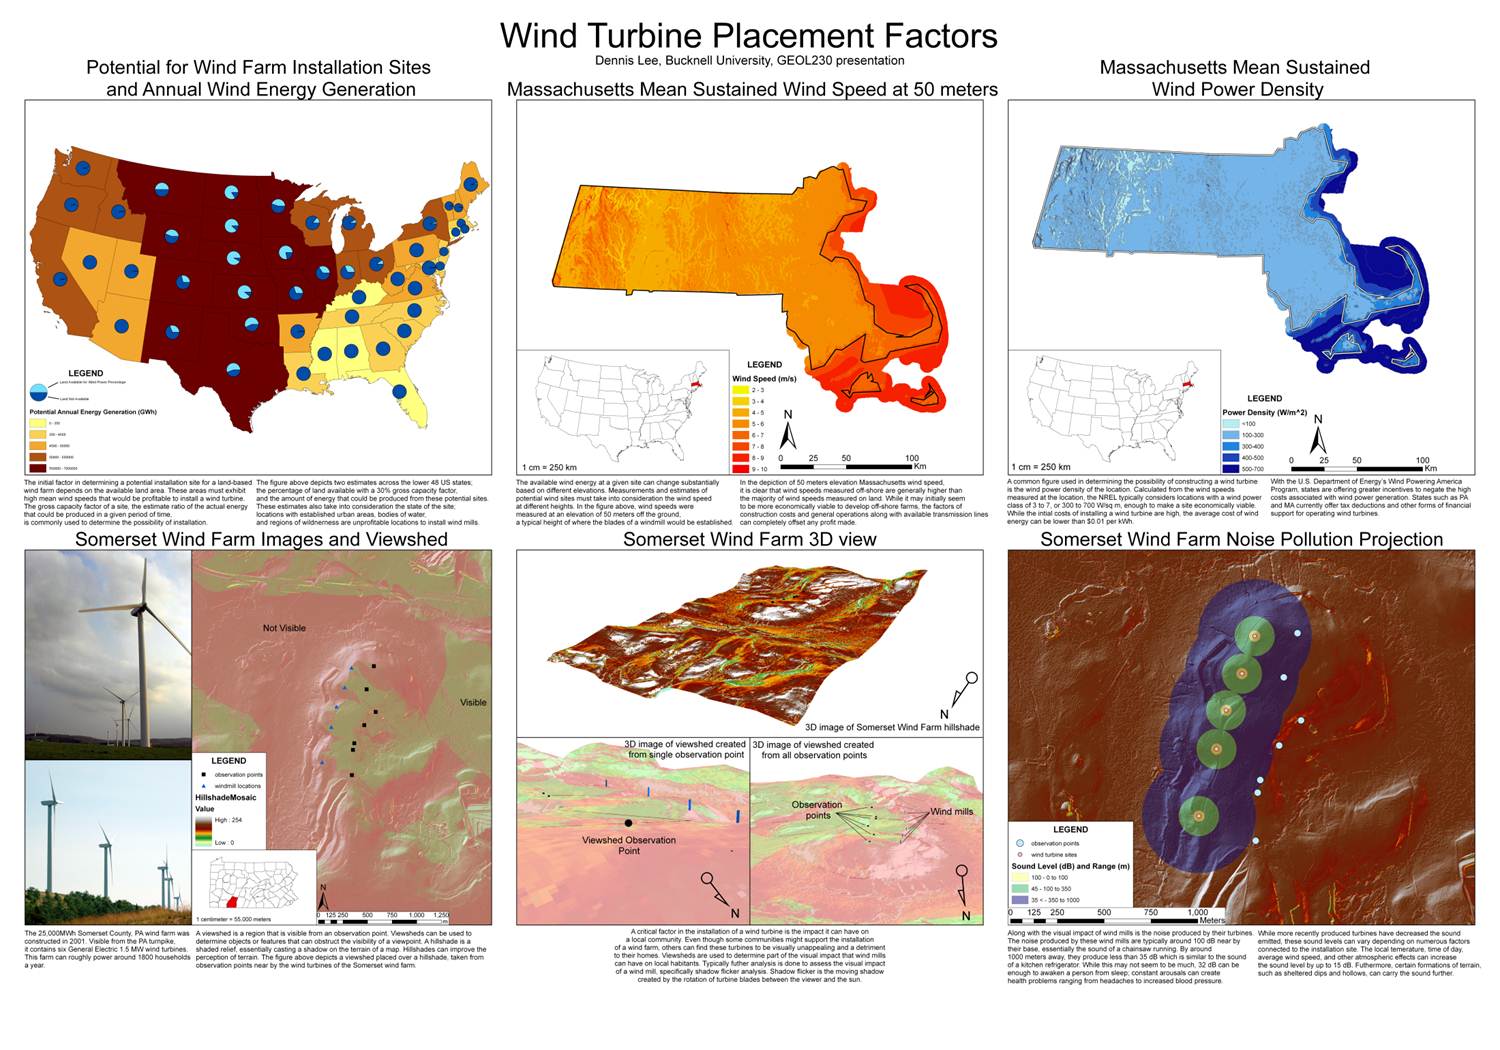
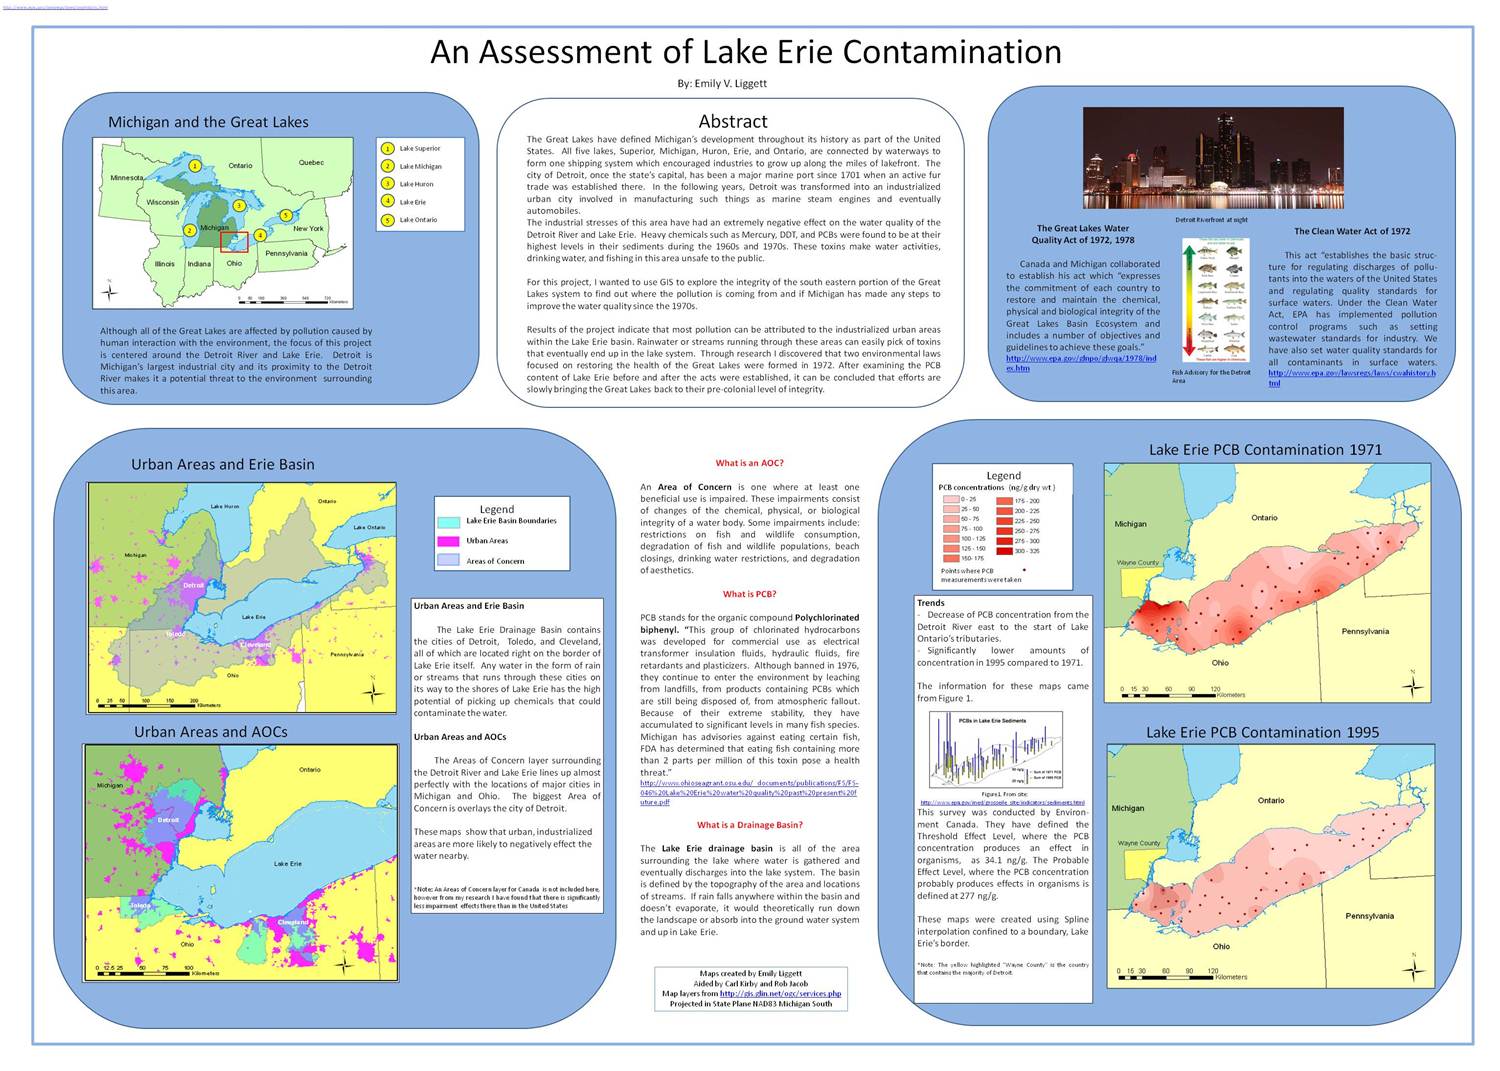
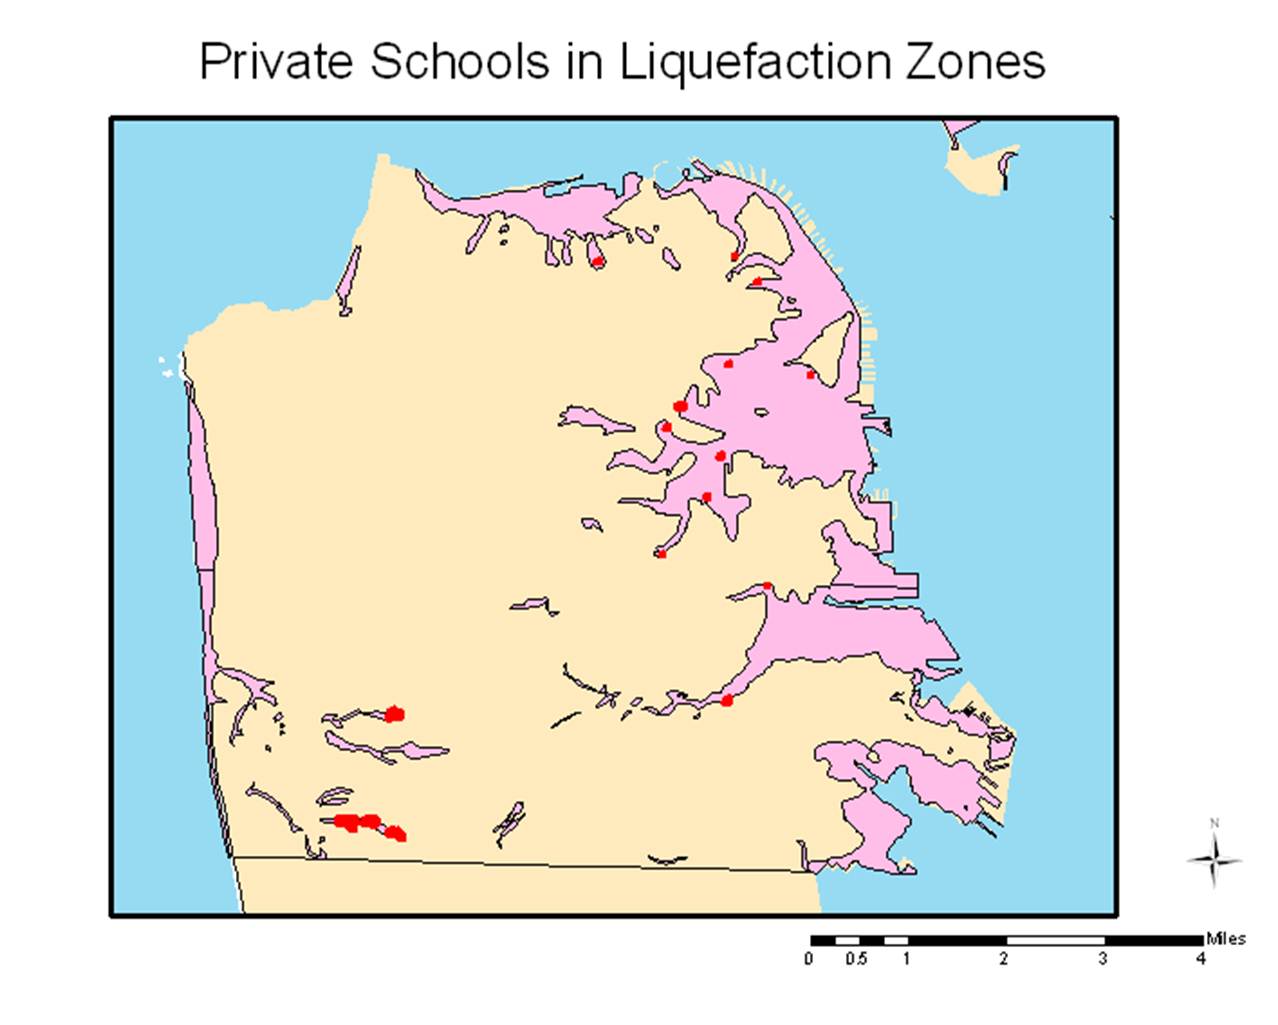
Incidentally, 3 of the 4 team members (Menzel, Liggett and Lee), are veterans of Prof. Carl Kirby’s GEOL230 class, Environmental GIS. Below are maps that each of the students produced for GEOL230 (click on the images to view them at full size). Stay tuned for updates for their work on the parking analysis.

Dennis Lee’s poster from GEOL230

 Emily Liggett’s poster from GEOL230

A map from Meredith Menzel’s GEOL230 presentation


Categories
Data Digital Humanities General GIS GIS in History Slideshow

Free, GIS-ready historic maps from New York Public Library

Here’s another treasure trove of data that’s ready and waiting to be added to your ArcMap session.

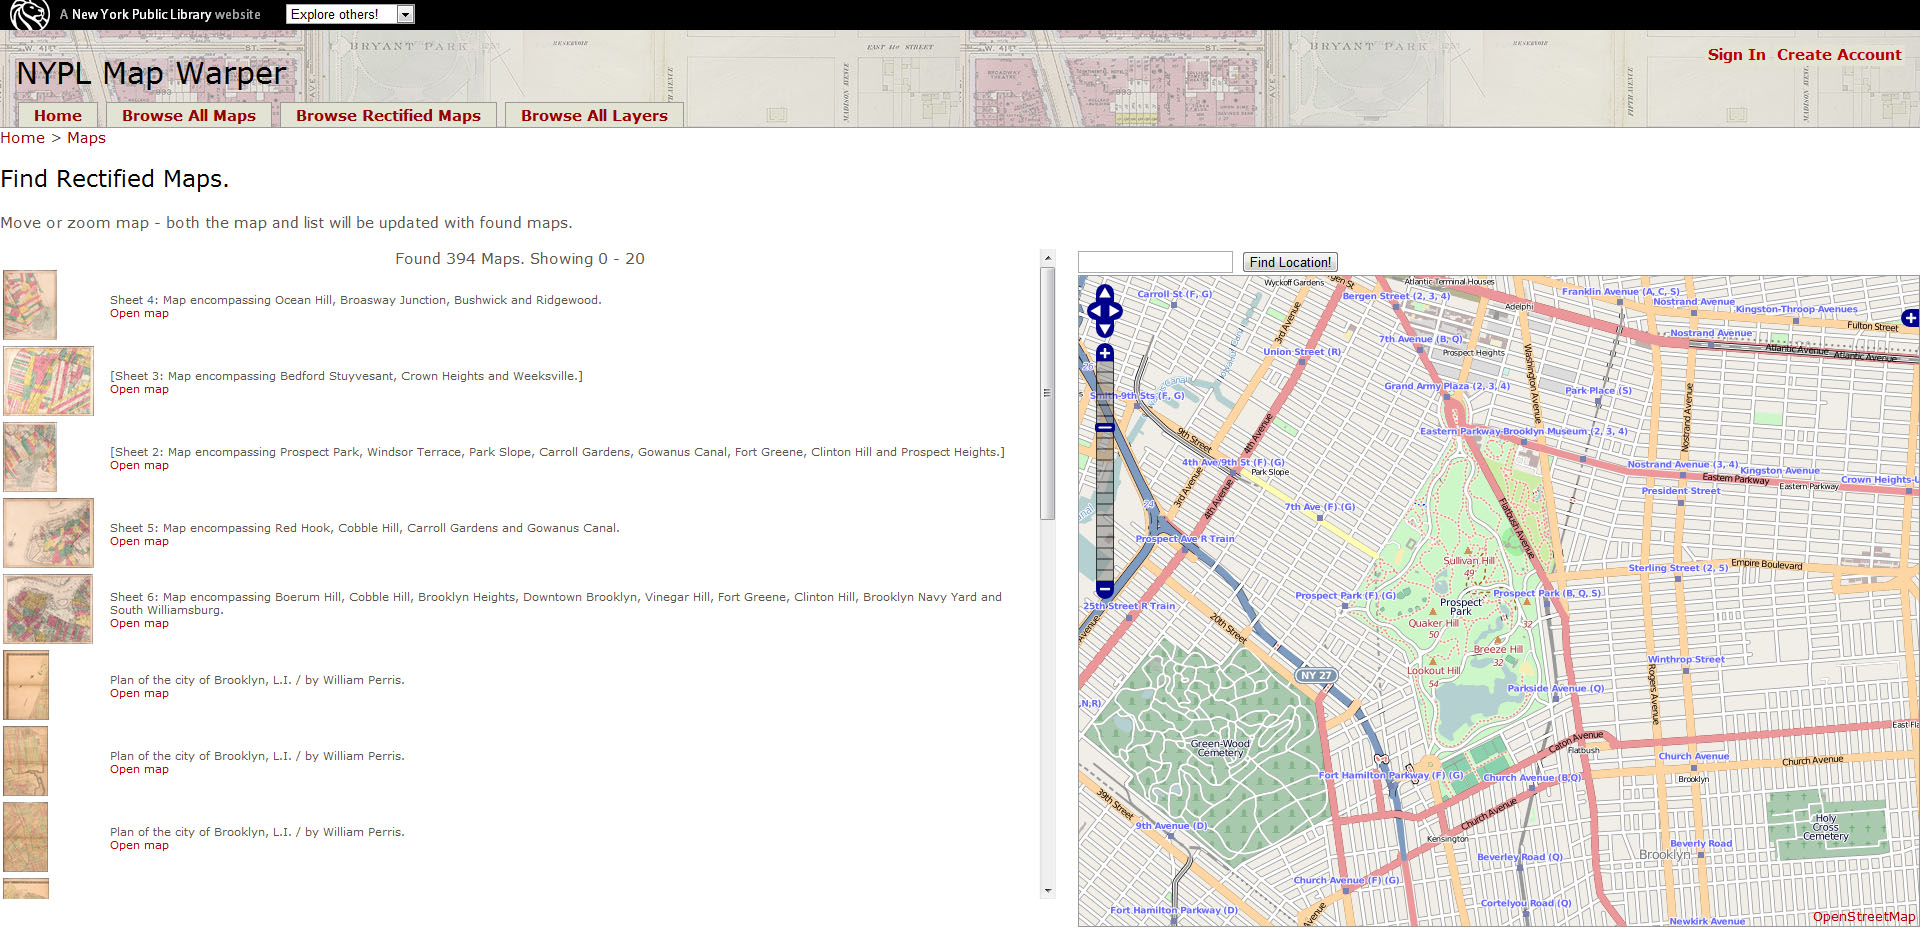
Over the last several years the New York Public Library has scanned more than 10,000 public domain historic maps and atlases of New York City and made digital copies of those maps available via its website. Recently NYPL took this project to the next level by creating a web tool that can be used (by NYPL staff as well as volunteers from the general public) to georeference the maps – i.e. pin the historic maps down to their location on a modern-day reference map.  Click here to check out their blog post about the project. Or click here to check out the do-it-yourself MapWarper tool and/or browse through the thousands of maps that have already been georectified.

What’s the big deal about being able to look at historic maps in GIS? Here’s an excerpt from the NYPL blog post on the project that does a great job of explaining how GIS can shed new light on old maps.

So, what does this all mean? If we have documents related to past times and past places (old maps), then we can create data to “rebuild” those past times and past places. And if we “rebuild” old places in virtual space, we can then organize a universe of other information around those old places. Wouldn’t it be great to haveyelp.com and menupages.com, but for old restaurants and with old menus and prices? Or to have at least a smattering of old photos in a historical street view? Or to search the National Newspaper Digitization Project using a map interface? At the core of all of these dream-like research futures is geographic information, in machine-readable format. And to get there, we need to warp, crop, mosaic, and trace our old maps. That’s why we’re doing what we’re doing. And as a positive byproduct, the maps just so happen to become more useful at each step along the way.

Using the NYPL website to find GIS-ready historic maps is incredibly easy. I used the ‘search by map’ option to zoom into Prospect Park in Brooklyn to find georectified historic maps that I could download and add straight to my ArcMap session. A whopping 394 maps were returned in the results – i.e. 394 maps that I could download as a KMZ file and add directly to ArcMap to explore how this small chunk of turf grew, changed and evolved through time to become the place that it is now.


If you find maps in the NYPL collection that have the historic places or events that you are interested in, but are not yet GIS-ready, you can use the MapWarper tool to georeference them yourself. Here’s a link to instructions for using the MapWarper – along with a YouTube video that describes the process.

httpv://youtu.be/G8ms_eBU8MQ


Categories
Bucknell/Local Interest Data General GIS GIS Jobs, Internships, Scholarships & Grad Programs Slideshow

GIS Job Opportunities – Smith College

In recent weeks I’ve talked to a number of second semester seniors about GIS job options.  I’m hoping at some point to write a blog post with links to GIS job search sites and other resources, but for now I’m just going to pass along job listings as I see them.

I just got an e-mail from Jon Caris, the GIS Specialist at Smith College in Northampton, MA saying that Smith is looking to hire a new or recent college graduate (within 3 years) for the brand new Post-Baccalaureate Spatial Analysis Fellow position.  Start date is July 2012 – direct link to the posting can be found here.  This position is ideal for a student hoping to gain additional GIS experience before looking for a permanent job, or as a bridge before graduate school. Duties are similar to what the team of GIS Student Assistants do at Bucknell and include:

  • Data Documentation, Maintenance, and Acquisition
  • Equipment and Software Maintenance
  • Class & Individual Support
  • Administrative Support

If this sounds interesting to you please talk to me. Jon is doing a whole bunch of really innovative things with GIS at Smith and would be an incredible mentor to work with!

Categories
Bucknell/Local Interest Data General GIS Slideshow

Coming soon to your ArcMap session – a GIANT JACKPOT OF DATA

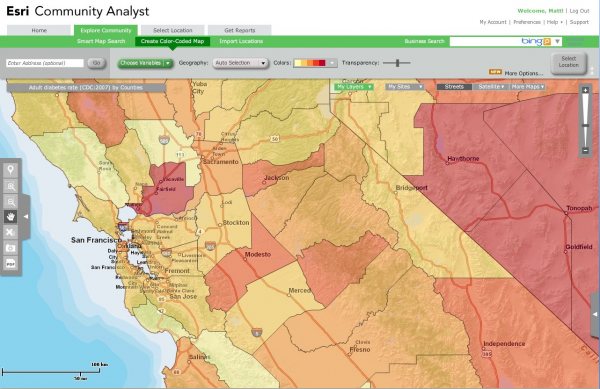
ESRI just added Business Analyst and Community Analyst to  Bucknell’s site license. What that means for you is that you will soon have access to several thousand ‘ready-to-map’ data variables – all within ArcMap.  You’ll also be able to use tools from the Business Analyst extension to do site selection, customer profiling, market penetration and other types of business analysis. But really, the exciting part here is the GIANT JACKPOT OF DATA.  Check out the lists below to get an idea of the types of variables that you will be able to add to ArcMap with just the click of a mouse.

I’m working on getting these datasets pushed out to the labs and faculty computers as soon as possible. Stay tuned for more details.

 Business Analyst Datasets:

Demographic Data

Current-year updates and five-year projections of Esri’s Updated Demographics use more than 1,600 variables about employee population, population by occupation/industry, disposable income, and consumer expenditures all at the United States, state, county, ZIP Code, census tract, block group, core-based statistical area, and designated market area geography levels.

Segmentation Data

Esri’s Tapestry Segmentation classifies U.S. neighborhoods into 65 segments based on their socioeconomic and demographic compositions. The market segmentation data is available at the census tract level and above.

Consumer Spending

Annually updated data details which products and services consumers buy. Approximately 90 variables in 15 categories such as apparel, food, and financial are included.

Business Data

A national database of approximately 12 million U.S. businesses from Infogroup to identify customers and competitors, business data is arranged by business name, industry description or SIC/North American Industry Classification System, sales, employees, and location.

Major Shopping Centers

The national database from the Directory of Major Malls, Inc., lists detailed information for more than 4,200 major shopping centers, malls, and lifestyle/specialty centers in the United States. Major shopping centers’ variables include center name, gross leasable area, type of center, total retail sales, distance to the nearest competing center, name of and distance to the nearest major city, and total number of stores.

Street Data

Tele Atlas’ high-quality, nationwide street and geocoding databases provide routing attributes and attractive map displays as a single street database source. Business Analyst Desktop includes Esri’s geocoder that integrates an address-based approach with more than 54 million residential and commercial U.S. structure addresses from the Tele Atlas Address Points database. This database maps street addresses to a physical location, so each address is a fixed point and not an interpolation from an address range.


Community Analyst Datasets:

Bing Facility and Business Search
Infogroup Facility and Business Search
Mapping of Crime Data
Behavior and Preferences Reports
Electronics and Internet Market Potential
Financial Investments Market Potential
Health and Beauty Market Potential
Pets and Products Market Potential
Restaurant Market Potential
Retail Market Potential
Sports and Leisure Market Potential
Demographic Reports
1990–2000 Comparison Profile
Age 50+ Profile
Age by Income Profile
Age by Sex by Race Profile
Age by Sex Profile
American Community Survey (ACS) Housing Summary
American Community Survey (ACS) Population Summary
Census 2010 Geography Profile
Census 2000 Detailed Race Profile
Census 2000 Summary Profile
Community Profile
Demographic and Income Comparison Profile
Demographic and Income Profile
Detailed Age Profile
Detailed Income Profile
Demographic Reports (continued)
Disposable Income Profile
Executive Summary
Graphic Profile
Housing Profile
Net Worth Profile
Quarterly Demographic Profile
Neighborhood Type Reports
Dominant TapestryTM
Tapestry Segmentation Area Profile
Spending Reports
Automotive Aftermarket Expenditures
Financial Expenditures
House and Home Expenditures
Household Budget Expenditures
Medical Expenditures
Recreation Expenditures
Retail Goods and Services Expenditures
Economic Activity Reports
Business Locator
Business Summary
Major Shopping Center Locator
Major Shopping Center Map
Retail MarketPlace Profile
Maps and Aerial Imagery
Site Details Map
Site Map
Site Map with Satellite Imagery
Traffic Maps and Reports
Traffic Count Profile
Traffic Count Profile Map
Color-Coded Maps and Smart Map Search
AGS CrimeRisk Data
Behavior and Preferences Data
Consumer Spending Data
Demographic Data
Economic Activity/Business Data
Neighborhood Type/Tapestry Data
Public Data (USDA, EPA, CDC, and more)
Categories
Bucknell/Local Interest Crisis-Mapping Data Environment General GIS GIS Jobs, Internships, Scholarships & Grad Programs Map Apps Slideshow

GIS Job Opportunities – DevelopmentSeed

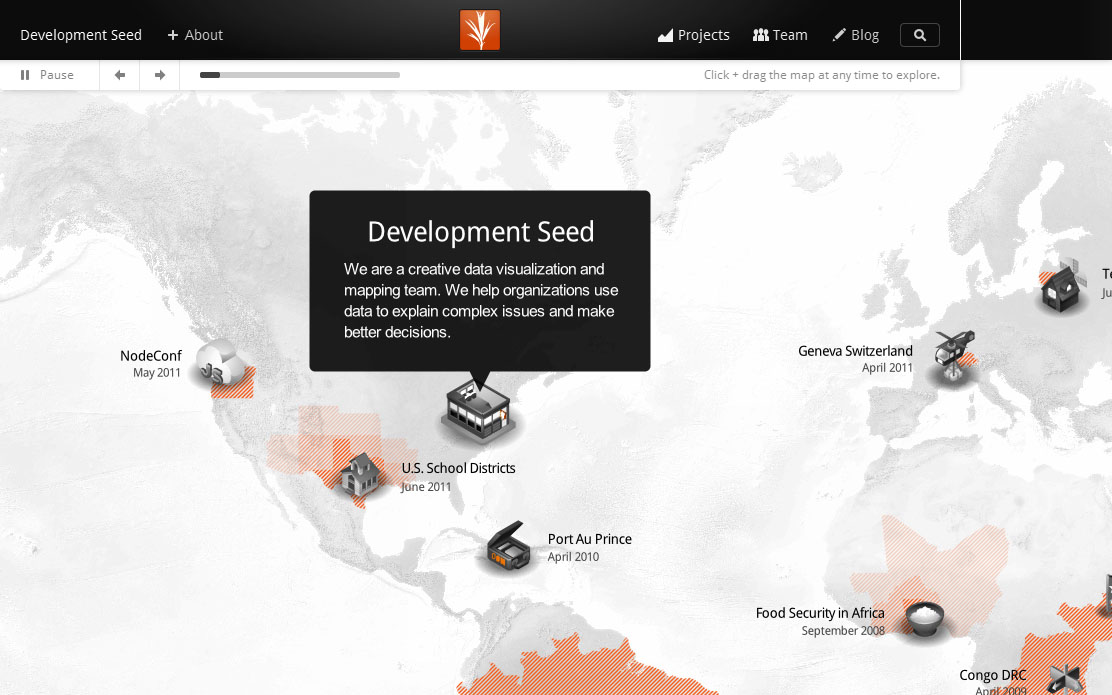
Back in October I mentioned that developing GIS technical skills can help you land a job after graduation. Well, here’s the proof.  Recent Bucknell grad Chad Lawlis, Environmental Studies ’11, just got hired as the Mapping & Data intern for Development Seed, a Washington D.C.-based consulting/R&D company known for its innovative, open-source solutions for data visualization and mapping.

Chad never had a chance to take either of Bucknell’s intro GIS courses (GEOG204 – Applied GIS, taught by Duane Griffin and GEOL 230 – Environmental GIS, taught by Carl Kirby and Rob Jacob) at Bucknell, although I’m sure he wishes he had as both are phenomenal courses! Instead, he picked up GIS skills by working as a research assistant for Prof. Amanda Wooden, developing GIS datasets for her work on environmental activism in Kyrgyzstan. Chad also served as a GIS Student Assistant during Summer 2011 working on a variety of projects, including asset mapping for Lycoming County.  Chad writes:

“Currently I am working on the Atlas Project… compiling and processing a number of large demographic data sets for all of the US which will soon translate into making election maps using TileMill (DevelopmentSeed’s free, lightweight map design software). I am already learning so much about data cleaning and processing – using OpenOffice, TextMate, Google Refine, SQLite, and Terminal so far – and looking forward to what’s to come with map making in TileMill and hopefully a bit of web design as well. The office atmosphere is a lot of fun too, very much a startup vibe… in a small renovated apartment with foosball, pingpong, and even a bar in the basement and a few dogs running around as well.”

So… if you like your maps served up with foosball, beer and dogs (and would like to get paid for working in that kind of environment), you should definitely consider developing GIS skills during your time at Bucknell.  The Development Seed job and many others can be found on the GIS Jobs Clearinghouse website. Or feel free to schedule an appointment to come talk with me about GIS job options.

Chad Lawlis, Environmental Studies '11