Categories
Bucknell/Local Interest Digital Humanities General GIS GIS Jobs, Internships, Scholarships & Grad Programs Map Apps Slideshow

2 new job openings in GIS/digital scholarship at Bucknell

Bucknell has created 2 new job positions – GIS/Web Application Specialist and Digital Scholarship Coordinator – to support digital scholarship initiatives on campus. Click here to apply. The new hires will be part of the ITEC group within the Library and IT Division and will join a team of instructional technology specialists who focus on integrating GIS, digital media and other technologies across the curriculum at Bucknell.

Our ideal candidate for the GIS/Web Application Specialist position will have strong tech skills in GIS and web development combined with an interest in visualization and data graphics in general. As the first person to fill this role, the GIS/Web Application Specialist will have an opportunity to set the tone for what digital scholarship projects will look like at Bucknell. We are looking for someone who is creative, innovative and thrives on learning new tools & technologies. In addition to GIS and application development, the GIS/Web Application Specialist will have an opportunity to delve into a wide range of other types of visualizations – including timelines, networks, interactive graphs/charts, etc. – to create highly-interactive sites that showcase faculty & student research and can serve as teaching/scholarship tools. 

We have a wide range of exciting teaching and research projects already underway and we’re looking for these new hires to help showcase those efforts and take digital scholarship to a new level at Bucknell. I’ve been here for 3 and a half years and can tell you that Bucknell is an amazing place to work. The atmosphere is both collegial and collaborative. The faculty have a deep commitment to engaging students in learning, both in the classroom and through faculty-led and independent student research projects. In the last 4 years, Bucknell has created five new positions (GIS Specialist, Video Specialist, Instructional Technology Specialist, GIS/Web Application Specialist and Digital Scholarship Coordinator) to support this type of work on campus. That alone speaks volumes about the high level of support we have from the university administration and Library & IT leadership for doing innovative work.

If you are interested in either of these jobs or know of someone who might be, please check out the job descriptions. Feel free to contact me if you have any questions. Click here to apply.


Categories
Bucknell/Local Interest Digital Humanities Events/Calendar GIS & Environmental Justice GIS by Academic Discipline GIS in Art GIS in Biology GIS in Computer Science GIS in Economics GIS in Engineering GIS in Environmental Studies GIS in Film Studies GIS in Geography GIS in Geology GIS in History GIS in Humanities GIS in Political Science GIS in Psychology GIS in Public Health GIS in Social Science GIS in Sociology GIS in Women's Studies GIScience, Pedagogy & Spatial Thinking Slideshow

Register & Submit Presentations for Bucknell-hosted GIS conference

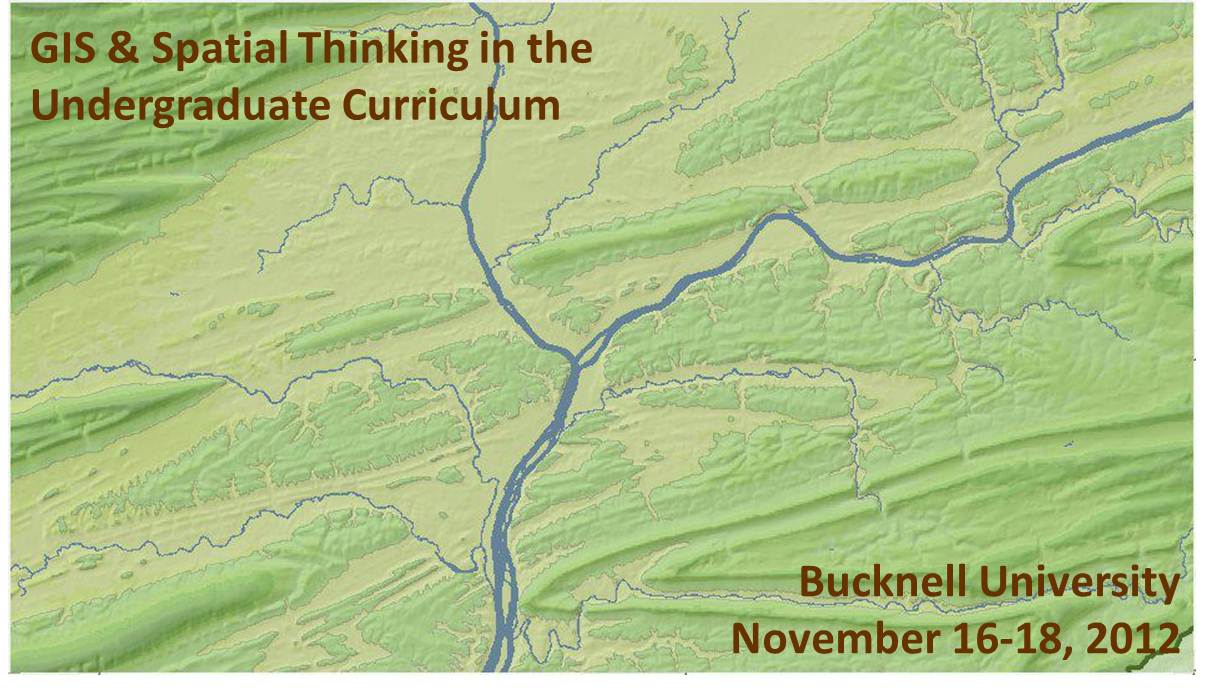
We recently launched the conference website for the upcoming Bucknell-hosted conference GIS & Spatial Thinking in the Undergraduate Curriculum.  Basic info is shown below, but please check out the conference website for details and updates as they become available.

About the Conference:

  • When: November 16-18, 2012
  • Where: Bucknell University, Lewisburg, PA. Click here for a map.
  • Details: Click on the pages shown on the menu above to access information onregistrationlodging, conference schedule, and submitting presentations and maps.
  • Deadlines:  Deadline for early bird registration is September 15, 2012. Deadline forsubmitting presentations and maps is September 21, 2012.
  • Format:  We have chosen a work-group format for the conference in order to maximize opportunities for discussion and brain-storming amongst participants. The main day of the conference will feature five work-group sessions. Each session will consist of 45 minutes of presentations and 45 minutes of open discussion organized around a theme. We are seeking 3 presenters and 1 chairperson for each of the 5 sessions. See the submissions page for a detailed description of each of the session topics:
    • 1a (Concurrent with 1b) – Mapping Human Activity – Qualitative Analysis GIS
    • 1b (Concurrent with 1a) – Quantitative Analysis & Technical Applications of GIS
    • 2   (Single group) – GIS in Pedagogy
    • 3a (Concurrent with 3b) – GIS in Community Outreach & Service Learning
    • 3b (Concurrent with 3a) – Software & Data Issues in GIS Instruction
  • Goals: Desired outcomes include: (1) providing mutual support for imaginative and challenging applications of spatial technology in undergraduate education; (2) fostering potential collaborative efforts between and within participant schools, such as joint research initiatives and/or shared resources for data, web maps and teaching materials, and; (3) creating a regional community of faculty and GIS/IT staff to interact on a regular basis, share information, and exchange ideas about the priorities identified during the conference.

This event is sponsored by Library & Information Technology at Bucknell University. Should you have any questions, please contact Janine Glathar at jlg046@bucknell.edu or (570) 577-1990.


Categories
Bucknell/Local Interest Digital Humanities General GIS GIS in History Slideshow

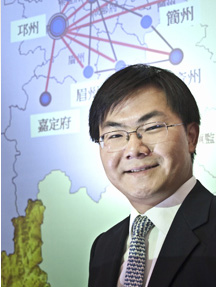
Faculty GIS Profiles: Song Chen, Assistant Professor of Chinese History

The following is a guest post by Prof. Song Chen, Assistant Professor of Chinese History, who arrived on campus in fall 2011. Click here to read the profile of Prof. Chen that was posted on the Bucknell website. In addition to his use of GIS for research purposes, Prof. Chen is planning to integrate GIS into a Spring 2013 quantitative methods course for history majors. Below is Prof. Chen’s description of how he uses GIS in his research on connections between the imperial state and local elites in 10th-13th century China:

My research combines GIS, network analysis, and prosopographical research. To understand the relationship between the imperial state and local elites in China, I use GIS to map out geographical patterns of civil servants and their marriage networks. Though my recent work relies primarily on a dataset I have personally built from a collection of several hundred funerary biographies from the 10th to the 13th century, I have also benefited significantly from other existing data collections and databases. I owe much to the China Biographical Database (CBDB) and China Historical GIS (CHGIS) projects.

CBDB is an online relational database under development but already contains about 120,000 historical figures. It contains massive geo-biographical data points, which are easily cross-queried and exported. CHGIS provides the most complete and authoritative point and polygon files for places in Chinese history. In future projects, I also plan to use GIS tools to visualize and analyze patterns of demographic settlement, economic activities, and social and intellectual interactions. I have also found G. William Skinner’s datasets on China tremendously useful.

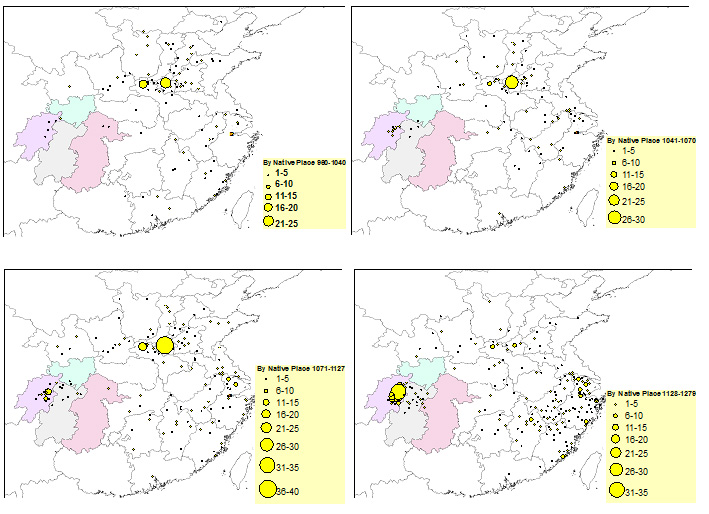
The following maps, for example, are generated by combining CBDB data and CHGIS polygon files and coordinates, with graduated symbology in ArcGIS. They show the native places of civil officials who were in the Sichuan region (the four highlighted administrative divisions) between 960 and 1279. These maps allow me to discover macrohistorical patterns of local governance during these centuries: a growing tendency of having native men staffing local offices in the Sichuan region.

Click image below for larger view.


Categories
Bucknell/Local Interest Digital Humanities Environment General GIS GIS in Environmental Studies Marcellus Shale Slideshow

GIS in the Classroom (and dorms): Environmental Residential College

In fall 2011, Professors Steve Jordan and Chris Daniels assigned a semester-long documentary project to students in Bucknell’s Environmental Residential College. The goal was to create video essays to tell the story of how the Marcellus Shale gas boom is impacting communities in northeastern Pennsylvania. Students visited communities impacted by the gas boom to conduct interviews and capture video footage that would help them tell the story of the local contexts in which the gas boom is taking place across the state.

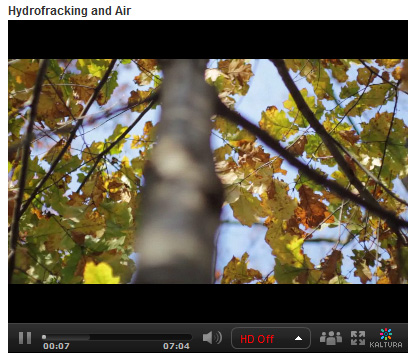
In addition to other research methods, the teams of students used GIS to explore the spatial footprint of the gas boom on different communities. Students were tasked with integrating the spatial aspect of the story into their video essays. The clip below is taken from the ‘Hydrofracking & Air’ video created by students Zoe Gaston, Claire Rapp, Sarah Baker, Thuyvan Luu, Colin Lind and Kyle Montgomery – all first-year students in Bucknell’s Environmental Residential College.

video platform video management video solutions video player

To create the map animation seen in the video, the students worked with me to visualize GIS data in ArcMap and export the data to a GoogleEarth KML format. Next, the students used GoogleEarth to draw the estimated pathway of the pipeline connecting several air compressor stations in their area of interest. Then the students created an animation in GoogleEarth that was spliced into the video essay to illustrate the point they were trying to make about air pollution associated with natural gas infrastructure. By the way… in a few months Bucknell GIS expects to have data on all infrastructure related to natural gas and electricity generation in Pennsylvania – including pipelines and transmission lines (so that next time we’ll be able to be more precise than we were with the ‘connect the dot’ approach we employed in this video).

Click here to see the full-length ‘Hydrofracking & Air’ video and other videos submitted by students in the class.


Categories
Bucknell/Local Interest Digital Humanities General GIS Slideshow

Save the date – Bucknell’s GIS in Higher Education Conference 11/16-11/18/12

Bucknell will be hosting a GIS in higher education conference from Friday, Nov. 16th through Sunday, Nov. 18th. The conference will focus on sharing ideas and examples of integrating GIS into teaching and research in the higher ed curriculum as well as opportunities for sharing research datasets and web map apps.  Target audience includes faculty, GIS specialists and students. Stay tuned for details on keynote speaker, session topics and how to submit papers & maps.