Categories
Bucknell/Local Interest Digital Humanities Events/Calendar GIS & Environmental Justice GIS by Academic Discipline GIS in Art GIS in Biology GIS in Computer Science GIS in Economics GIS in Engineering GIS in Environmental Studies GIS in Film Studies GIS in Geography GIS in Geology GIS in History GIS in Humanities GIS in Political Science GIS in Psychology GIS in Public Health GIS in Social Science GIS in Sociology GIS in Women's Studies GIScience, Pedagogy & Spatial Thinking Slideshow

Register & Submit Presentations for Bucknell-hosted GIS conference

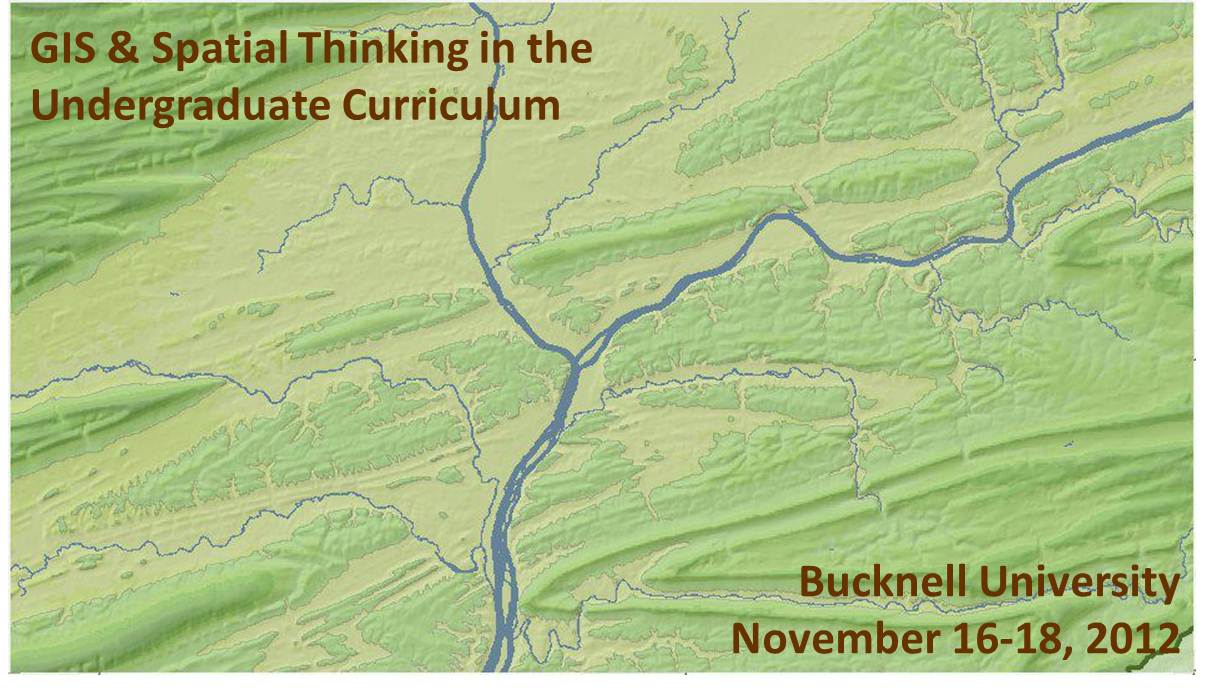
We recently launched the conference website for the upcoming Bucknell-hosted conference GIS & Spatial Thinking in the Undergraduate Curriculum.  Basic info is shown below, but please check out the conference website for details and updates as they become available.

About the Conference:

  • When: November 16-18, 2012
  • Where: Bucknell University, Lewisburg, PA. Click here for a map.
  • Details: Click on the pages shown on the menu above to access information onregistrationlodging, conference schedule, and submitting presentations and maps.
  • Deadlines:  Deadline for early bird registration is September 15, 2012. Deadline forsubmitting presentations and maps is September 21, 2012.
  • Format:  We have chosen a work-group format for the conference in order to maximize opportunities for discussion and brain-storming amongst participants. The main day of the conference will feature five work-group sessions. Each session will consist of 45 minutes of presentations and 45 minutes of open discussion organized around a theme. We are seeking 3 presenters and 1 chairperson for each of the 5 sessions. See the submissions page for a detailed description of each of the session topics:
    • 1a (Concurrent with 1b) – Mapping Human Activity – Qualitative Analysis GIS
    • 1b (Concurrent with 1a) – Quantitative Analysis & Technical Applications of GIS
    • 2   (Single group) – GIS in Pedagogy
    • 3a (Concurrent with 3b) – GIS in Community Outreach & Service Learning
    • 3b (Concurrent with 3a) – Software & Data Issues in GIS Instruction
  • Goals: Desired outcomes include: (1) providing mutual support for imaginative and challenging applications of spatial technology in undergraduate education; (2) fostering potential collaborative efforts between and within participant schools, such as joint research initiatives and/or shared resources for data, web maps and teaching materials, and; (3) creating a regional community of faculty and GIS/IT staff to interact on a regular basis, share information, and exchange ideas about the priorities identified during the conference.

This event is sponsored by Library & Information Technology at Bucknell University. Should you have any questions, please contact Janine Glathar at jlg046@bucknell.edu or (570) 577-1990.


Categories
Data General GIS GIS in Environmental Studies GIS in Geography GIS in Humanities GIS in Political Science GIS in Public Health GIS in Sociology Map Apps Slideshow

3 global data visualization tools to use in your class

Last fall the World Bank launched a contest aimed at challenging web developers to create web-based tools using the data available through the World Bank’s Open Data Initiative. Click here to read an article from Programmable Web about the contest winners (excerpt below).

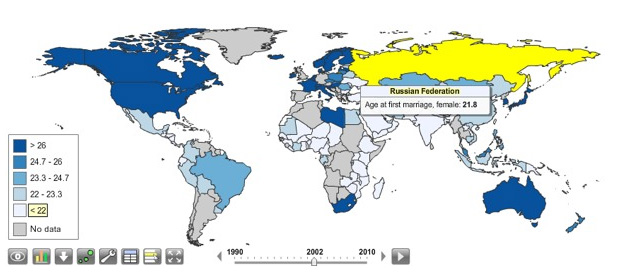
You can visualize nearly every indicator of economic, social and human development on StatPlanet World Bank, the winner of World Bank’s ambitious developer contest launched last October challenging new uses of the World Bank API. After voting from distinguished judges and the public, the organization announced the top three apps at an event in Washington, D.C., this afternoon.

StatPlanet is already a platform used by non-profits and other groups to map and visualize data. Its creator Frank van Cappelle said the application is aimed toward “evidence-based decision making.” For the World Bank contest, van Cappelle connected his platform to World Bank’s API. Where one of the challenges with World Bank’s data is how much of it there is, StatPlanet does a great job of helping users zero in on and visualize what interests them.

StatPlanet enables users to visualize global development indicators via customizeable maps and charts – and also provides a data download tool.  StatPlanet could be used in combination with WorldMapper and Gapminder – two other web-based global data visualization tools – for in-class demos and/or as a resource for student projects.  Click here to go to the StatPlanet main landing page or here to go directly to the tool.

Categories
Crisis-Mapping Environment General GIS GIS in Political Science Slideshow

Using G.I.S. to Help Analyze and Visualize Disasters

Guest post by Michael Grasso, Environmental Studies ’13

G.I.S. has an extremely large variety of applications. With G.I.S. one could map an area affected by a natural disaster in order to analyze the extent of the damage, the value of the property damaged, and how different areas were affected differently. G.I.S. can even be used just to help someone visualize the totality of the damage that occurred.

One such disaster that has been mapped was the F5 tornado that ravaged Joplin, Missouri on May 23, 2011. There are many different maps that are available to the public that can used for different applications.

This link is a google map created using G.I.S. that one could use to assess what property was damaged or completely destroyed. It also labels different areas based on an average amount of damage as well as marking where the tornado begins, changes in intensity and direction, and when it dissipates.


This link is primarily to help someone visualize the affects of the tornado. This map was created using G.I.S. and is basically a before and after picture where you can zoom into different areas.
http://gis.wustl.edu/Joplin.HTML


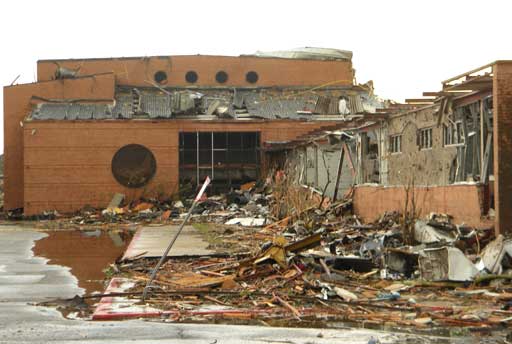
This is a picture of the Joplin High School after the tornado’s destruction


Categories
Crisis-Mapping Events/Calendar General GIS GIS in Political Science Slideshow Videos

Where 2.0

The 2011 Where 2.0 conference is wrapping up today in Santa Clara, CA.  Over the course of the week, many of the presentations have been streamed live over the conference website. I’m including a few YouTube videos for some of noteworthy presentations.

Jack Dangermond – CEO and founder of Esri: “Living Maps – Making Collective Geographic Information a Reality”

httpv://www.youtube.com/watch?v=vIbGwY3aG0g&p=0B2FEB8AACD826BE


Blaise Agüera y Arcas, Architect of Bing Maps and MSN at Microsoft:  “Read/Write World”

httpv://www.youtube.com/watch?v=4X9u4JG9H6E&p=0B2FEB8AACD826BE


Ben Fry – principal of Fathom: “Mapping: From Interesting to Insightful to Irrelevant” (coming soon)


Patrick Meier, Director of Crisis Mapping & New Media for Ushahidi: “May the Crowd Be With You: The Future of Crisis Mapping for Disaster Response”

httpv://www.youtube.com/watch?v=M_NguESRZ4g&p=0B2FEB8AACD826BE


Dennis Crowley, Co-founder, foursquare; and Robert Scoble, Managing Director, Rackspace: “Future Location: Scoble & Dens”

httpv://www.youtube.com/watch?v=TpTDGeLiFnc&p=0B2FEB8AACD826BE


John Barratt, self-described “Geo, twitter & weather web hacker”:  “Who, What, Where, When: Creating New Maps from Geo-tweets”

httpv://www.youtube.com/watch?v=ey_m0F_b-Vw&p=0B2FEB8AACD826BE


Sylvain Carle, CEO & co-founder @ Needium: “Locking Yourself Out in London (and Tweeting about it)

httpv://www.youtube.com/watch?v=Gvcs4H_A0Wc&feature=autoplay&list=PL0B2FEB8AACD826BE&index=16&playnext=1


Categories
Crisis-Mapping General GIS GIS in Political Science Map Apps Slideshow

NPR Story on Crisis Mapping in Japan

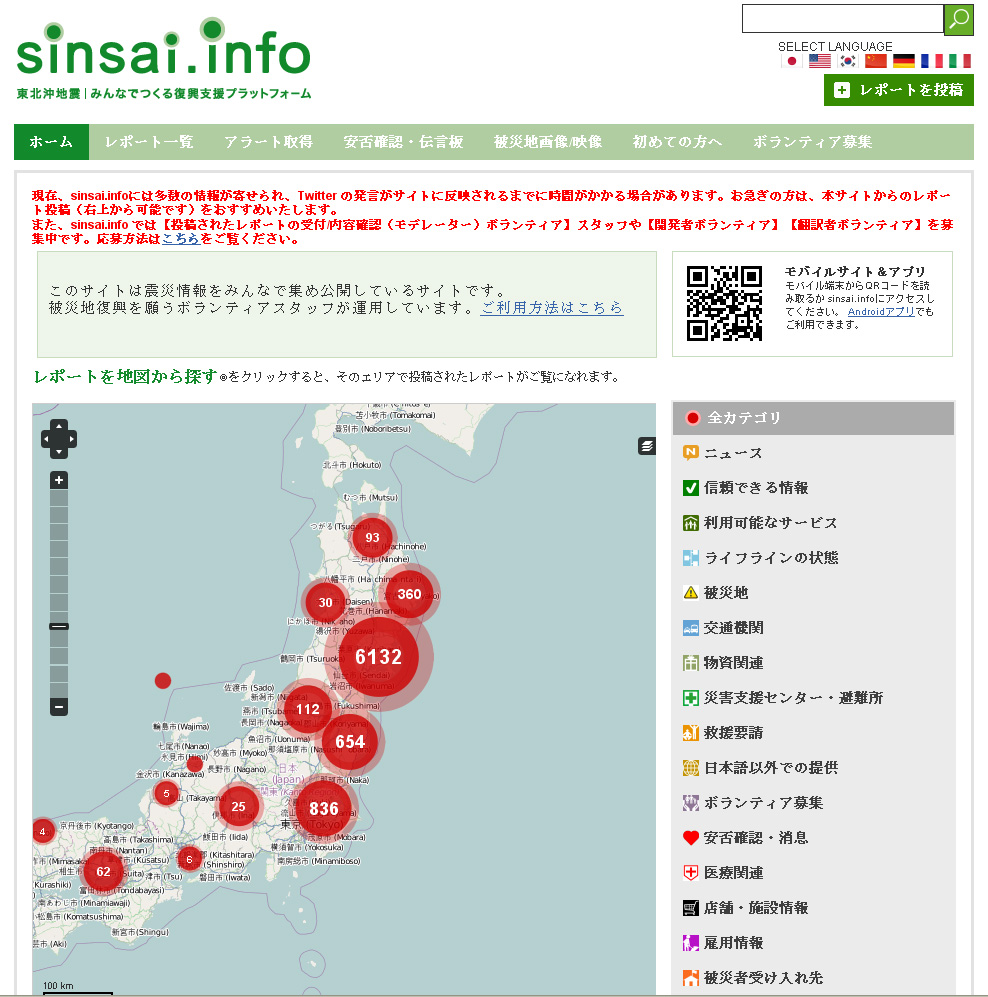
Last week NPR ran a story on crisis mapping in Japan – focusing on the open-source, citizen-driven Sinsai.info website. Here’s the description from the NPR website:

Open source software called Ushahidi allows people to add and update information to maps that anyone with an Internet connection can access. In Tokyo, a crew of volunteers is using the software to map everything — from health services to the location of emergency aid workers — in Japan’s hardest hit areas. Patrick Meier, director of the crisis mapping segment of Ushahidi, says that because of the robust Internet infrastructure in Japan and tech-savvy citizenry, online crisis mapping is being utilized to its fullest potential.

Click here to hear the NPR audio clip. Thanks to Deb for the heads up about this story!