Categories
Crisis-Mapping Events/Calendar General GIS GIS in Political Science Slideshow Videos

Where 2.0

The 2011 Where 2.0 conference is wrapping up today in Santa Clara, CA.  Over the course of the week, many of the presentations have been streamed live over the conference website. I’m including a few YouTube videos for some of noteworthy presentations.

Jack Dangermond – CEO and founder of Esri: “Living Maps – Making Collective Geographic Information a Reality”

httpv://www.youtube.com/watch?v=vIbGwY3aG0g&p=0B2FEB8AACD826BE


Blaise Agüera y Arcas, Architect of Bing Maps and MSN at Microsoft:  “Read/Write World”

httpv://www.youtube.com/watch?v=4X9u4JG9H6E&p=0B2FEB8AACD826BE


Ben Fry – principal of Fathom: “Mapping: From Interesting to Insightful to Irrelevant” (coming soon)


Patrick Meier, Director of Crisis Mapping & New Media for Ushahidi: “May the Crowd Be With You: The Future of Crisis Mapping for Disaster Response”

httpv://www.youtube.com/watch?v=M_NguESRZ4g&p=0B2FEB8AACD826BE


Dennis Crowley, Co-founder, foursquare; and Robert Scoble, Managing Director, Rackspace: “Future Location: Scoble & Dens”

httpv://www.youtube.com/watch?v=TpTDGeLiFnc&p=0B2FEB8AACD826BE


John Barratt, self-described “Geo, twitter & weather web hacker”:  “Who, What, Where, When: Creating New Maps from Geo-tweets”

httpv://www.youtube.com/watch?v=ey_m0F_b-Vw&p=0B2FEB8AACD826BE


Sylvain Carle, CEO & co-founder @ Needium: “Locking Yourself Out in London (and Tweeting about it)

httpv://www.youtube.com/watch?v=Gvcs4H_A0Wc&feature=autoplay&list=PL0B2FEB8AACD826BE&index=16&playnext=1


Categories
Crisis-Mapping General GIS GIS in Political Science Slideshow

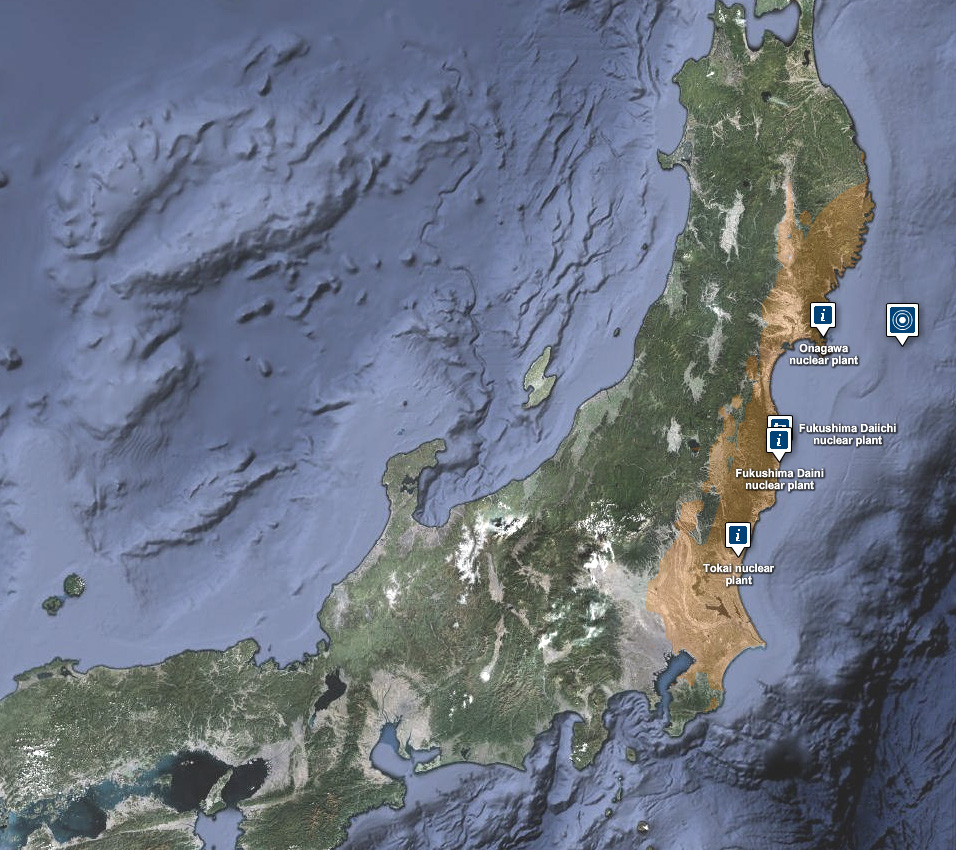
Japanese earthquake – disaster/response maps

Here are some links to maps and map apps related to the Japanese earthquake and tsunami.  I’ll add more as they are released.

  • JapanQuakeMap, an animated, time-lapse visualization of the earthquake and its aftershocks created by Paul Nicholls, developer of the Christchurch Quake Map website.  From the website:
    The Japan Quake Map on this website pesents a time-lapse visualisation of the Sendai earthquake and its aftershocks, primarily to help those outside the affected area understand what the people of Japan are experiencing. It plots earthquake data from USGS on a map using the Google Maps API, with the size of the circle denoting the magnitude (the higher the magnitude, the larger the circle) and the colour showing the focal depth (see the legend below the map).
  • Click here to view the main page for Ushahidi’s Japan crisis mapping tool (in Japanese). Click here to view the Big Map. These pages use the Ushiadi platform to collect and display crowdsourced info (SMS, e-mail, Twitter, Flickr, YouTube, etc.). About the Ushahidi site:

Anyone on the ground can text in the location of a trapped person, and these locations are then collected on a map. You can also text in where to find aid, a pop-up hospital or a precarious building that should be avoided.  Good.is

  • Also from Ushahidi, a Radiation Map that uses the Crowdmap platform.  The radiation map is in both Russian and English and has other language options available.
  • Map of seismic activity in the 7 days leading up to the earthquake – from MapLarge (note: as of Wed. March 16th the MapLarge site is down – too much traffic?)
  • What is crisis mapping and how does it work? Click here to read Patrick Meier’s answer to that. Meier is the Director of Crisis Mapping at Ushahidi and co-founder of the International Network of Crisis Mappers. 
Categories
Bucknell/Local Interest General GIS

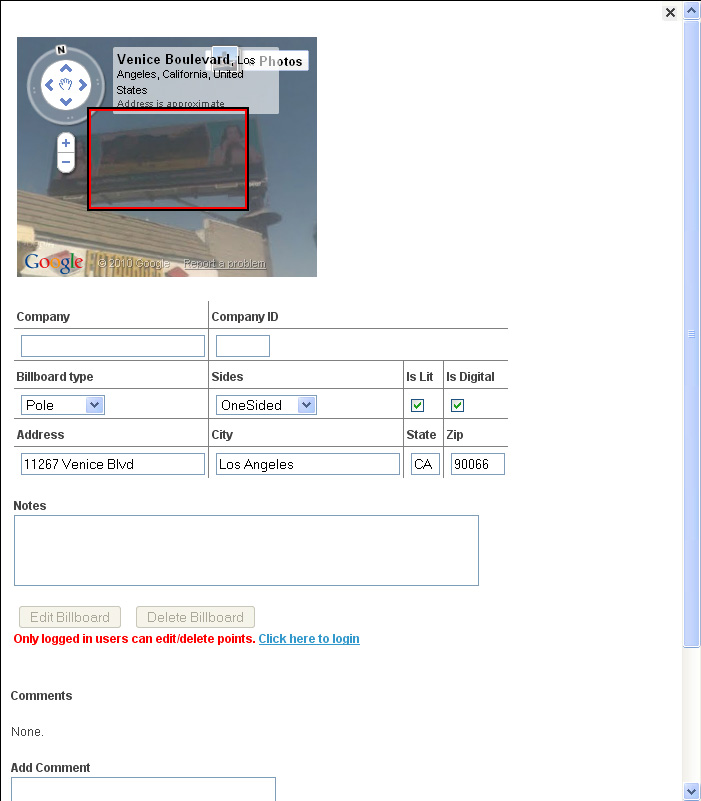
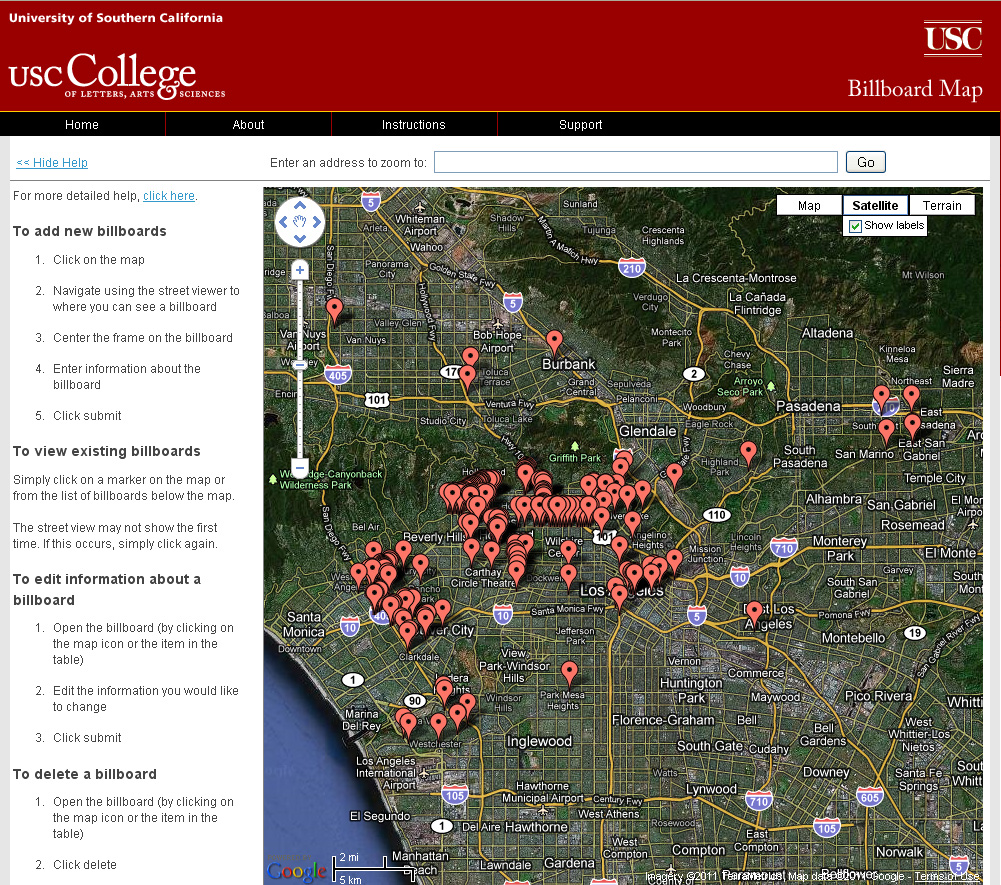
USC student uses crowdsourcing to map billboard locations

From Directions Magazine’s All Points Blog,  “A Ph.D. Candidate in spatial science at USC, Elisabeth Sedano, has developed a Website that tracks and maps the visual eyesores in hopes of creating LA’s first database of billboard locations. The project uses crowdsourcing to capture the data.”