New social media mapping sites are popping up all over the place these days – whether it’s crisis-mapping sites like Sinsai.info or this new ‘happiness’ map from PhD student Alex Davies.
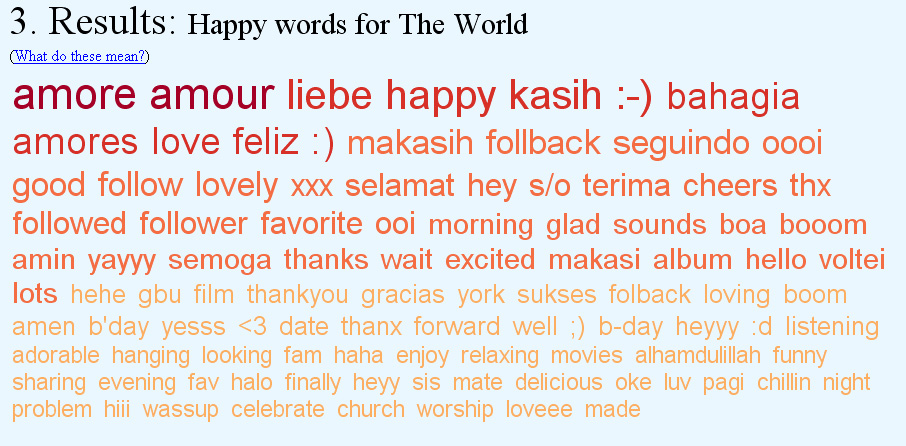
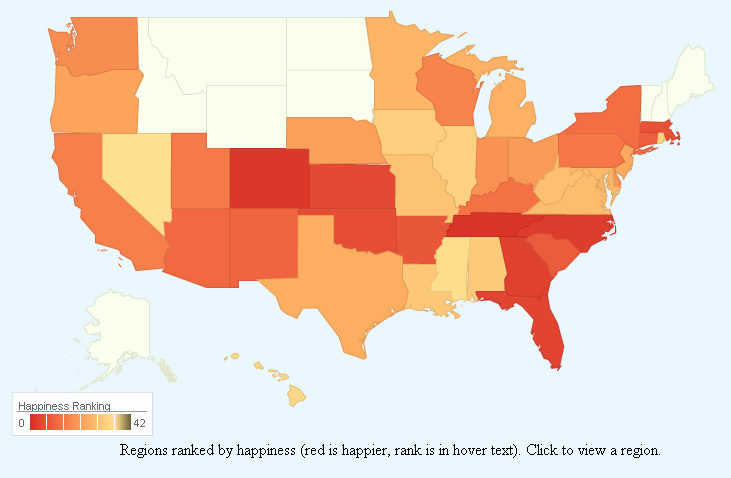
Davies, a PhD student at the University of Cambridge’s Computational and Biological Learning Lab, created a statistical model to analyze the sentiment (happy or sad) of Tweets from around the world. In Davies’ model, individual words within Tweets were correlated with happiness or sadness, then used to predict the overall sentiment of the Tweet. Tweets were geo-tagged and summarized by area to calculate a composite ‘happiness’ ranking for states within the U.S. and for countries worldwide. The results are presented on Davies’ website in an interactive web map app. Raw data from the Tweets is presented alongside the maps to give viewers a sense of which Tweet words were correlated with happiness or sadness. See below for maps of US happiness and world happiness – and an image showing some of the worldwide ‘happy’ words.
Happiness map of the United States:
Happiness map of the world:

Happy words for the world: