Here’s a new visualization that shows the locations worldwide that are submitting reports to the Ushahidi Japan Crisis Map. Click on the map to see full size image.
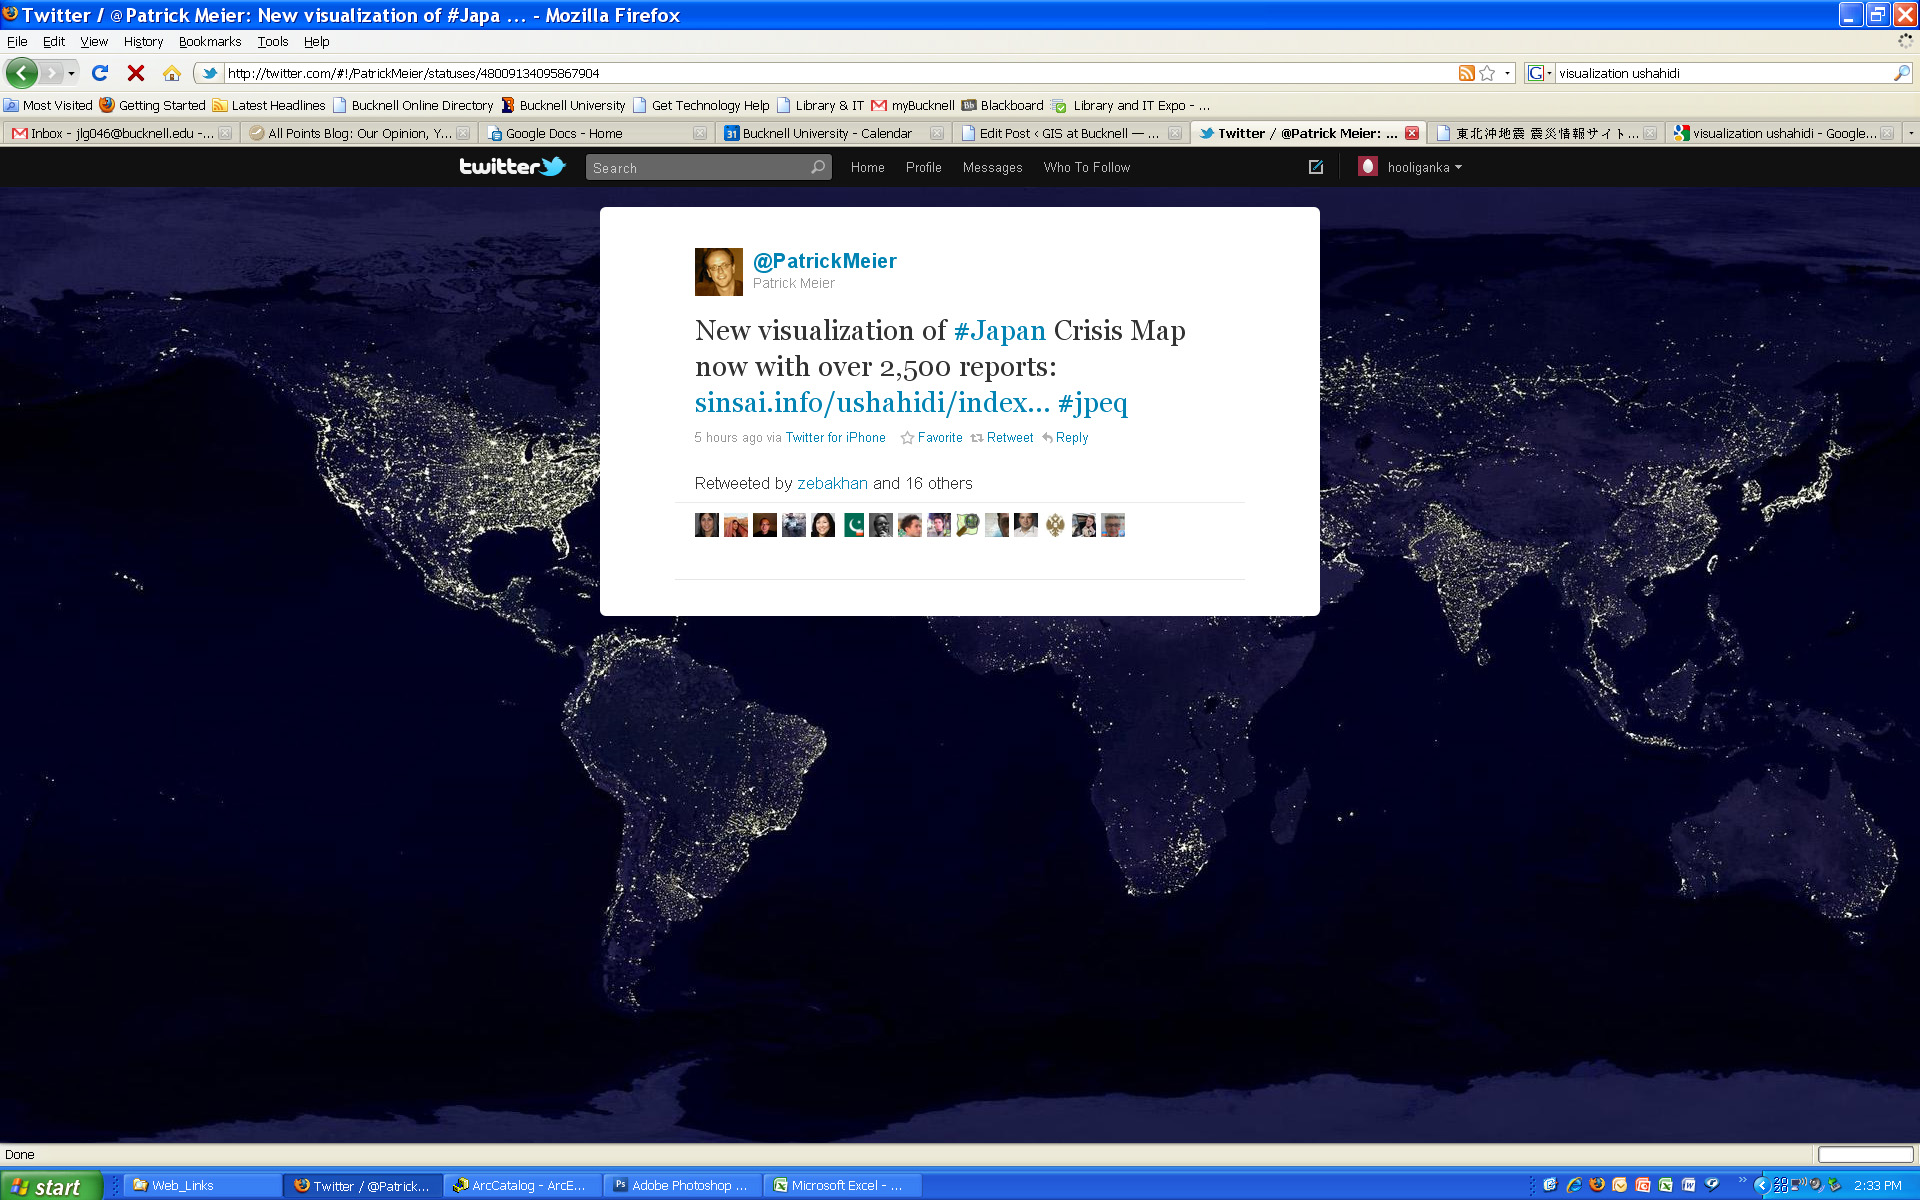
Here’s a new visualization that shows the locations worldwide that are submitting reports to the Ushahidi Japan Crisis Map. Click on the map to see full size image.
Janine Glathar joined the Digital Pedagogy & Scholarship team in 2009 to fill the newly-created role of GIS Specialist at Bucknell. She has worked in the field of geospatial technologies for more than 15 years as research specialist, technical analyst and software trainer. Prior to joining L&IT at Bucknell, Janine spent seven years doing applied GIS research in Philadelphia’s non-profit social services sector as the GIS Senior Analyst for Philadelphia Safe & Sound and the Greater Philadelphia Urban Affairs Coalition. Before transitioning to the social services research world, Janine worked for the GIS software company ESRI as a trainer and education/non-profit coordinator. She earned a B.A. in European History and Russian Language/Literature at the University of Pennsylvania. If you ask Janine where she’s from, she’ll tell you she’s a Navy brat and will probably offer to show you a map of all of the various places she’s lived over the years.
Areas of expertise:
ArcGIS, Digital Pedagogy, Digital Scholarship, GIS, Google Earth, Spatial Thinking