Categories
Bucknell/Local Interest Digital Humanities Environment General GIS GIS in Computer Science GIS in Environmental Studies GIS in Geography GIS in Geology GIS in Public Health GIS in Sociology Slideshow

From the Yale Daily News… “Map on, Maples!”

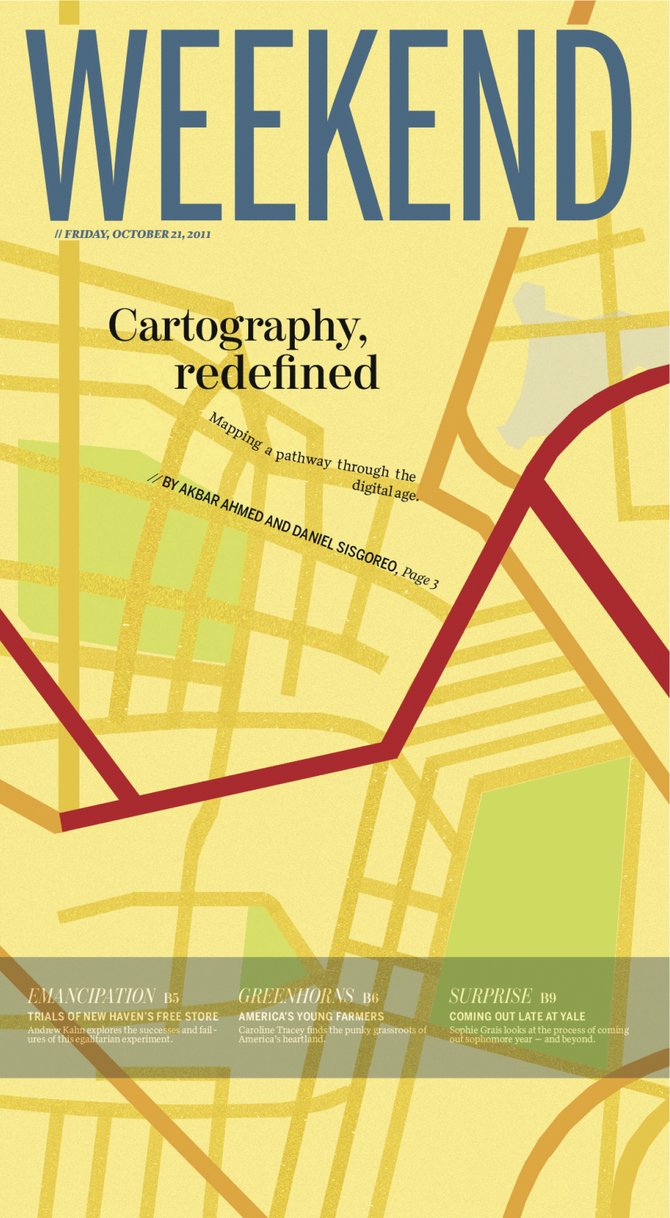
The Yale Daily News has a great article about the role that the GIS Specialist, Stace Maples, plays on campus. Maples, a fellow ESRI T3G Institute alum from summer 2010, works with faculty and students on integrating GIS into teaching and research at Yale and…

… he is in high demand. Working in the three-person Map Department, a department within the Yale University Library, he trains students and faculty in the use of the arcane computer program. He helps professors in areas from history to public health, in such projects as diverse as mapping correspondence networks and placing photographic collections in a geological context. He is adamant that geographical data is relevant to all academic endeavors.

“Everything is somewhere, and that somewhere matters,” Maples declared.

Although I take issue with the reporter’s use of the word ‘arcane’ to describe GIS software, I’ll second Stace’s assessment that location matters (or, as the Geospatial Revolution team at Penn State put it, “the location of anything is becoming everything“).  In a statement that is sure to resonate with faculty, Peter Bol, the director of the Center for Geographic Analysis at Harvard University, is quoted in the article as saying that:

 “If you want to publish competitive research today, you have to have GIS.”

That might be a bit of an overstatement (for the moment, at least), but there’s no doubt that incorporating GIS and spatial analysis is increasingly becoming an expectation in academic research, much in the same way as it has become part of the fabric of our everyday lives.  Dana Tomlin – who is… a visiting faculty member in the Yale School of Forestry, co-director of the Cartographic Modeling Laboratory at the University of Pennsylvania, a GIS Hall of Fame-r, the creator of map algebra, and, incidentally, the grad school professor who got me hooked on GIS (thanks, Dana!), sums it up this way:

“With the advent of web mapping services like Google Earth and Bing, the ability to sense geographical position in real time via the Global Positioning System (GPS), and the opportunity to place this sort of magic quite literally into the hands of anyone with a smart phone, there is no question that the world at large is already well beyond the point of no return in terms of making routine use of geographical data in digital form.”

GIS has existed as a computing technology since the 1960’s, but until the mid to late 1990’s it was largely the domain of highly-trained specialists working from high-powered servers. GIS software and web-based map apps have become increasingly faster, more powerful and more user-friendly over the last 20 years. If those trends continue, and if we do our jobs well, Stace and I might very well work ourselves out of a job:

It is conceivable that GIS might one day become as ubiquitous within academia as Google Maps is within the broader population. If departments integrate GIS into their own teaching, the role that Maples and other specialists play is likely to diminish. Graduate students in fields employing GIS are expected to understand the program and its functionalities… Meanwhile, academics who only rarely use GIS might consult specialists if and when necessary, while remaining blissfully oblivious of the program’s nitty-gritty.

Today’s graduate students are tomorrow’s professors. And, if the trends hold true, at least a significant proportion of them will soon be using GIS technology to gain deeper insight into diverse fields of study for decades to come. So map on, Maples.

Click here to read the full story and learn more about how Yale faculty and students are using GIS to study history, archaeology, linguistics, environmental studies, forestry, public health and other topics.
 

Categories
Bucknell/Local Interest General GIS GIS in Film Studies Slideshow Videos

Mapping wheel-chair access at Bucknell

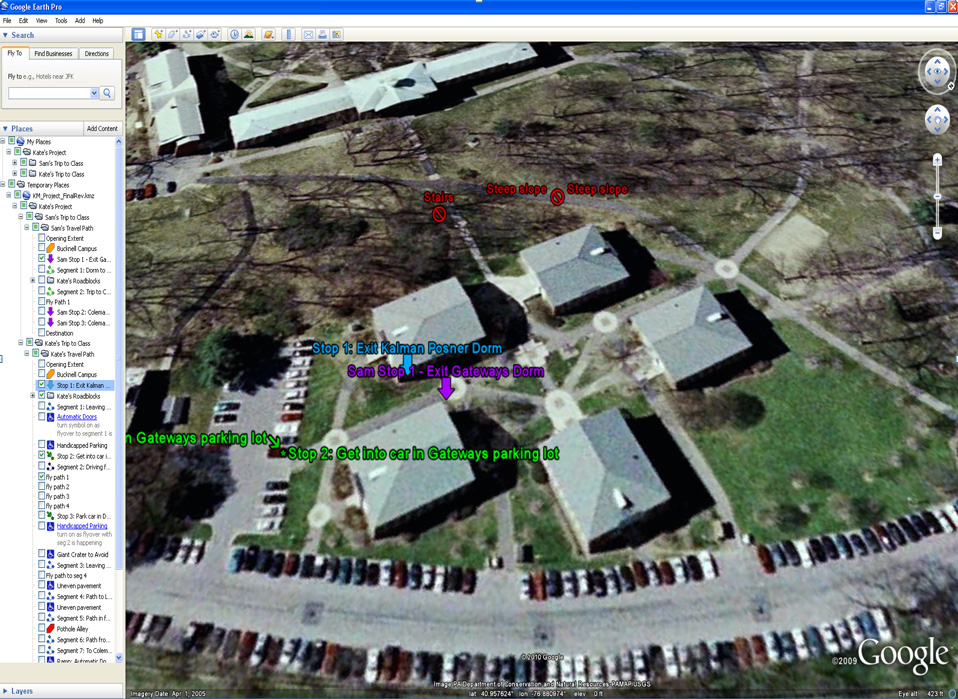
In spring 2010, Bucknell student Kate Matelan, ’10  worked with film professor Eric Faden to produce a documentary film focused on her experiences as a disabled student on campus.  To illustrate the differences between navigating the Bucknell campus in a wheelchair vs. on foot, Kate and I developed a GoogleEarth project with placemarks and travel paths to mark and annotate both her route and an able-bodied student’s route to a class held in Coleman 221.

In the film a 4-panel split screen (aka ’24’ style) approach was used to simultaneously present a GoogleEarth fly-over of each student’s travel path synced to video footage of the students describing the course of their daily trip to Coleman 221. See video excerpt and screenshot from GoogleEarth project below. I’ll make the KML file available as soon as I can figure how to to do that on WordPress.


Video Platform Video Management Video Solutions Video Player

Note: video footage was shot using several cameras including the GoPro Hero and Kodak Zi8. Editing was done in Final Cut Pro.

Categories
Bucknell/Local Interest General GIS GIS in Women's Studies Map Apps Slideshow

Simple tool for creating KML-based thematic maps

As someone who has one foot in the ArcGIS world and another in the GoogleEarth/GoogleMaps world, I’m continually annoyed at how cumbersome it is to shuffle data back and forth between the two product lines.  I’ll skip the diatribe for now and instead just point out a cool new tool that I ran across last week when I was getting ready to talk to a Women’s Studies class that will be using GoogleMaps for a class project.

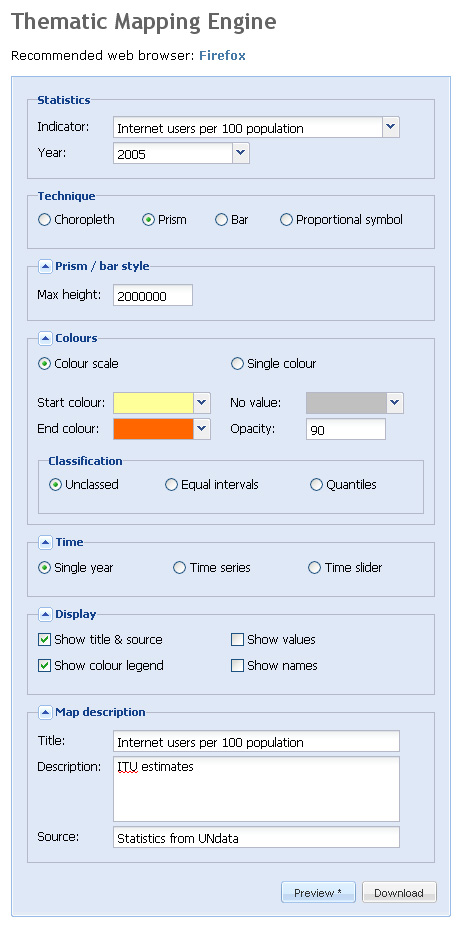
The website, thematicmapping.org, features a blog with tips and tricks for creating KML-based thematic maps. But more importantly, it provides a tool that you can use to create KML-based thematic maps for a variety of global data indicators. Although the selection of indicators is rather limited, thematicmapping.org also makes its API available so that you can create thematic maps from your own data sources.  Now if I just had a programmer at my beck and call…

Below is a screen shot of the Thematic Mapping Engine interface along with a snapshot of the resulting KML file


Categories
Bucknell/Local Interest Data Environment General GIS Map Apps Slideshow

ChesapeakeView

Maurie Kelly and her team at PASDA (part of the Penn State Institute of Energy and the Environment) have just released ChesapeakeView, a website that provides free access to remotely sensed data about the Chesapeake Bay region. The website currently holds 263 datasets related to the Chesapeake Bay region – including remotely sensed data as well as habitat, land use, biodiversity, wildlife distribution, historical aerial photos, agricultural imagery, digital coastline images and other types of environmental data related to the region.

“No simple place existed to find remote sensing information about land use, habitat changes and biodiversity,” said Maurie Caitlin Kelly, director of informatics, Penn State Institutes of Energy and the Environment. “Researchers could spend days searching to find whatever data might be available.”

The data interface for ChesapeakeView will look familiar to anyone who has used PASDA’s website.  There are options for downloading the data via FTP, using an internet based data viewer/map tool or streaming it directly into your ArcMap session. ChesapeakeView is part of the AmericaView initiative.

Categories
Bucknell/Local Interest Environment General GIS Map Apps Videos

WikiWatershed – Model My Watershed

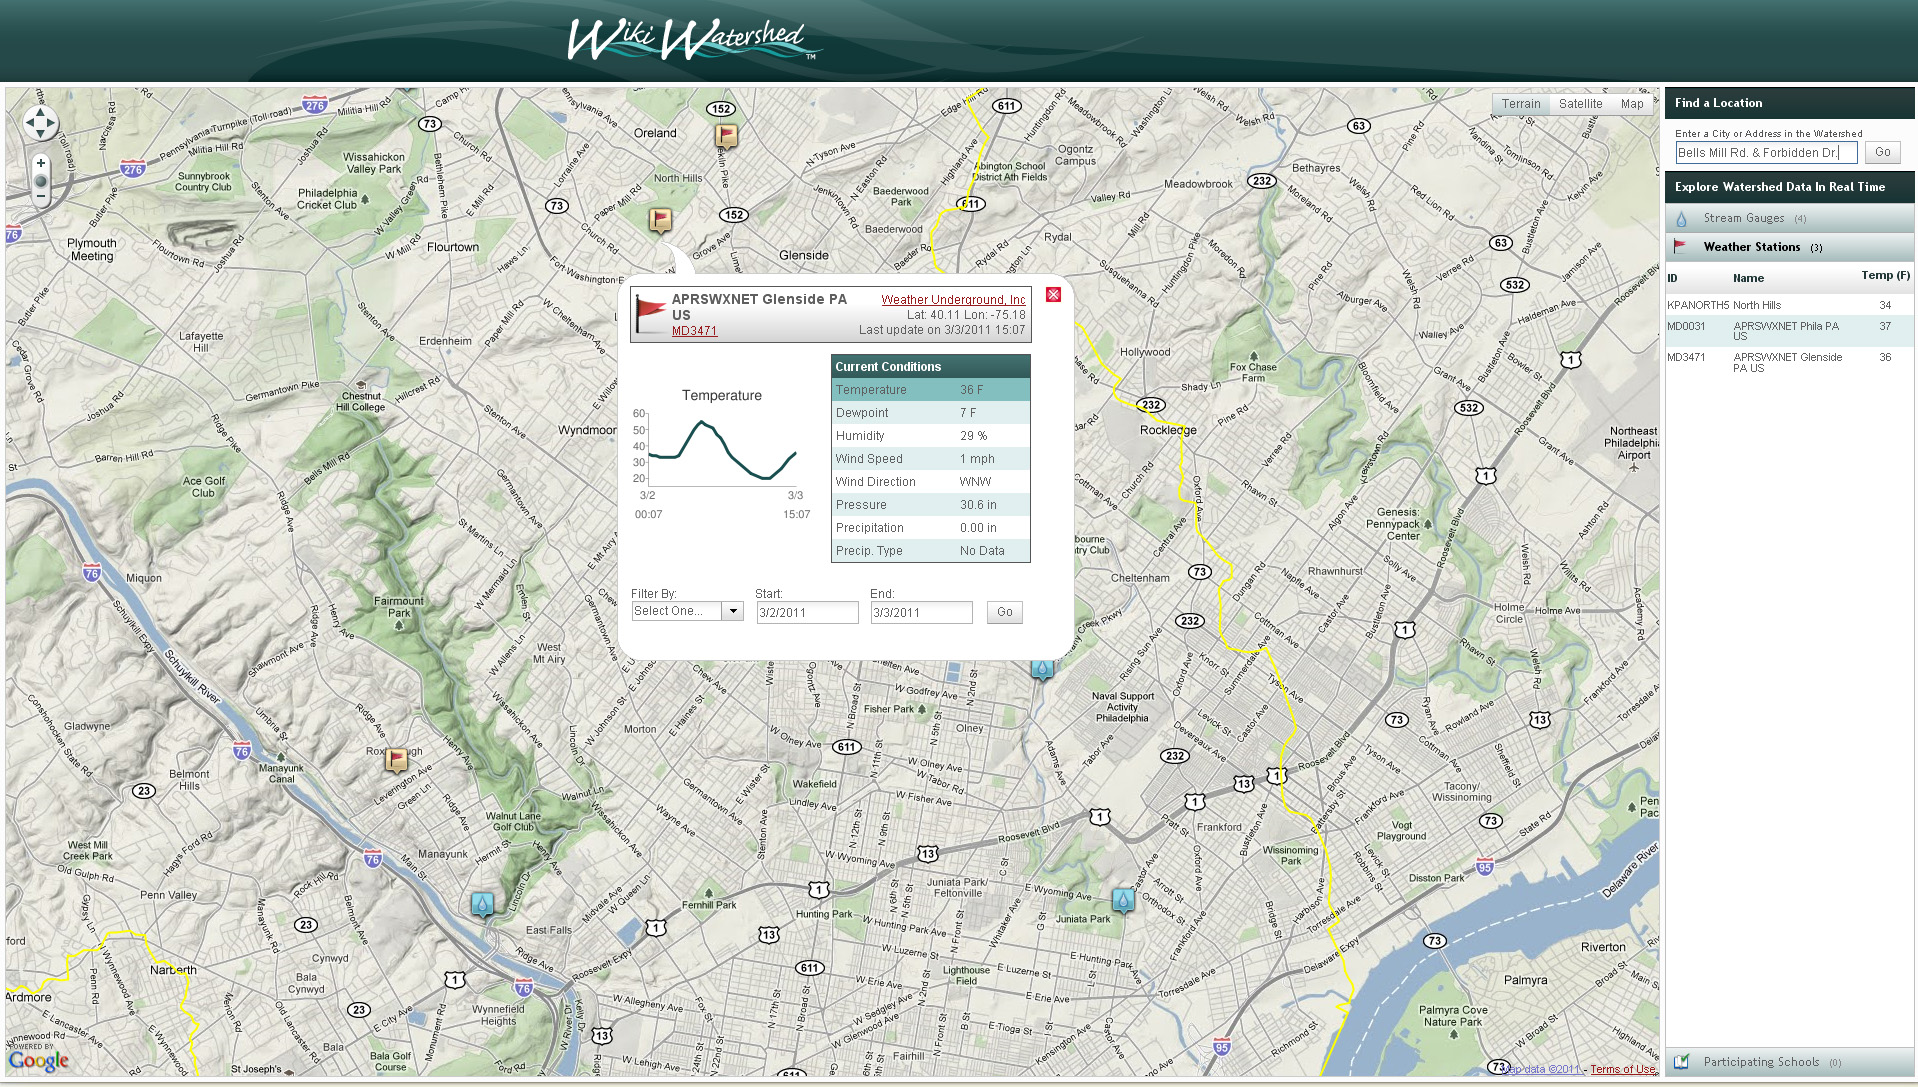
WikiWatershed is another exciting project under development by the team at Azavea.  The project – a collaboration between the Stroud Water Research CenterAzavea, University of Pennsylvania’s Cartographic Modeling Lab and Millersville University –  features a suite of web-based mapping and analysis tools designed for use by students and concerned citizens in sharing information about the streams, rivers and natural resources in their watersheds.  The first component of WikiWatershed to be released is the Model My Watershed tool which allows for web-based modeling of stormwater:

This game-like simulaton will enable students to modify underlying environmental conditions and simulate how these changes to the ecosystem affect the hydrologic cycle in their local watersheds …[and will] will use the latest version of Azavea’s DecisionTree geoprocessing framework to provide high performance, scalable modeling capabilities.

From the Stroud Water Research Center website:

When fully developed, [WikiWatershed] will leverage open source software and will function as an open collaborative resource for the community, enabling users to share geographically-tagged data, photos, videos, comments, educational curricula, simulation models and other tools on streams and rivers. As “Wiki” implies, content will be primarily contributed, enhanced and maintained by the user community. The WikiWatershed™ web portal will link a database of watershed information to geo-tagged visual content viewable on Google Maps®/Earth®, Flickr®, Panoramio®, YouTube®, etc.

Click here to explore the WikiWatershed mapping application.