Categories
Bucknell/Local Interest General GIS Slideshow

Call for faculty interest in summer 2012 GIS workshops at Bucknell (revised)

As we have for the past two summers, Bucknell’s LIT division will offer a series of summer workshops for faculty interested in hands-on instruction in GIS. Stipends of $400 will be offered to faculty for participating in each workshop. Please fill out this interest/registration form as soon as possible if you are interested in any of the following workshops.

Overview

1. Introductory GIS workshop (4 days, 4 hours per day) – no prerequisites
Monday, August 6th-Thursday, August 9th from 9am-1pm (lunch included)
2. Using ArcHydro for Water Resources Analysis (3 days, 8 hours per day)*
Monday, August 13th-Wednesday, August 15th from 9am-1pm (lunch included)
3. Spatial Statistics with ArcGIS and Geoda (2 days, 8 hours on 1st day, 4 hours on 2nd day)*
Thursday, August 16th from 9am-4pm and Friday, August 17th from 9am-1pm (lunch included)

Details – Spatial Statistics with ArcGIS & Geoda

The workshop ‘Spatial Statistics with ArcGIS and Geoda’ will be taught by Professor Jennifer Miller, Assistant Professor in the Department of Geography & Environment and Director of the GIScience Center at University of Texas at Austin. Below is a tentative outline of the 3-day workshop. Faculty will have an opportunity to work with their own data for part of the last day of the workshop.

Day 1: Introduction to Spatial analysis and Point pattern analysis

  • 1st order vs 2nd order effects (density vs. distance)
  • Nearest neighbor analysis, Ripley’s K statistics
  • Interpreting results (z-scores, Monte Carlo simulation)

Day 2: (Global) Spatial pattern measurement and modeling

  • Spatial autocorrelation analysis
  • Conceptualizing spatial relationships
  • Moran’s I, Getis-Ord General G statistic
  • OLS Regression
  • Model fittingModel diagnostics
  • Residual analysis

Day 3: (Local) Spatial pattern measurement and modeling

  • Local spatial autocorrelation analysis
  • LISA, Gi* (Geoda software)Mapping/interpreting results
  • Geographically weighted regression
  • Spatial non-stationary

Details – Using ArcHydro for Water Resources Analysis

The workshop ‘Using ArcHydro for Water Resources Analysis’ is tentatively scheduled to be taught by Professor Venkatesh Merwade, Assistant Professor in the School of Civil Engineering at Purdue University and Director of the Geospatial Water Resources Institute.  We are close to finalizing details on this workshop, so stay tuned for details on who will teach the workshop. Below is a tentative outline of the 3-day workshop. Faculty will have an opportunity to work with their own data for part of the workshop.

  • ArcGIS Skills Review
  • Integrating Geospatial and Temporal Datasets for Hydrology
  • Raster and Vector Data in Hydrology
  • Terrain Analysis in ArcGIS (Hydrology Tools)
  • Terrain Processing Using ArcHydro
  • Developing SCS Curve Number Grid
  • HEC-GeoHMS Application
  • HEC-HMS Application
  • HEC GeoRAS Application
  • HEC-RAS Application
  • Building ArcHydro Network using NHD
  • Groundwater Tools in ArcGIS
Categories
Bucknell/Local Interest General GIS GIS in Women's Studies Map Apps Slideshow

Simple tool for creating KML-based thematic maps

As someone who has one foot in the ArcGIS world and another in the GoogleEarth/GoogleMaps world, I’m continually annoyed at how cumbersome it is to shuffle data back and forth between the two product lines.  I’ll skip the diatribe for now and instead just point out a cool new tool that I ran across last week when I was getting ready to talk to a Women’s Studies class that will be using GoogleMaps for a class project.

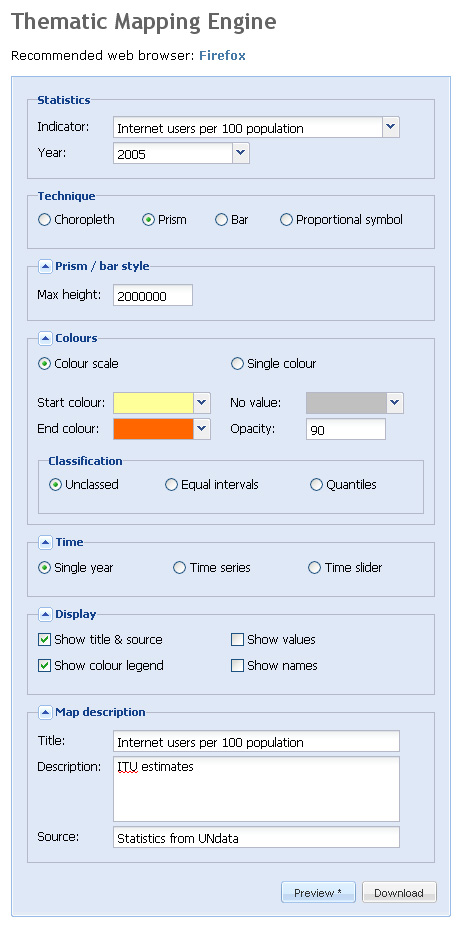
The website, thematicmapping.org, features a blog with tips and tricks for creating KML-based thematic maps. But more importantly, it provides a tool that you can use to create KML-based thematic maps for a variety of global data indicators. Although the selection of indicators is rather limited, thematicmapping.org also makes its API available so that you can create thematic maps from your own data sources.  Now if I just had a programmer at my beck and call…

Below is a screen shot of the Thematic Mapping Engine interface along with a snapshot of the resulting KML file


Categories
Bucknell/Local Interest Data Environment General GIS Map Apps Slideshow

ChesapeakeView

Maurie Kelly and her team at PASDA (part of the Penn State Institute of Energy and the Environment) have just released ChesapeakeView, a website that provides free access to remotely sensed data about the Chesapeake Bay region. The website currently holds 263 datasets related to the Chesapeake Bay region – including remotely sensed data as well as habitat, land use, biodiversity, wildlife distribution, historical aerial photos, agricultural imagery, digital coastline images and other types of environmental data related to the region.

“No simple place existed to find remote sensing information about land use, habitat changes and biodiversity,” said Maurie Caitlin Kelly, director of informatics, Penn State Institutes of Energy and the Environment. “Researchers could spend days searching to find whatever data might be available.”

The data interface for ChesapeakeView will look familiar to anyone who has used PASDA’s website.  There are options for downloading the data via FTP, using an internet based data viewer/map tool or streaming it directly into your ArcMap session. ChesapeakeView is part of the AmericaView initiative.

Categories
Bucknell/Local Interest General GIS GIS in Environmental Studies GIS in Geography Slideshow

Bucknell student uses ArcGIS in research on sleeping sickness

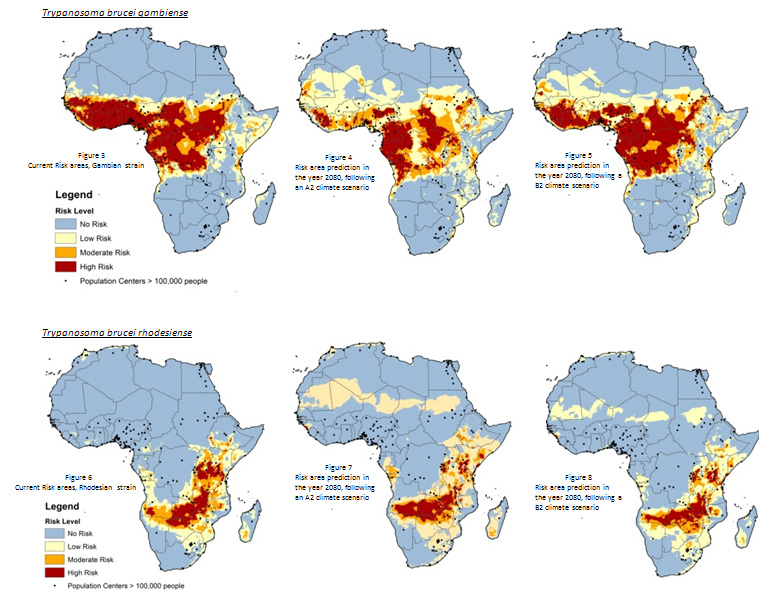
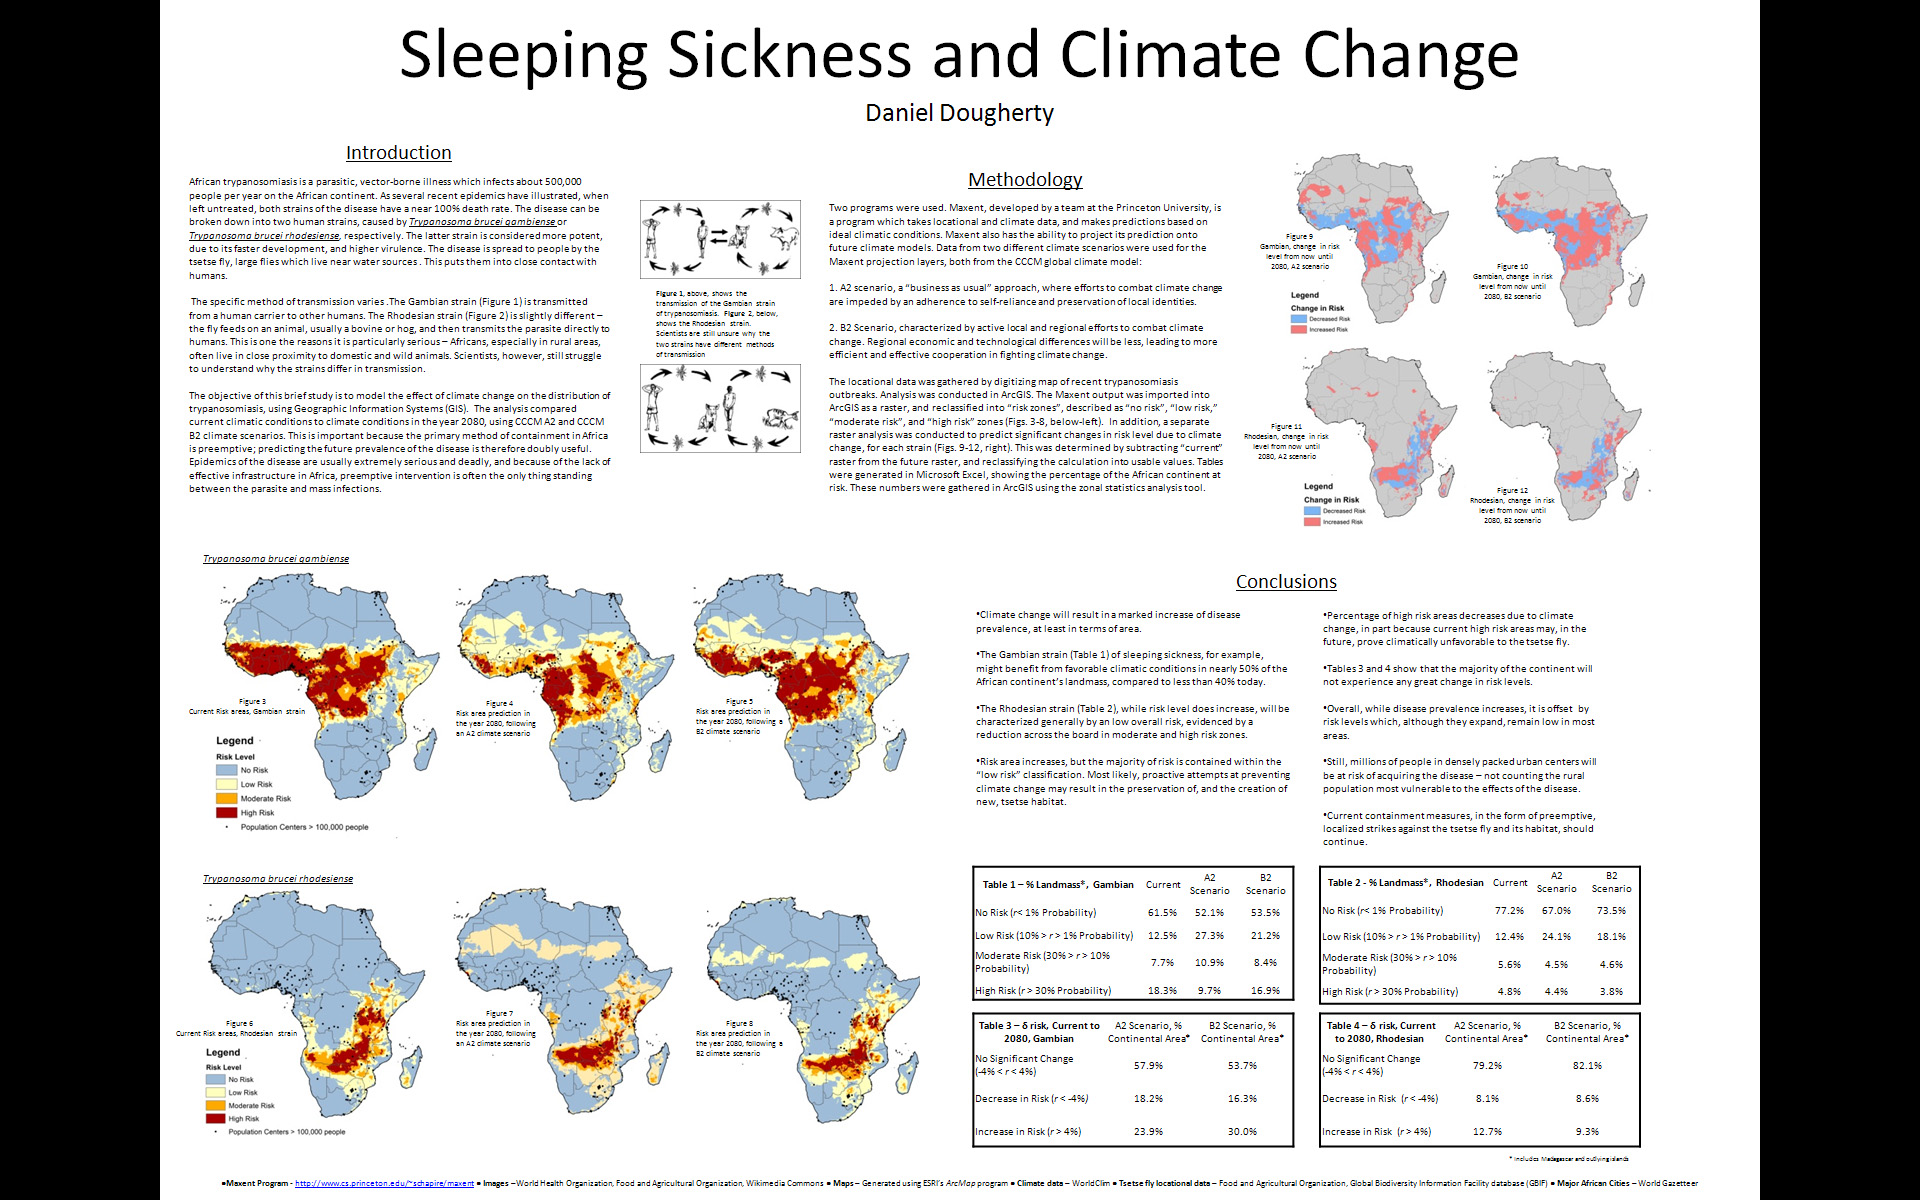
Below is an interview with Daniel Dougherty ’12, a History and Geography major, discussing his use of GIS for an analysis of the impact of climate change on sleeping sickness.  The research project was conducted as part of Prof. Duane Griffin’s Geography 204 course Applied GIS. In the interview, Dougherty describes the data and methodology he used for the project and talks about some of the conclusions he drew from his analysis.

httpv://www.youtube.com/watch?v=UsJf29_Mujw

The images below show some of the maps Dougherty was able to produce using ArcGIS, MaxEnt and data from WorldClim.

Categories
Data General GIS Map Apps Slideshow

Forecasting snow and finding supermarkets

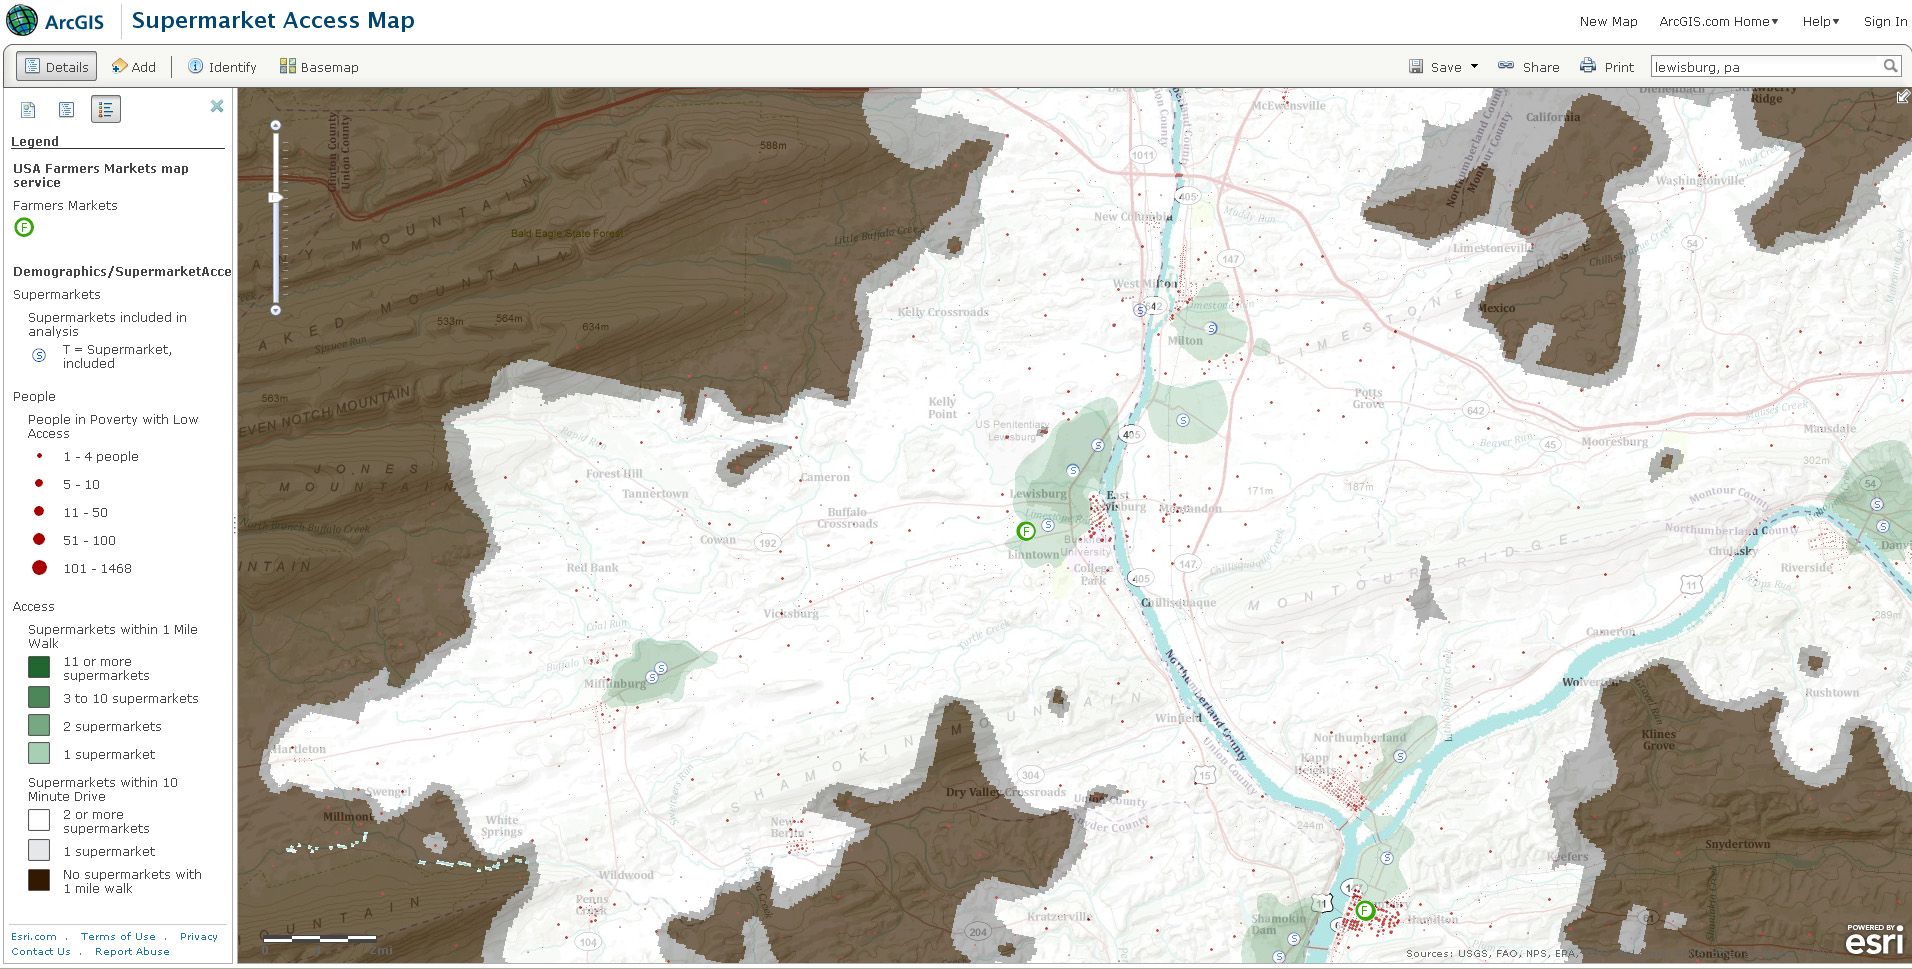
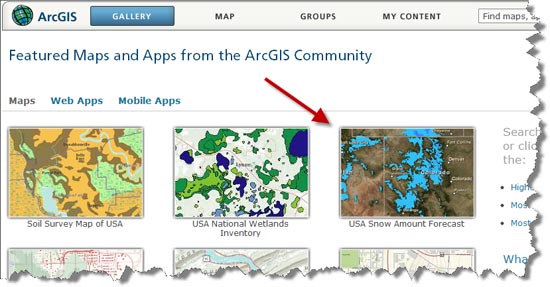
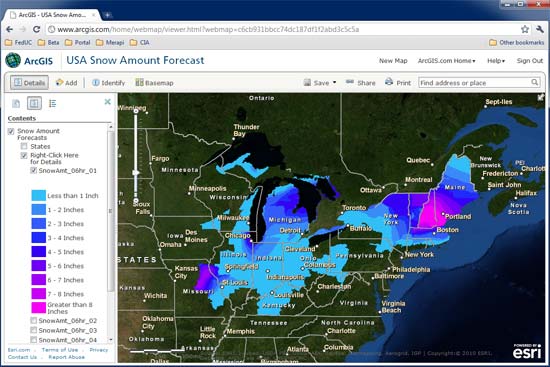
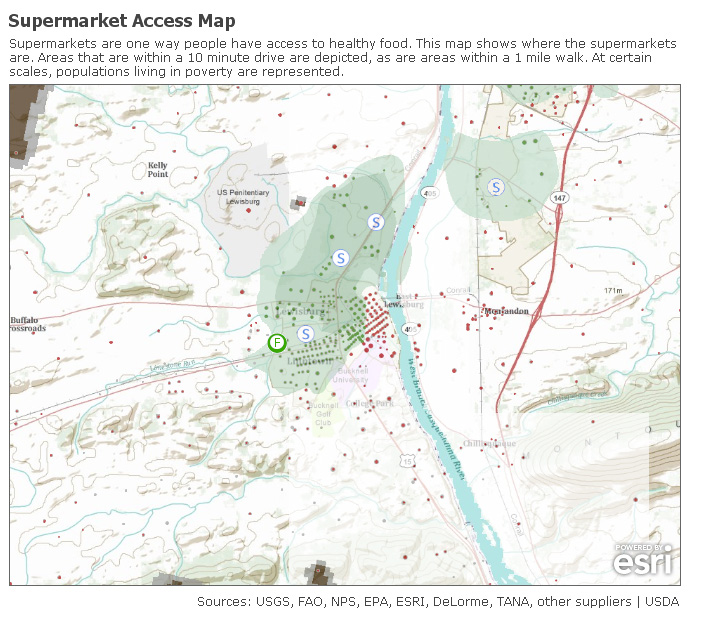
If you’re the type of person who loads up on bread and milk at the first hint of snowfall, then ArcGIS Online is your new best friend.  Using ArcGIS Online you can create a map showing projected snowfall amounts for your area along with the locations of nearby supermarkets. The ArcGIS Online Gallery has free basemaps that you can use to create quick and easy mash-ups online, stream directly into your ArcGIS map project, or (in many cases) download the raw data to use in whatever way you want. The basemaps shown below for snowfall forecasts and supermarket access are just two of the dozens of basemaps you can choose from in the ArcGIS Online Gallery.

View Larger Map

Read more about this on the ESRI ArcGIS Online blog.

ArcGIS Online Basemaps

Snowfall forecast map

Supermarket access in Lewisburg