Categories
Bucknell/Local Interest Data Environment General GIS Slideshow

New data available on Pennsylvania forest patches

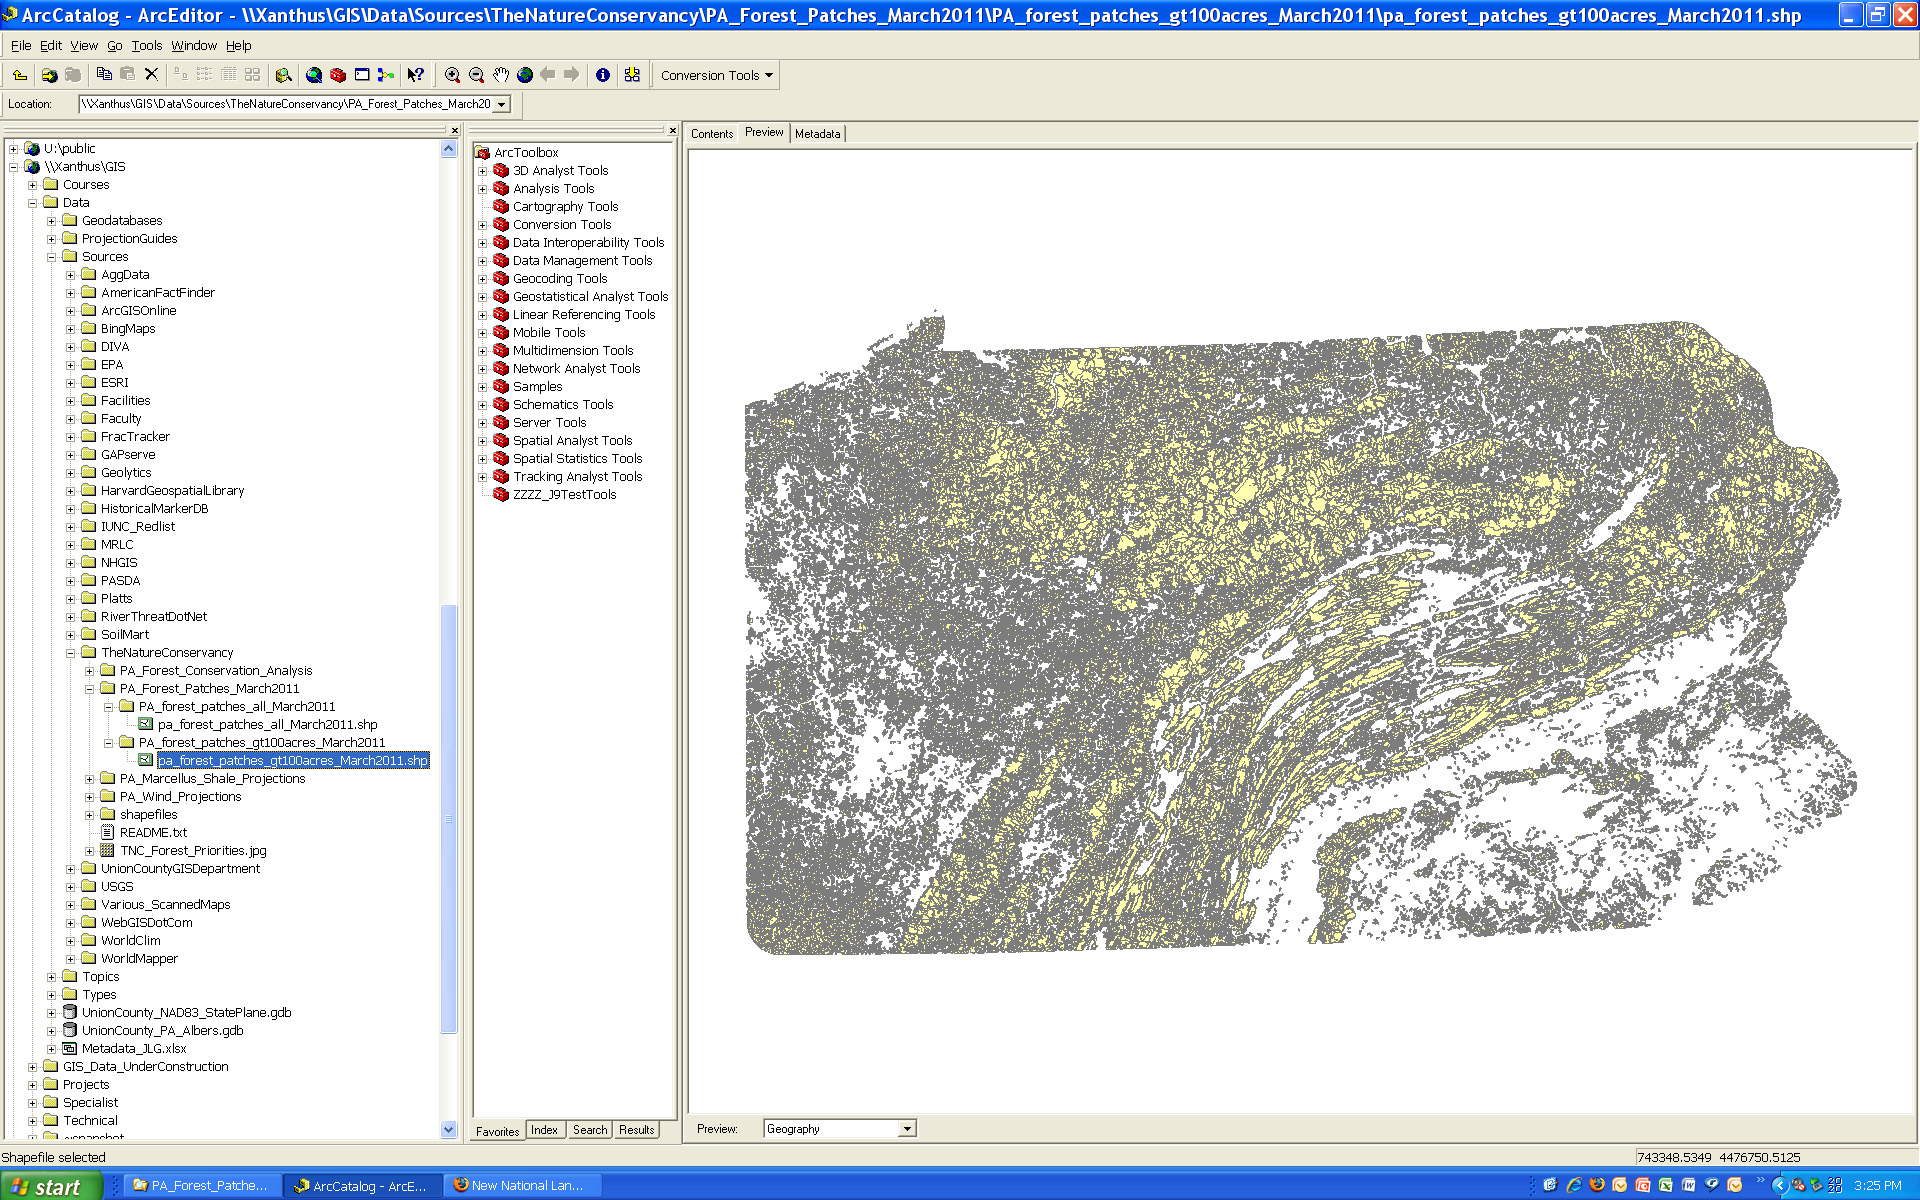
New data on Pennsylvania forest patches is available on Xanthus.  The datasets were created by the Pennsylvania chapter of The Nature Conservancy (TNC). The forest patches were delineated using the new 2006 NLCD data (also available on Xanthus).  The TNC defines forest patches as “contiguous areas of natural cover bound by any linear fragmenting feature (roads, railroads, rights-of-way) or non-forest edge.”

Two files are available – (1) forest patches for all of Pennsylvania; and (2) forest patches greater than 100 acres in size.  One important caveat to keep in mind is that the  dataset is intended for analyzing patterns of forest cover and forest patch sizes at a relatively small scale (e.g. state or regional as opposed to small sections of a particular forest or locality).  The NLCD land cover data from which the forest patches were derived is relatively coarse in resolution – so the forest patch boundaries are approximations and not intended for use in applications where exact measurements are needed.

Please contact me if you need to get access to the Xanthus data folder.
Categories
Bucknell/Local Interest Events/Calendar General GIS Marcellus Shale Slideshow

TNC Presentation on Marcellus Shale – Monday, April 4 @ 4:30pm

What: Presentation by The Nature Conservancy on Marcellus Shale/PA Energy Impacts
When: Monday, April 4th at 4:30pm
Where: Bertrand Library, Traditional Reading Room

Refreshments will be served.

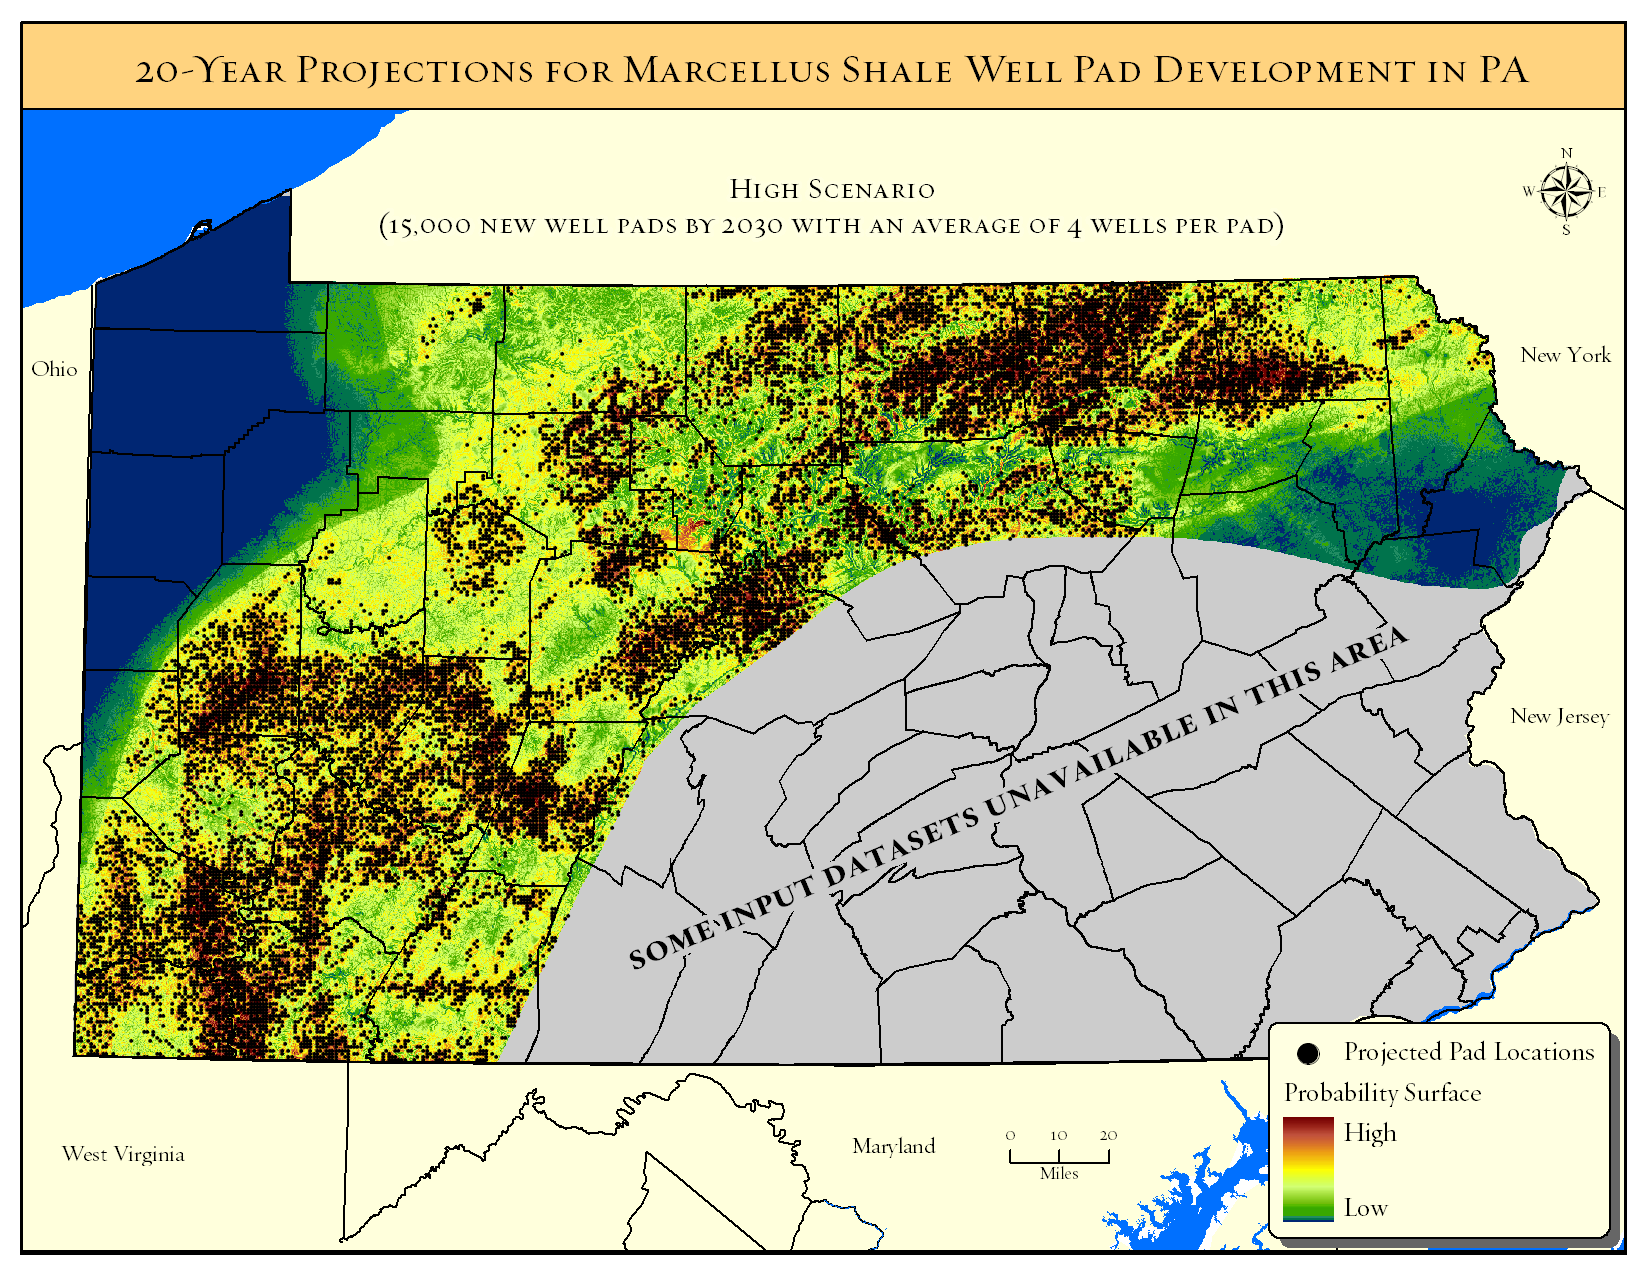
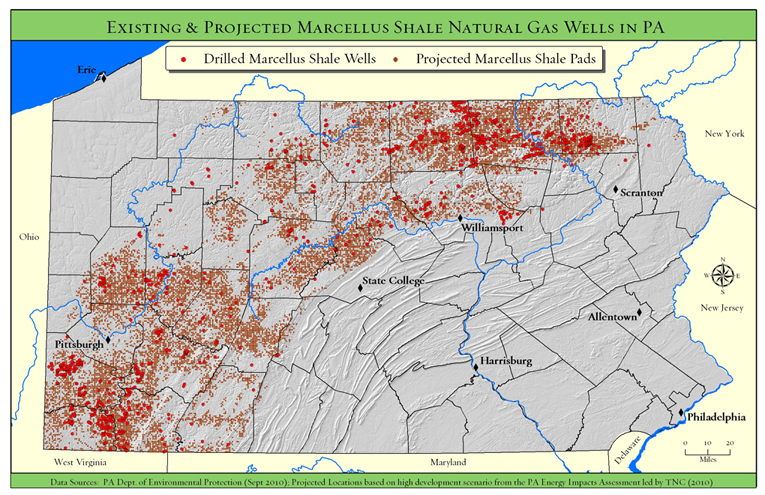
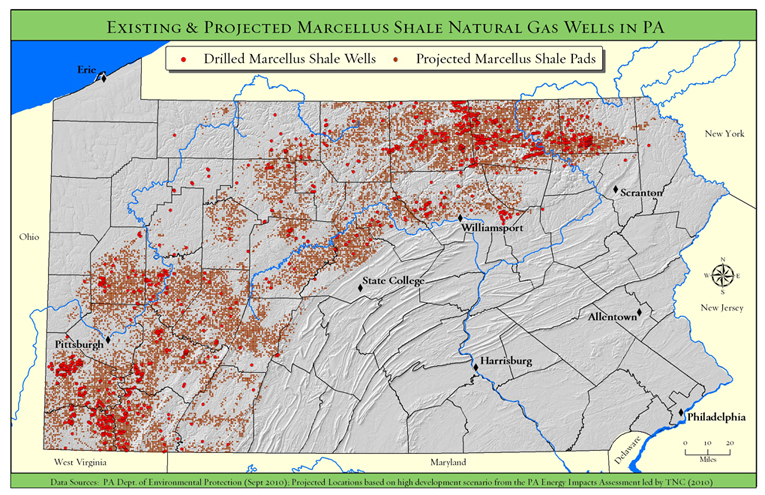
Come and hear Tamara Gagnolet, GIS Analyst and Conservation Data Manager for the Pennsylvania chapter of the Nature Conservancy, discuss her work in using GIS to analyze potential impacts of Marcellus Shale gas drilling in Pennsylvania. Ms. Gagnolet’s presentation will focus on how GIS and spatial analysis were used to project how much energy might be developed in PA during the next 20 years, where that development is more or less likely to occur and what types of strategies might need to be employed to mitigate potential habitat impacts.

Students are welcome and encouraged to attend.

Categories
Bucknell/Local Interest Environment Events/Calendar General GIS Marcellus Shale Slideshow

Presentation by the Nature Conservancy – Monday, April 4th at 4:30pm

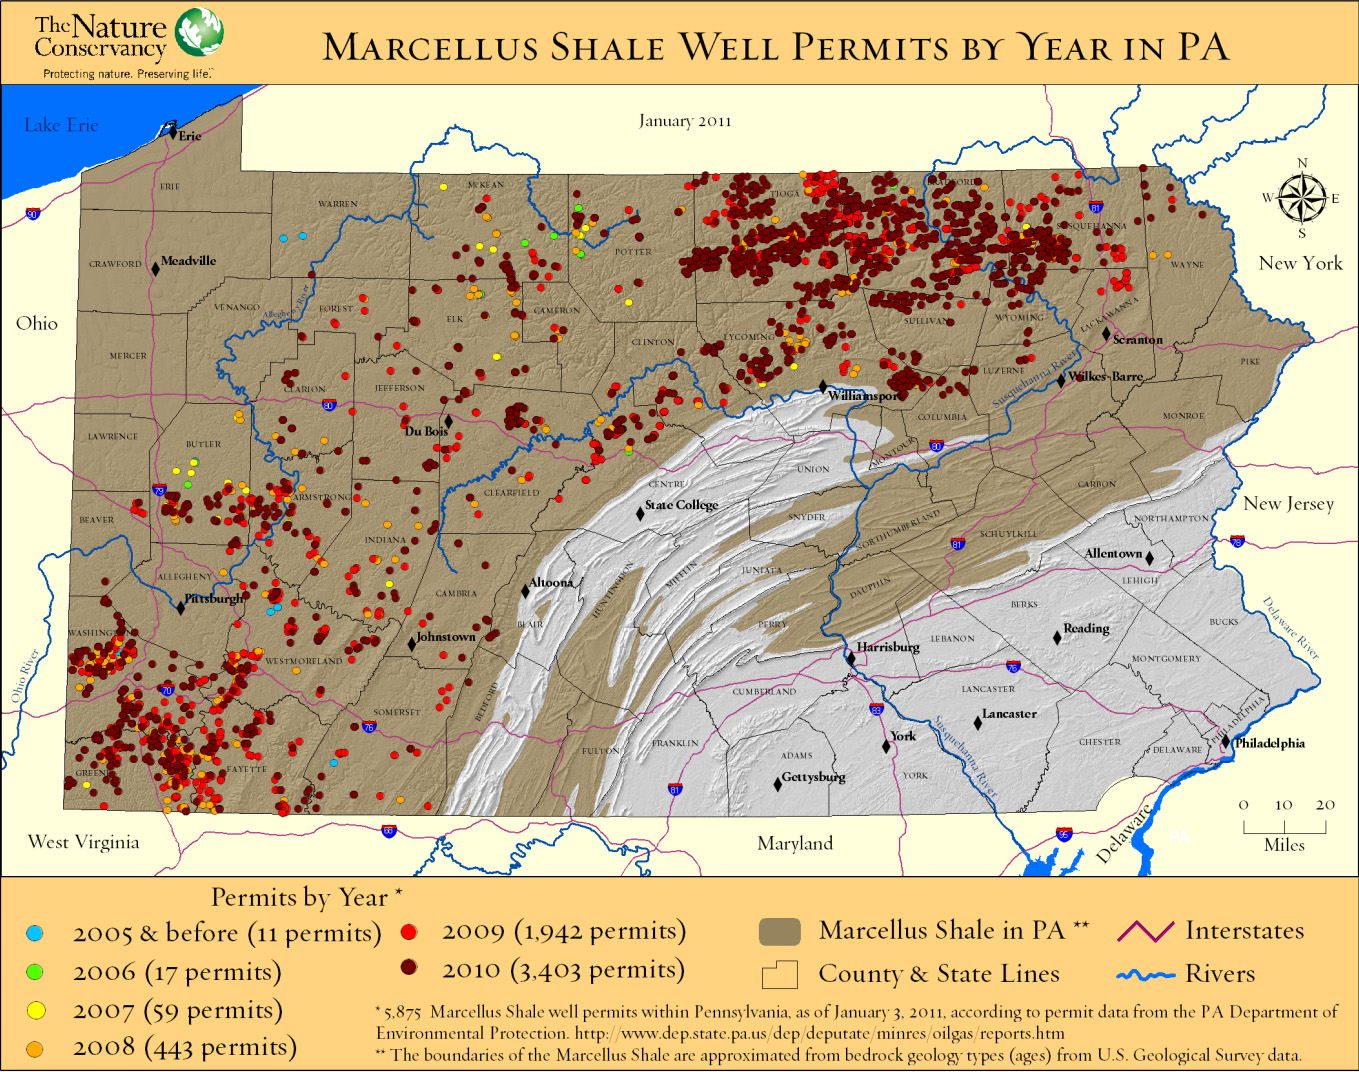
Save the date – April 4th at 4:30pm.  Tamara Gagnolet, GIS Analyst and Conservation Data Manager for the Pennsylvania chapter of the Nature Conservancy, will be at Bucknell on April 4th, 2011 to discuss her work in using GIS to analyze potential impacts of Marcellus Shale gas drilling in Pennsylvania. The Nature Conservancy recently released part 1 of its ‘Pennsylvania Energy Impacts Report’ – focusing on environmental impacts of Marcellus Shale gas-drilling and wind energy. Ms. Gagnolet’s presentation will focus on how GIS and spatial analysis were used to project how much energy might be developed in PA during the next 20 years, where that development is more or less likely to occur and what types of strategies might need to be employed to mitigate potential habitat impacts.

Presentation details: April 4th, 2011 at 4:30pm in the Bertrand Library Traditional Reading Room. Refreshments will be served.

Click here to read an earlier post about the Nature Conservancy report.

Categories
Bucknell/Local Interest Environment Events/Calendar General GIS Marcellus Shale

Upcoming presentation by The Nature Conservancy

Back in December I posted links to a new report and webinar by the Nature Conservancy describing their use of GIS to analyze potential Marcellus Shale impacts in PA.  At some point in April we’ll have the Nature Conservancy team here at Bucknell for a presentation of their work.  Stay tuned for more details…

Categories
Bucknell/Local Interest Environment General GIS Marcellus Shale Slideshow

Using GIS to analyze Marcellus Shale impacts in Pennsylvania

The Nature Conservancy recently released a study analyzing potential habitat impacts of energy development – including Marcellus Shale – in Pennsylvania over the next 20 years. Click here to watch a recorded presentation by the two lead researchers on the project. Click here for a copy of the full report.

The presentation includes discussion of how GIS and spatial analysis were used to project how much energy might be developed in PA during the next 20 years and where that development is more or less likely to occur.