Categories
Bucknell/Local Interest Events/Calendar General GIS Map Apps Slideshow

Upcoming map competitions

Students – now that you are finished with your final GIS projects (you are finished, right?) why not submit them to one of these upcoming competitions. Bucknell students have won awards in other map competitions – let’s do it again:

1. 2011 National Council for Geographic Information (NCGE) Conference & Map Gallery:

The 2011 NCGE Map Gallery Committee invites you to submit a map for display during the 2011 Conference.  All GIS maps are welcome.  The maps will be judged by a panel of peers, with the exception of the People’s Choice Award, which will be voted on by the Conference attendees.  The Map Contest will feature two award categories and the winners will be announced at the closing session on Saturday, August 6, 2011.  Please review the minimum requirements and categories carefully when designing the content of your map entry.

Awards
Best Cartographic Design (Higher Ed., K-12 & People’s Choice) – Awarded to the map that artistically employs the elements of cartography without compromising use and functionality. Maps will be judged on fundamental cartographic principles including figure ground representations, visual hierarchy, color selection, typography, symbology, overall aesthetic appearance, etc.

Best Analysis (Higher Ed., K-12 & People’s Choice) – Awarded to the map that is best designed to display the results of spatial data analysis and presents the information in an unbiased way, allowing the viewer to extract their own conclusions, utilizing the map as a tool.

For guidelines & to submit maps, click here.

2. ESRI’s ‘Storytelling with Maps’ Competition.

Every map tells a story. Share your most interesting web map or mobile app in our Storytelling with Maps Contest. Entries will be judged on how well they make the subject matter interesting, understandable, and engaging. Web map and mobile app entries can be submitted April 29 – June 10, 2011. Prizes will be awarded for first, second, and third place in each category. Winners will be announced in July at the 2011 Esri International User Conference (Esri UC) in San Diego, California.

For guidelines and to submit web map or mobile apps, click here.

Categories
Crisis-Mapping Events/Calendar General GIS GIS in Political Science Slideshow Videos

Where 2.0

The 2011 Where 2.0 conference is wrapping up today in Santa Clara, CA.  Over the course of the week, many of the presentations have been streamed live over the conference website. I’m including a few YouTube videos for some of noteworthy presentations.

Jack Dangermond – CEO and founder of Esri: “Living Maps – Making Collective Geographic Information a Reality”

httpv://www.youtube.com/watch?v=vIbGwY3aG0g&p=0B2FEB8AACD826BE


Blaise Agüera y Arcas, Architect of Bing Maps and MSN at Microsoft:  “Read/Write World”

httpv://www.youtube.com/watch?v=4X9u4JG9H6E&p=0B2FEB8AACD826BE


Ben Fry – principal of Fathom: “Mapping: From Interesting to Insightful to Irrelevant” (coming soon)


Patrick Meier, Director of Crisis Mapping & New Media for Ushahidi: “May the Crowd Be With You: The Future of Crisis Mapping for Disaster Response”

httpv://www.youtube.com/watch?v=M_NguESRZ4g&p=0B2FEB8AACD826BE


Dennis Crowley, Co-founder, foursquare; and Robert Scoble, Managing Director, Rackspace: “Future Location: Scoble & Dens”

httpv://www.youtube.com/watch?v=TpTDGeLiFnc&p=0B2FEB8AACD826BE


John Barratt, self-described “Geo, twitter & weather web hacker”:  “Who, What, Where, When: Creating New Maps from Geo-tweets”

httpv://www.youtube.com/watch?v=ey_m0F_b-Vw&p=0B2FEB8AACD826BE


Sylvain Carle, CEO & co-founder @ Needium: “Locking Yourself Out in London (and Tweeting about it)

httpv://www.youtube.com/watch?v=Gvcs4H_A0Wc&feature=autoplay&list=PL0B2FEB8AACD826BE&index=16&playnext=1


Categories
Environment General GIS GIS in Environmental Studies GIS in Geography GIS in Sociology Map Apps Slideshow Videos

Go Philly! GIS helps improve access to healthy food in the city

Yesterday’s NY Times had an opinion piece praising Philadelphia’s efforts in recent years to improve access to healthy food for its most disadvantaged neighborhoods and citizens.  In ‘Go Philly!’, Mark Bittman describes the collaborative efforts of Philadelphia municipal government, the Commonwealth of PA and a whole host of local non-profits (including my former employer, the newly renamed  Greater Philadelphia Urban Affairs Coalition) in developing programs to bring supermarkets and healthy food options to under-served neighborhoods.

What he doesn’t describe is the critical role that GIS has played in bringing these programs to life.  See below for some background information and resources related to using GIS for improving access to healthy food.

1. Watch this short video (Ch. 3 of Episode 2 from Penn State’s Geospatial Revolution video series) to learn more about the role of GIS in Philadelphia’s ‘healthy food’ success story.

httpv://www.youtube.com/watch?v=RYzHcPHRhWQ

2. Read reports from the Food Trust and The Reinvestment Fund (TRF) describing their work in Philadelphia and other communities. Both organizations are Philadelphia-based non-profits that have been at the center of Philadelphia’s efforts to improve access to healthy food.

“The Grocery Gap: Who Has Access to Healthy Food and Why It Matters” – click here

Food Trust/TRF Report on the Fresh Food Financing Initiatives projects – click here

TRF’s resource page on food access – click here

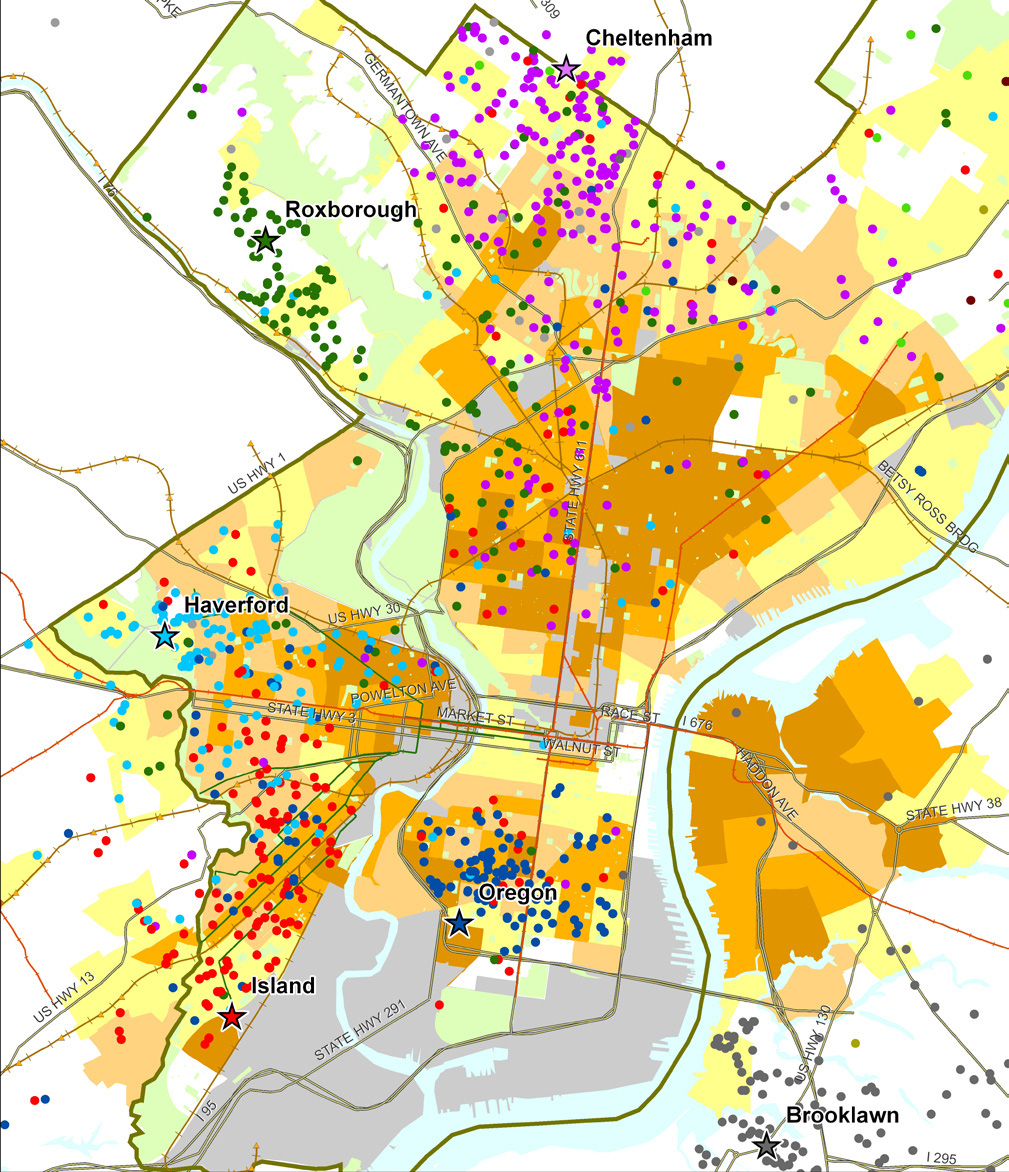
Sample map from Food Trust/TRF report on the Fresh Food Financing Initiative:

“Map 1: Residence of ShopRite Employees by Poverty Rate of Census Tract.  Each star on the map represents a Brown’s ShopRite store, with the location of the store’s employees illustrated by correspondingly colored dots.”


3. Watch a video created by TRF in collaboration with the Brookings Foundation to describe their use of GIS and findings in their  “Getting to Market” report on healthy foods initiatives across the U.S.

httpv://www.youtube.com/watch?v=Wp1w9s4kkHU


and/or explore the project website for “Getting to Market” – click here . The project site includes profiles of food access in major U.S. metropolitan areas.


4. Explore interactive web mapping applications featuring data on supermarket access:

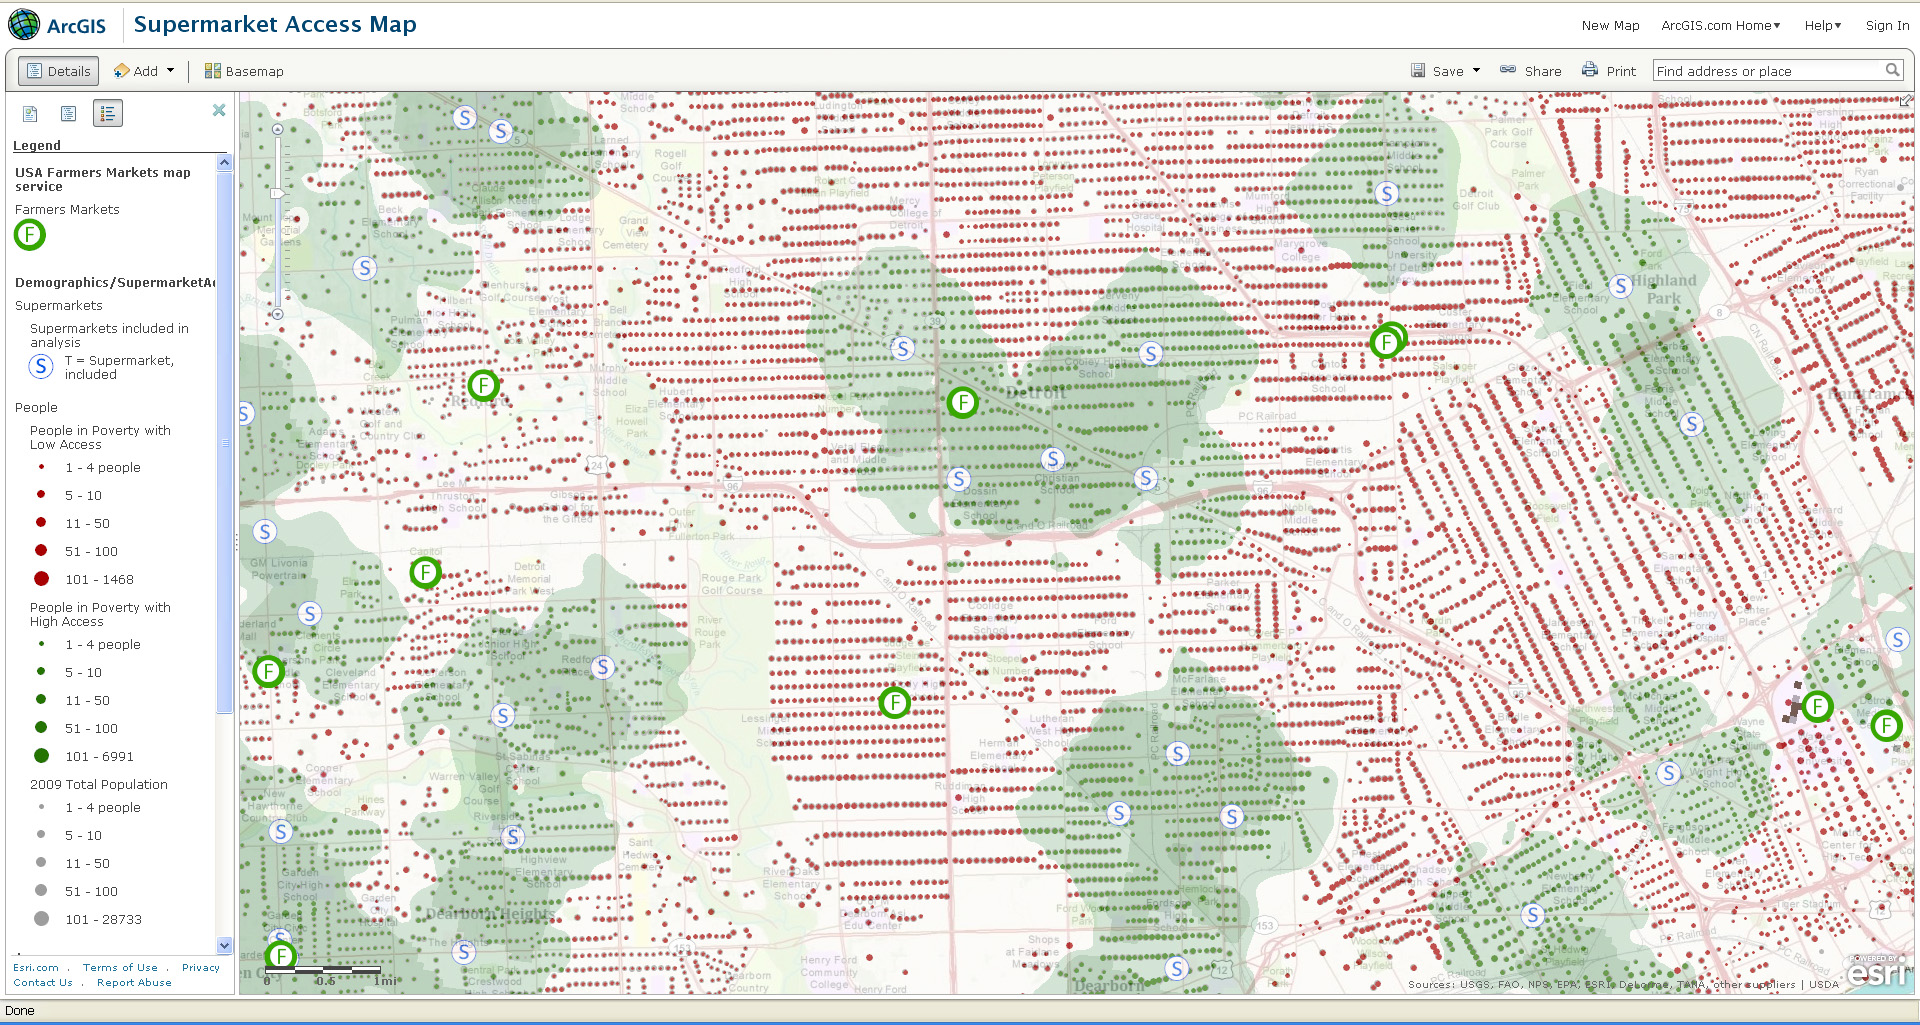
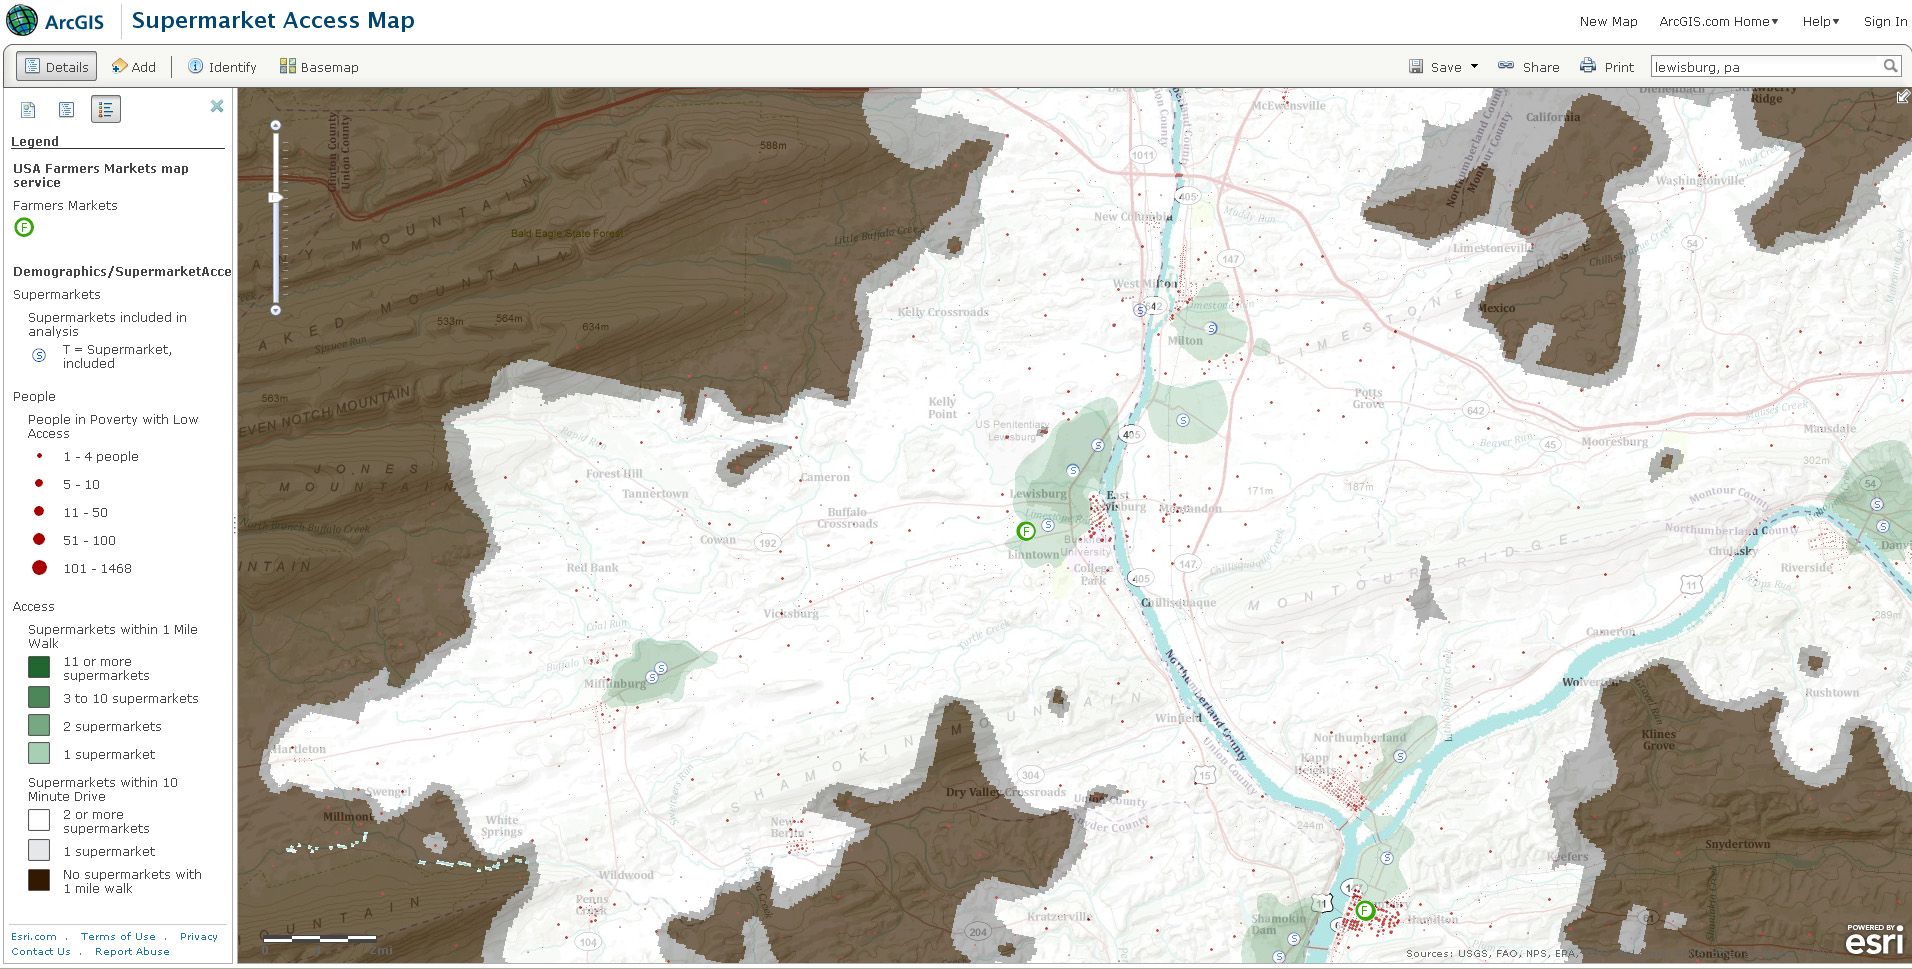
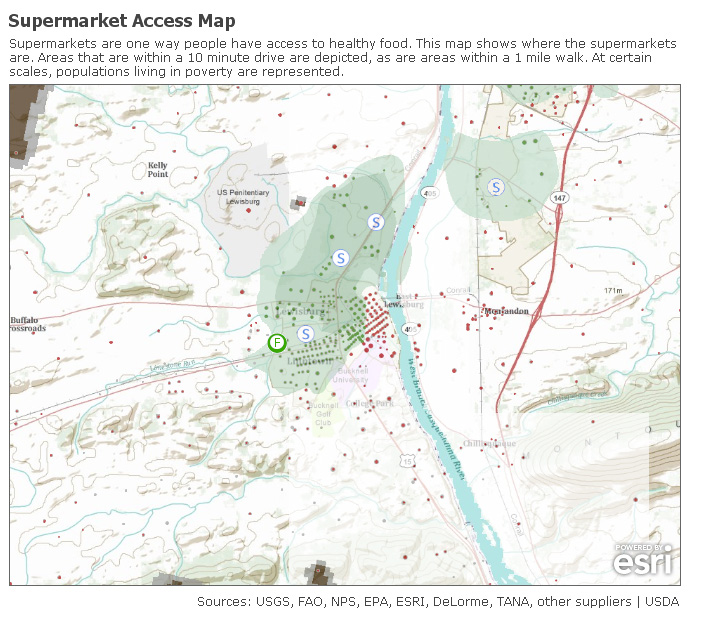
ESRI’s ArcGIS Online Supermarket Access Map – click here

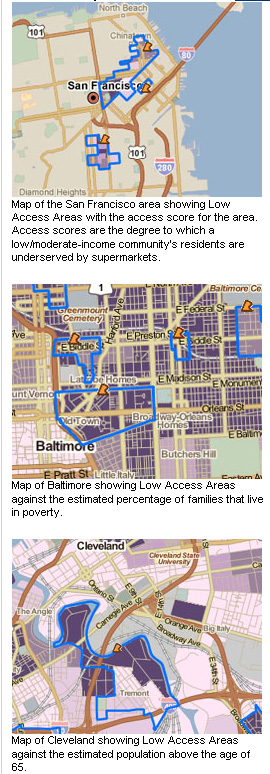
TRF’s PolicyMap Data on Supermarket Access – click here


Sample map from ESRI’s Supermarket Access Map:


Sample maps from TRF’s PolicyMap application:


Categories
Crisis-Mapping General GIS GIS in Political Science Slideshow

Japanese earthquake – disaster/response maps

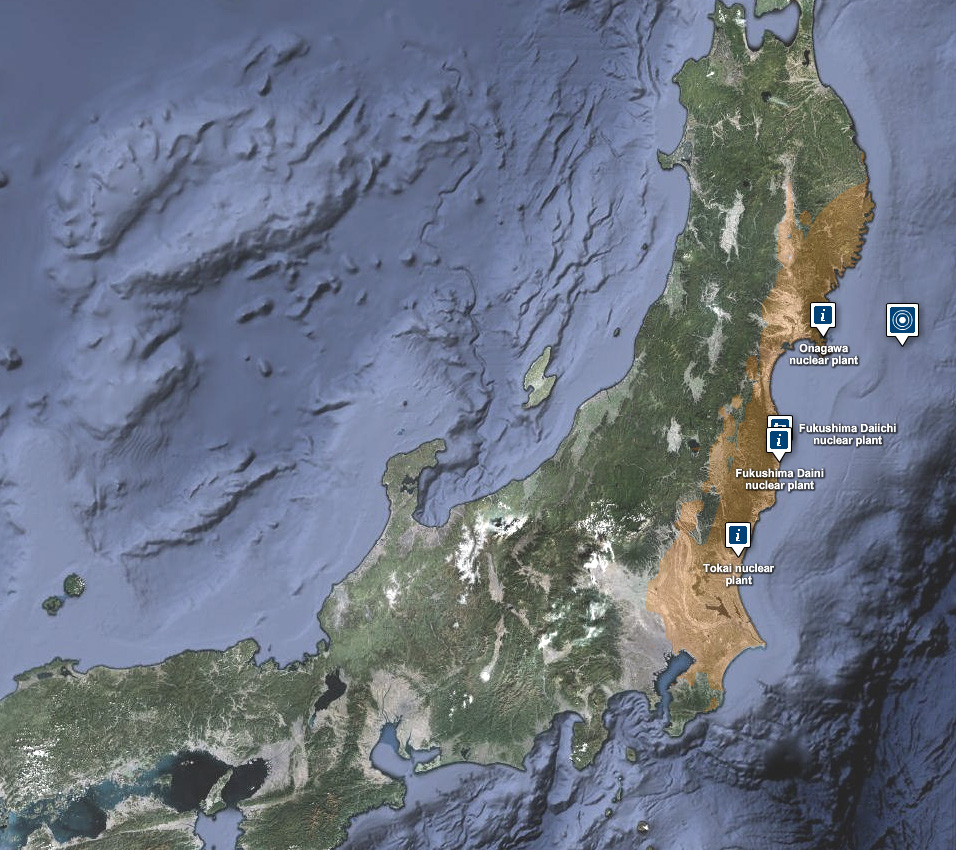
Here are some links to maps and map apps related to the Japanese earthquake and tsunami.  I’ll add more as they are released.

  • JapanQuakeMap, an animated, time-lapse visualization of the earthquake and its aftershocks created by Paul Nicholls, developer of the Christchurch Quake Map website.  From the website:
    The Japan Quake Map on this website pesents a time-lapse visualisation of the Sendai earthquake and its aftershocks, primarily to help those outside the affected area understand what the people of Japan are experiencing. It plots earthquake data from USGS on a map using the Google Maps API, with the size of the circle denoting the magnitude (the higher the magnitude, the larger the circle) and the colour showing the focal depth (see the legend below the map).
  • Click here to view the main page for Ushahidi’s Japan crisis mapping tool (in Japanese). Click here to view the Big Map. These pages use the Ushiadi platform to collect and display crowdsourced info (SMS, e-mail, Twitter, Flickr, YouTube, etc.). About the Ushahidi site:

Anyone on the ground can text in the location of a trapped person, and these locations are then collected on a map. You can also text in where to find aid, a pop-up hospital or a precarious building that should be avoided.  Good.is

  • Also from Ushahidi, a Radiation Map that uses the Crowdmap platform.  The radiation map is in both Russian and English and has other language options available.
  • Map of seismic activity in the 7 days leading up to the earthquake – from MapLarge (note: as of Wed. March 16th the MapLarge site is down – too much traffic?)
  • What is crisis mapping and how does it work? Click here to read Patrick Meier’s answer to that. Meier is the Director of Crisis Mapping at Ushahidi and co-founder of the International Network of Crisis Mappers. 
Categories
Data General GIS Map Apps Slideshow

Forecasting snow and finding supermarkets

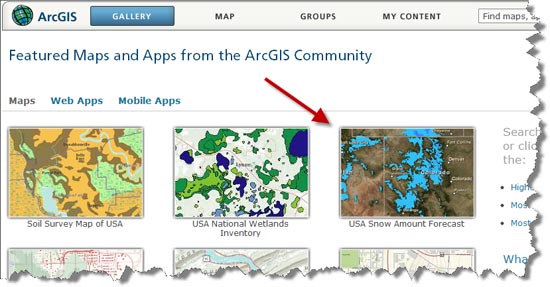
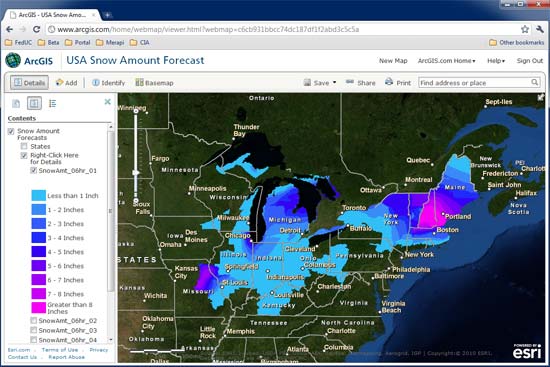
If you’re the type of person who loads up on bread and milk at the first hint of snowfall, then ArcGIS Online is your new best friend.  Using ArcGIS Online you can create a map showing projected snowfall amounts for your area along with the locations of nearby supermarkets. The ArcGIS Online Gallery has free basemaps that you can use to create quick and easy mash-ups online, stream directly into your ArcGIS map project, or (in many cases) download the raw data to use in whatever way you want. The basemaps shown below for snowfall forecasts and supermarket access are just two of the dozens of basemaps you can choose from in the ArcGIS Online Gallery.

View Larger Map

Read more about this on the ESRI ArcGIS Online blog.

ArcGIS Online Basemaps

Snowfall forecast map

Supermarket access in Lewisburg