Categories
Bucknell/Local Interest Digital Humanities Environment General GIS GIS in History GIS in Humanities Slideshow

Georeferencing Historic Maps of Susquehanna Valley Region

Guest Post by Robby Holler, Geography/International Relations ’13

During the past two months, I’ve spent time working with other GIS interns with many of their projects.  Much of my time, though, has been spent on two projects: georeferencing an 1868 atlas of central Pennsylvania and georeferencing and vectorizing a map of Lake Otsego.  Both of these projects tie in closely to the Susquehanna River Valley and are part of the Stories of the Susquehanna program.

Most of the GIS student assistants pitched in to help with the 1868 atlas.  Together we georeferenced over 30 maps of central Pennsylvania.  To do this, we scanned pages from the atlas, clipped them to include only the maps, and then used stream, state road, and local road shapefiles to georeference them.  Most roads on the county maps correspond to still existing state roads.  The local presence of this project struck me as I drove down 522 a few days after georeferencing Middleburg, Beaver Springs, and Beavertown.  It was interesting to drive down highways I had mapped and recognize all the local cross streets.

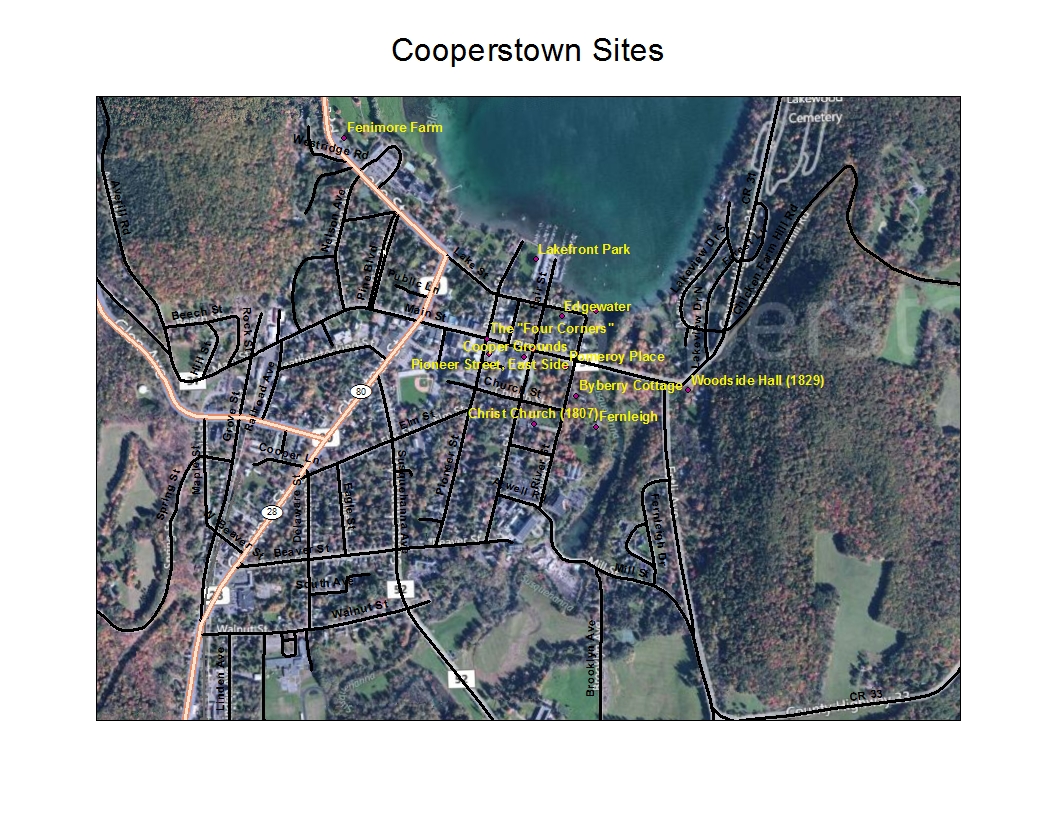
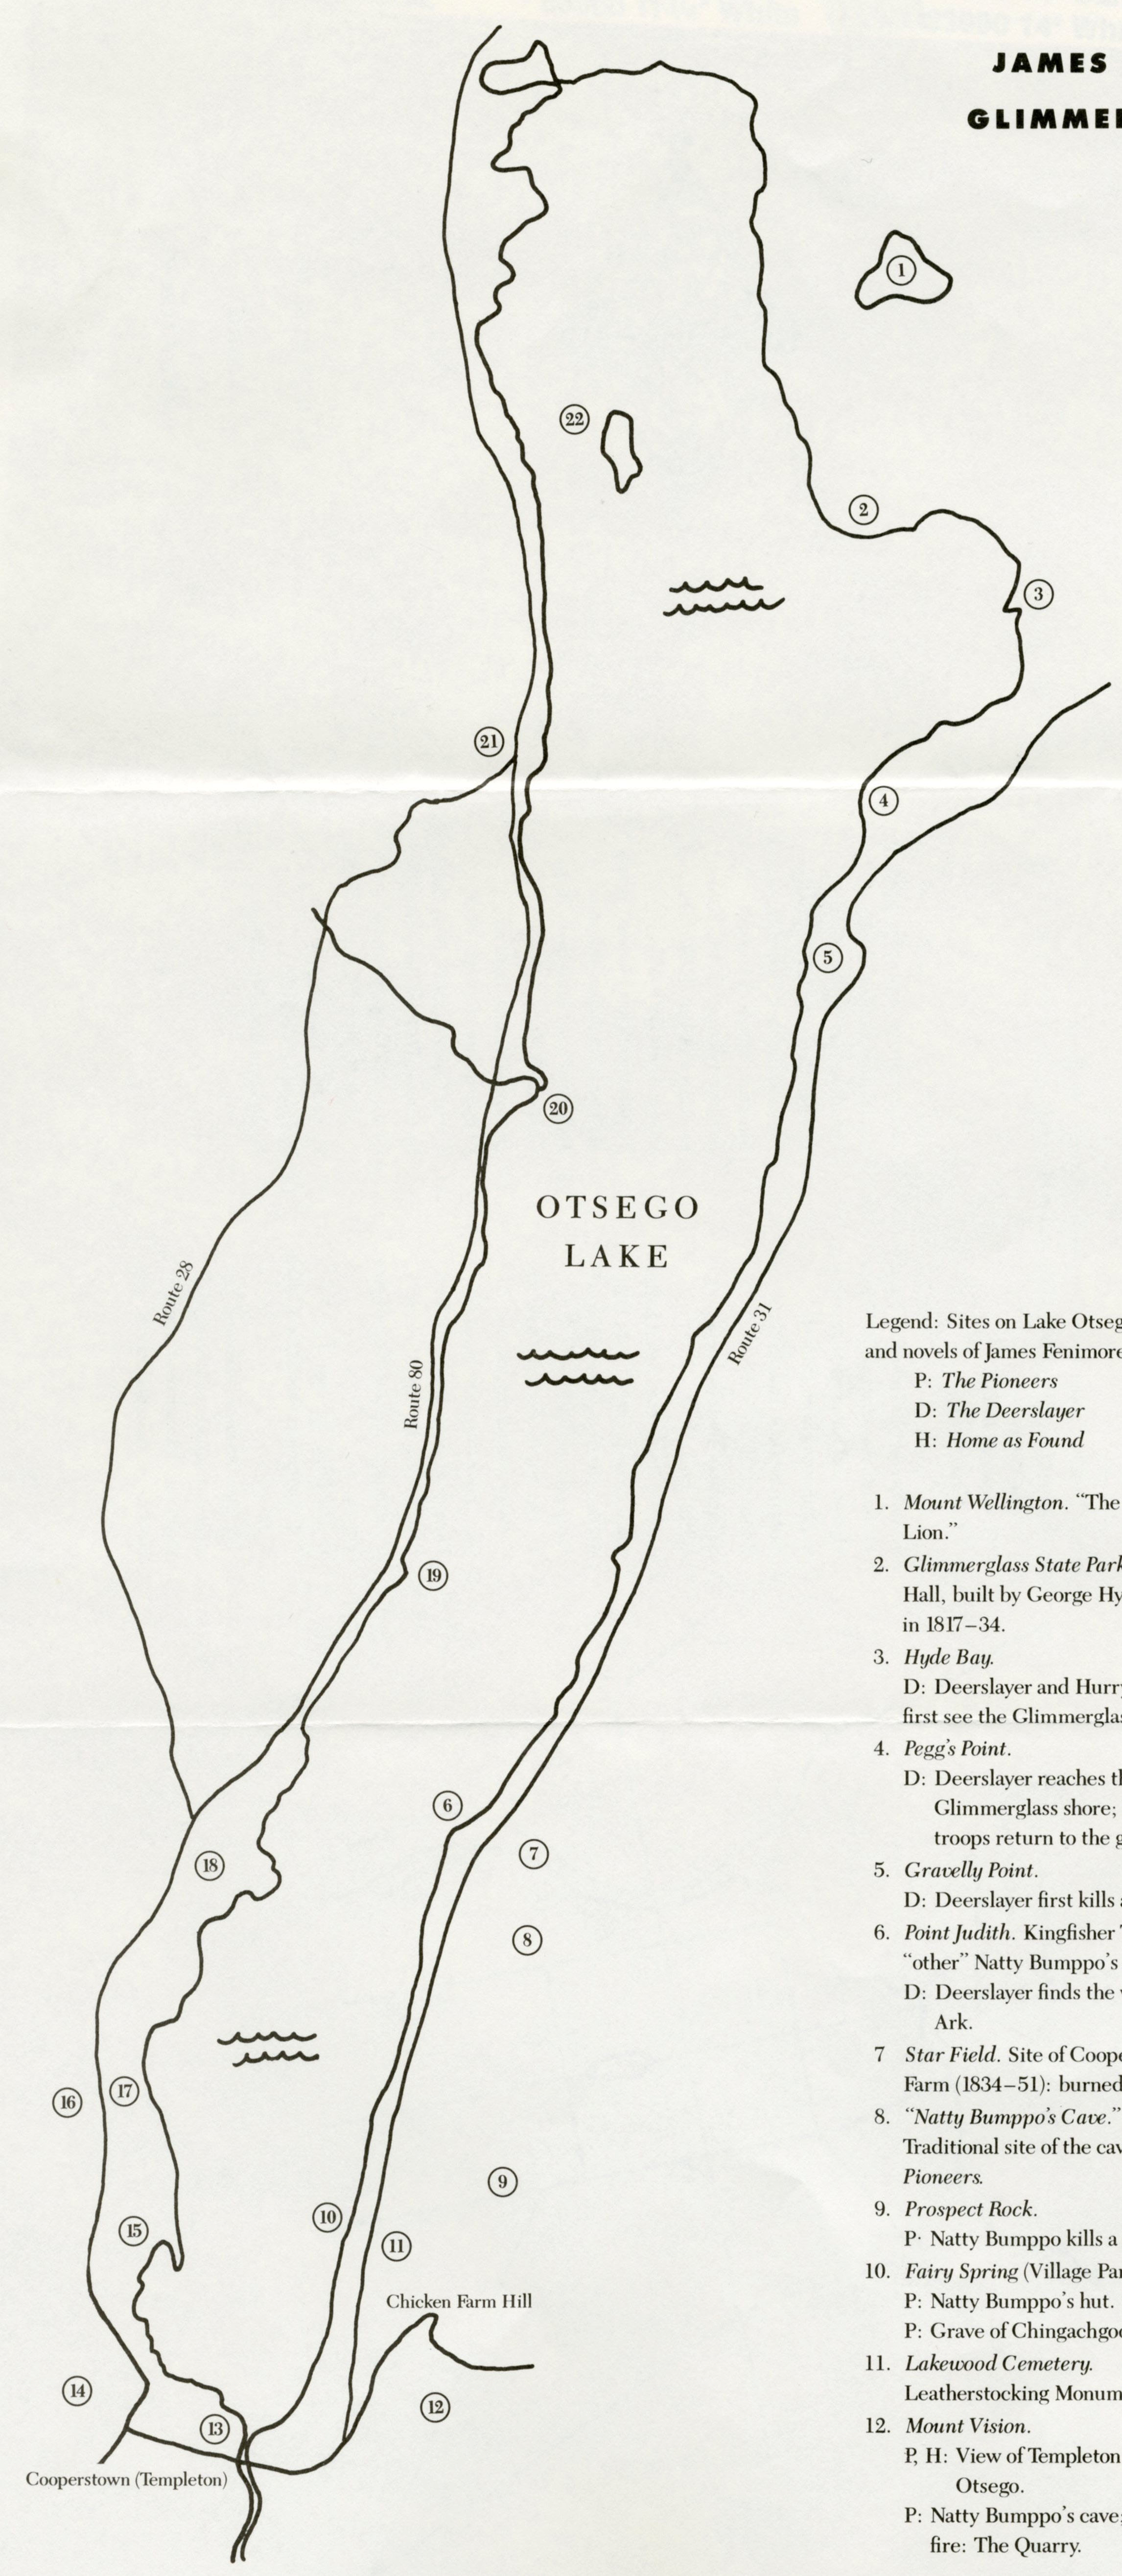
Lake Otsego is located in Otsego County, New York, and is known for three things: Cooperstown (the location of the Major League Baseball Hall of Fame, the headwaters ofthe Susquehanna, and the setting for James Fenimore Cooper’s novels, most notably Last of the Mohicans).  It is these last two facts that interest Alf Siewers, Professor of English.  He gave me a pamphlet titled “James Fenimore Cooper’s Otsego County” and asked me to vectorize the two maps on it.  One map focused on Cooperstown and the other on the whole lake.  Both displayed points important to Cooper and his family, or featured in his literature.  I georeferenced the lake image and then recorded all the points on the map by creating a new shapefile.  To vectorize Coopersburg, I didn’t need to georeference the given map.  I just used roads and local landmarks on a basefile to correctly place points in a new shapefile.  I edited the tables for each new shapefile to add information about every point, including names and known literary references from Cooper’s novels.  Finally, I created an exported final maps with BingMap hybrid basefiles, street layers, a transparent rectified original map, and my new shapefiles.


Categories
Bucknell/Local Interest Environment General GIS Slideshow

Georeferencing and Vectorizing Potential Environmental Hazards in Kyrgyzstan

Guest post by Mike Grasso, Environmental Studies ’13

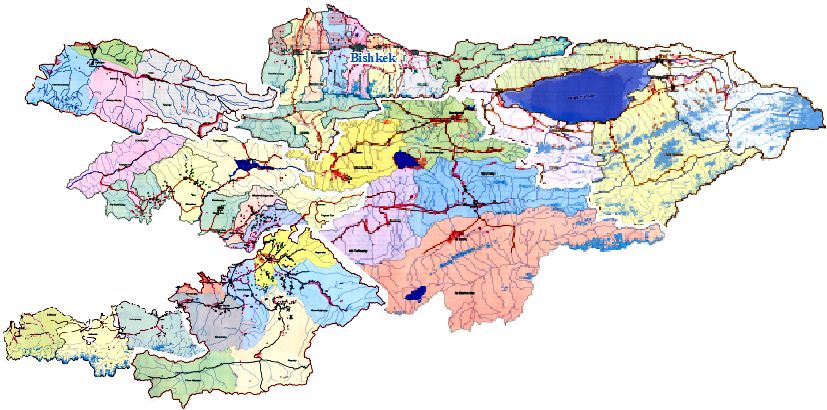
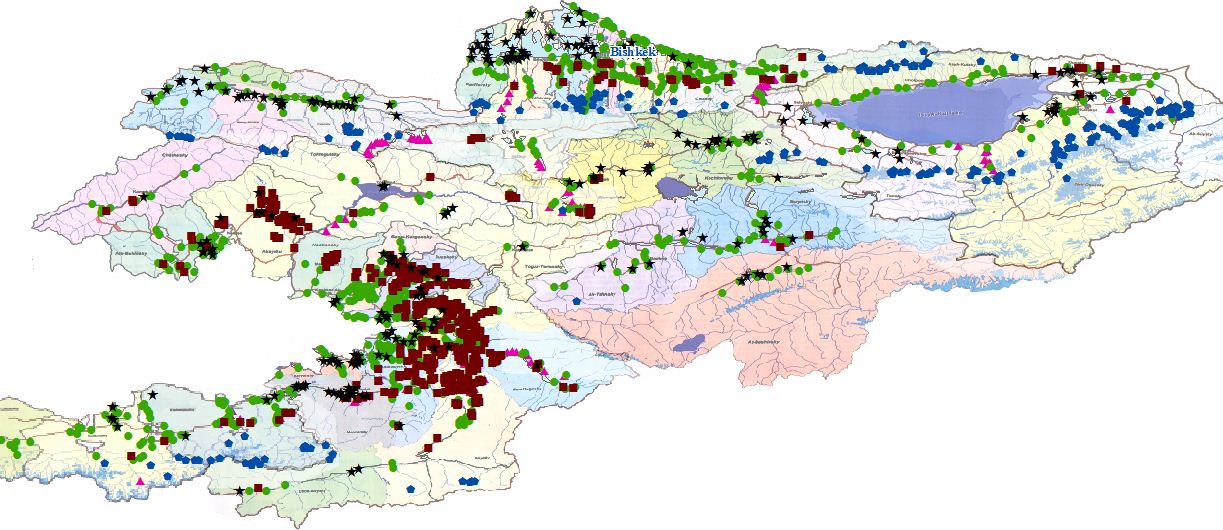
Amanda Wooden is in preparation for the publication of a book entitled Another Way of Saying Enough: Environmental Protest & Conflict in Kyrgyzstan. The book explores the environmental disputes taking place in Kyrgyzstan. Professor Wooden wanted to utilize a number of maps of Kyrgyzstan found in a 2006 atlas to analyze the spatial relationship between between localized issues of public concern, the distribution of collective action addressing these concerns, and the proximity to potential hazards. These maps of Kyrgyzstan, however, are not as accurate as current 2011 maps.

The G.I.S. team’s job was to georeference and vectorize these maps. The first step was to scan the maps from the atlas so that they could be accessed online. The electronic copies were then downloaded into ArcMap as raster data. A base map downloaded from the GADM database of Global Administrative Areas was already added into ArcMap, so the atlas maps had to be scaled down to be the same size as the base map. Then the maps were aligned as best as possible so that the georeferencing could begin. W e looked for outstanding, unique geographical features (ie. large lakes, peninsulas, rivers, etc.) and then added control points. Control points come in pairs and are the georeferencing tools that do the stretching and adjusting. The first point is placed on the distinguishable feature on the incorrect map and the second point is placed on the same feature on the correct map. The incorrect map will automatically shift after selecting the second point. Each section usually takes three to six pairs of points to correct them.

After georeferencing, the map legend points were vectorized. Vectorization is the process of taking raster data and converting it to vector data. In order to do this, we zoomed in on the map and panned through the entire map clicking on every legend point on the map, assigning a different shape to each different environmental hazard. Some of the map legend points that were vectorized are flooding-prone areas, rock-fall prone areas, avalanche ar eas near roads, and mudflow and floods hazard. The map legend points were vectorized because vector data is able to be edited and used to run spatial analysis queries. For example, with the m

ap legend points as vector data, we could select a point on the map that could represent anything (a city, town, ski resort, etc.) and run a location query to find out how many potential avalanche risk site there are within a 5 mile radius of that point.

Categories
Bucknell/Local Interest Environment Events/Calendar General GIS GIS in Biology Slideshow

Do turtles with more powerful predators have stronger shells?

Do turtles with more powerful predators have stronger shells?

Over the last year, Biology professor Tristan Stayton used GIS and finite element analysis methods to explore this question. During Summer 2010, Prof. Stayton participated in a Library & IT workshop designed to give faculty hands-on experience using GIS for academic research and teaching.  Over the course of the summer, Prof. Stayton and his student researchers used ArcGIS to georeference and digitize turtle species ranges to convert them from image files into GIS data that could be used as input in Prof. Stayton’s analysis.  The same techniques were also used to digitize the ranges of 25 known turtle predators.

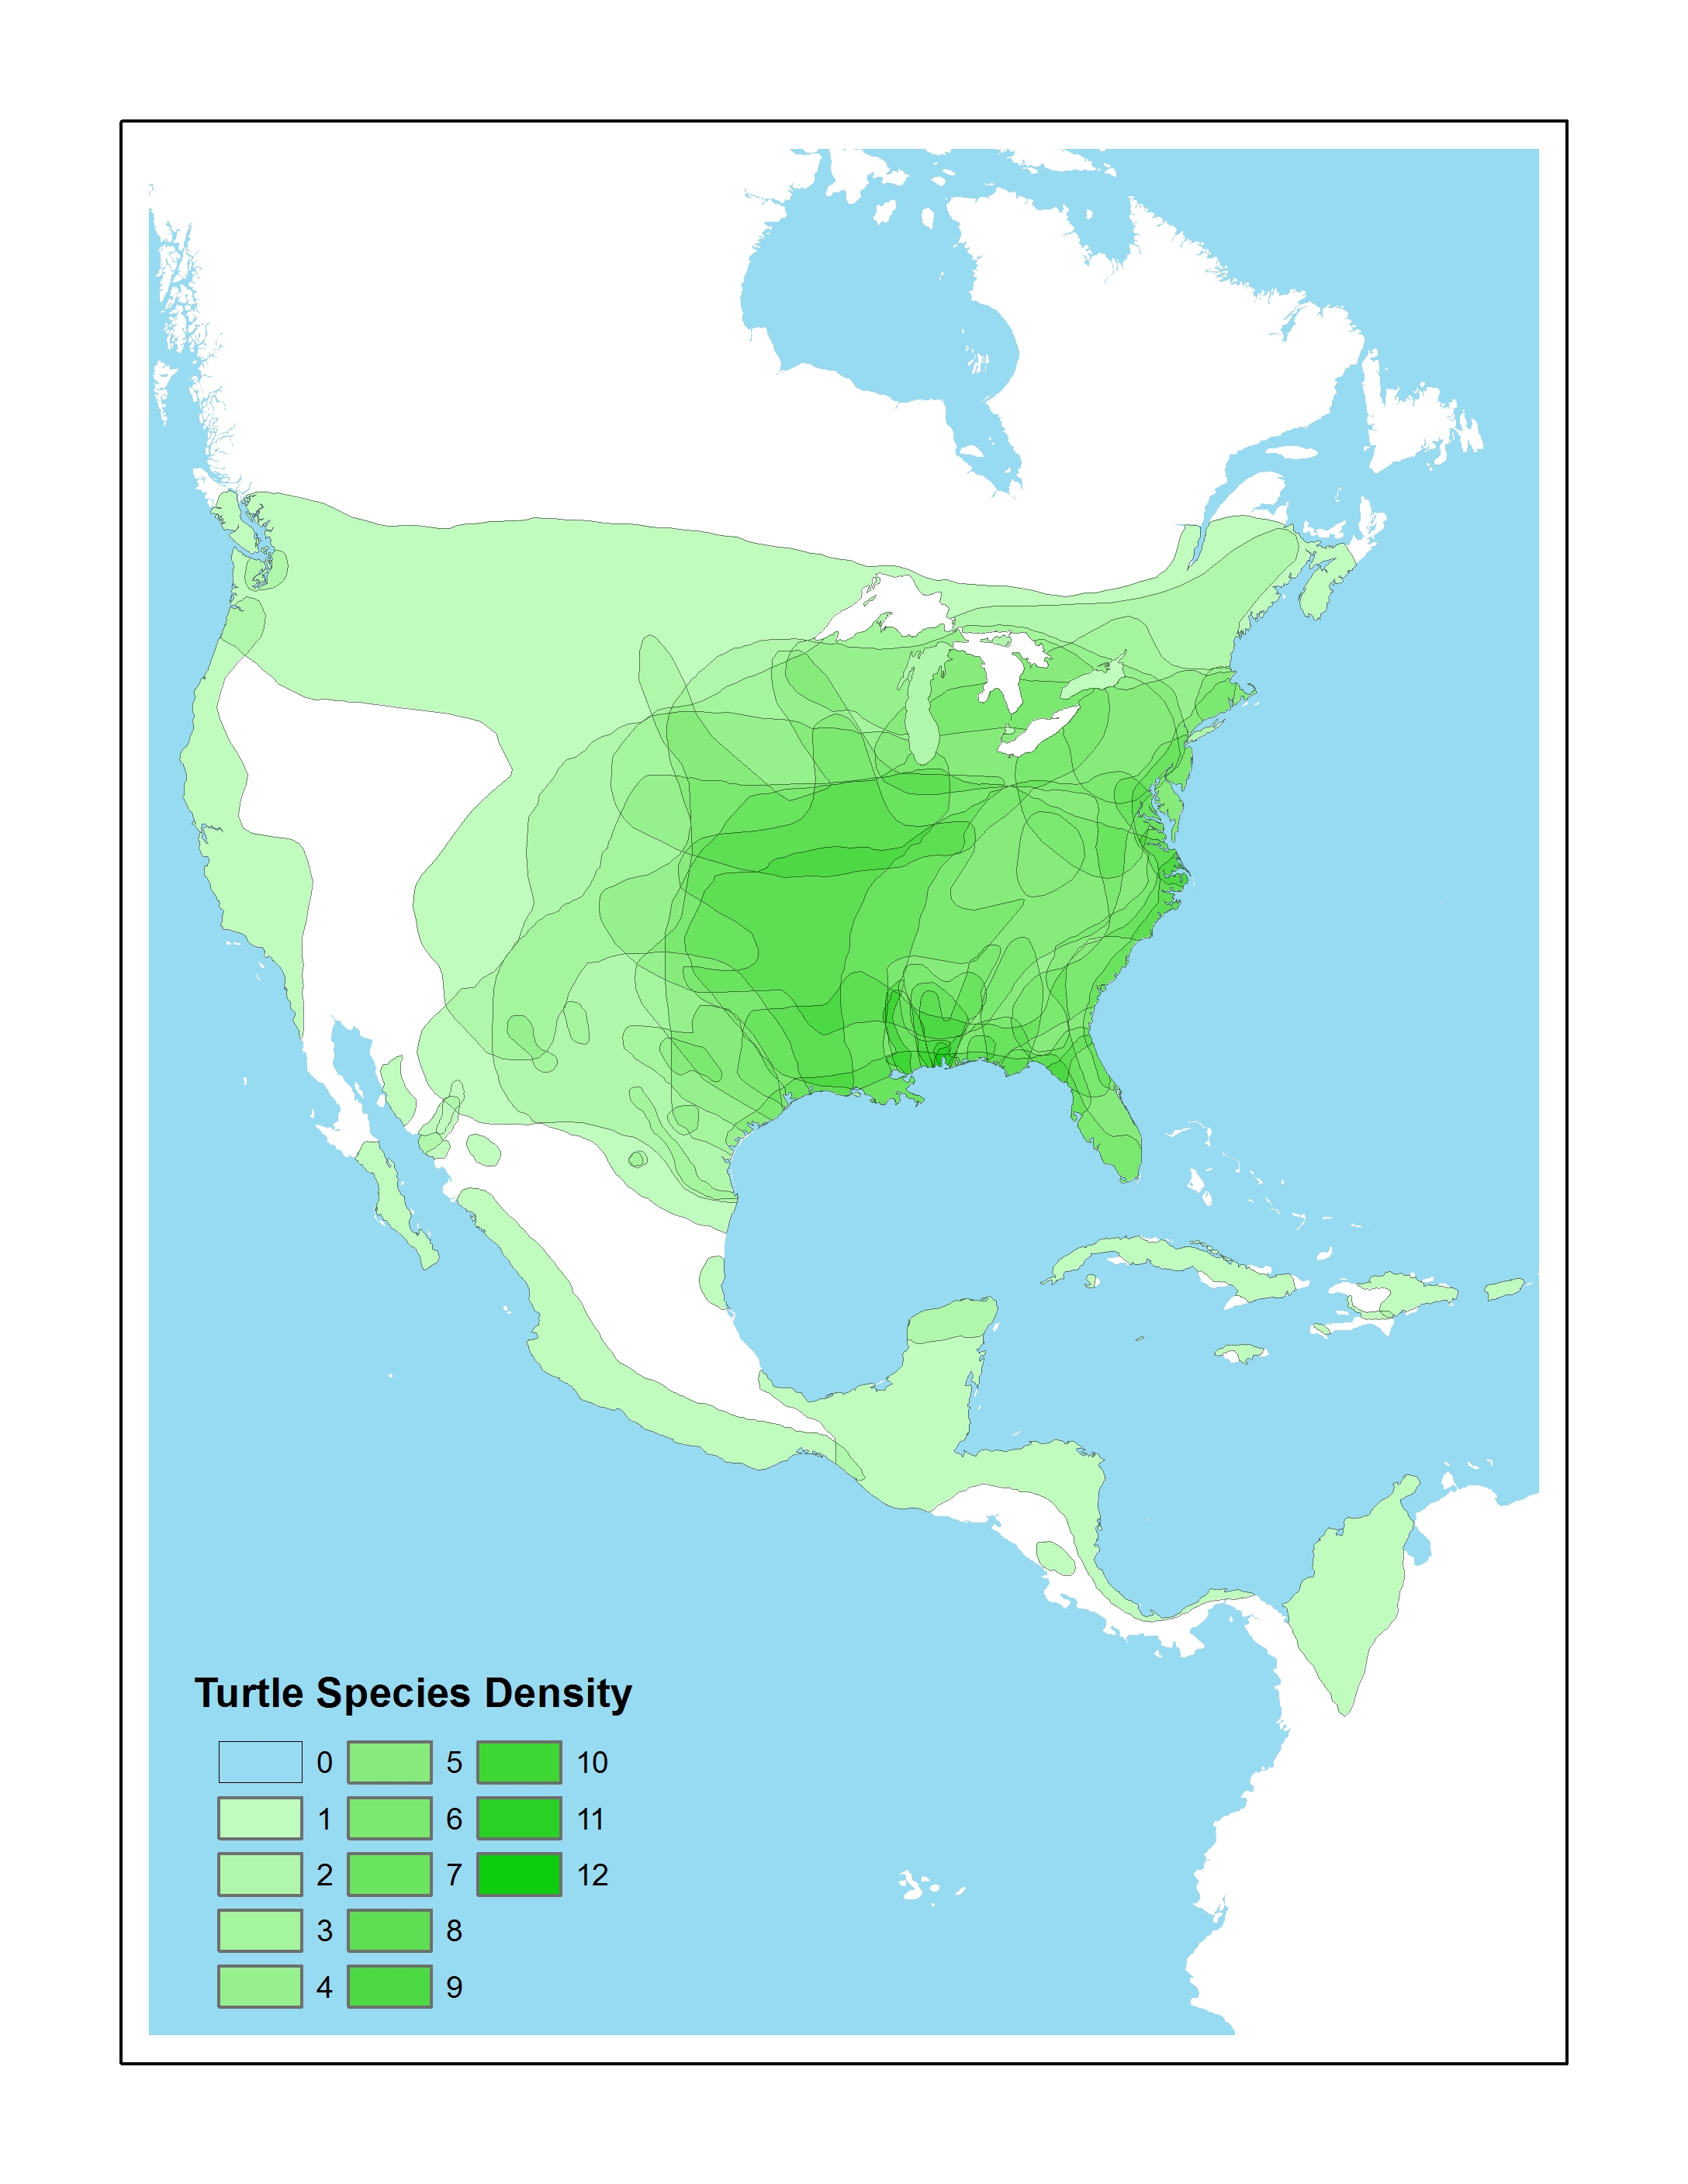
During the 2010-11 academic year, Prof. Stayton used the GIS datasets created during summer 2010 to calculate range sizes and range overlaps of turtles and their predators – and then to derive measures of turtle predation pressure. Prof. Stayton presented his conclusions last month at the Evolution 11 conference in Norman, Oklahoma and has a paper in the works as well.

The answer to the question? The short answer is that no, turtles with more powerful predators do not have stronger shells – in fact, they appear to have evolved weaker shell shapes.  But be sure to look at the poster below for a full presentation of the methodology, results and possible explanations for the findings.

Students involved in this project: Christine Vega ’11, Patrick Caloz ’13 and Joe Budzinski ’11 (georeferencing & vectorizing species ranges); Dan Ladd, GIS Student Assistant, Middlebury College ’14 (created turtle species density map shown in poster)


Categories
Bucknell/Local Interest Digital Humanities Environment General GIS GIS in History GIS in Humanities Marcellus Shale Slideshow

Ask the expert: Katie Faull on maps, Moravian diaries and Native American history

In the BU homepage’s February ‘Ask the Expert’ interview, Prof. Katie Faull discusses her research on the 18th Century Moravian settlers and Native Americans who inhabited the Susquehanna watershed region. With the help of her research assistant, Emily Bitely ’11, Prof. Faull has made extensive use of GIS in reconstructing 18th Century landscapes of the Susquehanna.  Read the interview here.

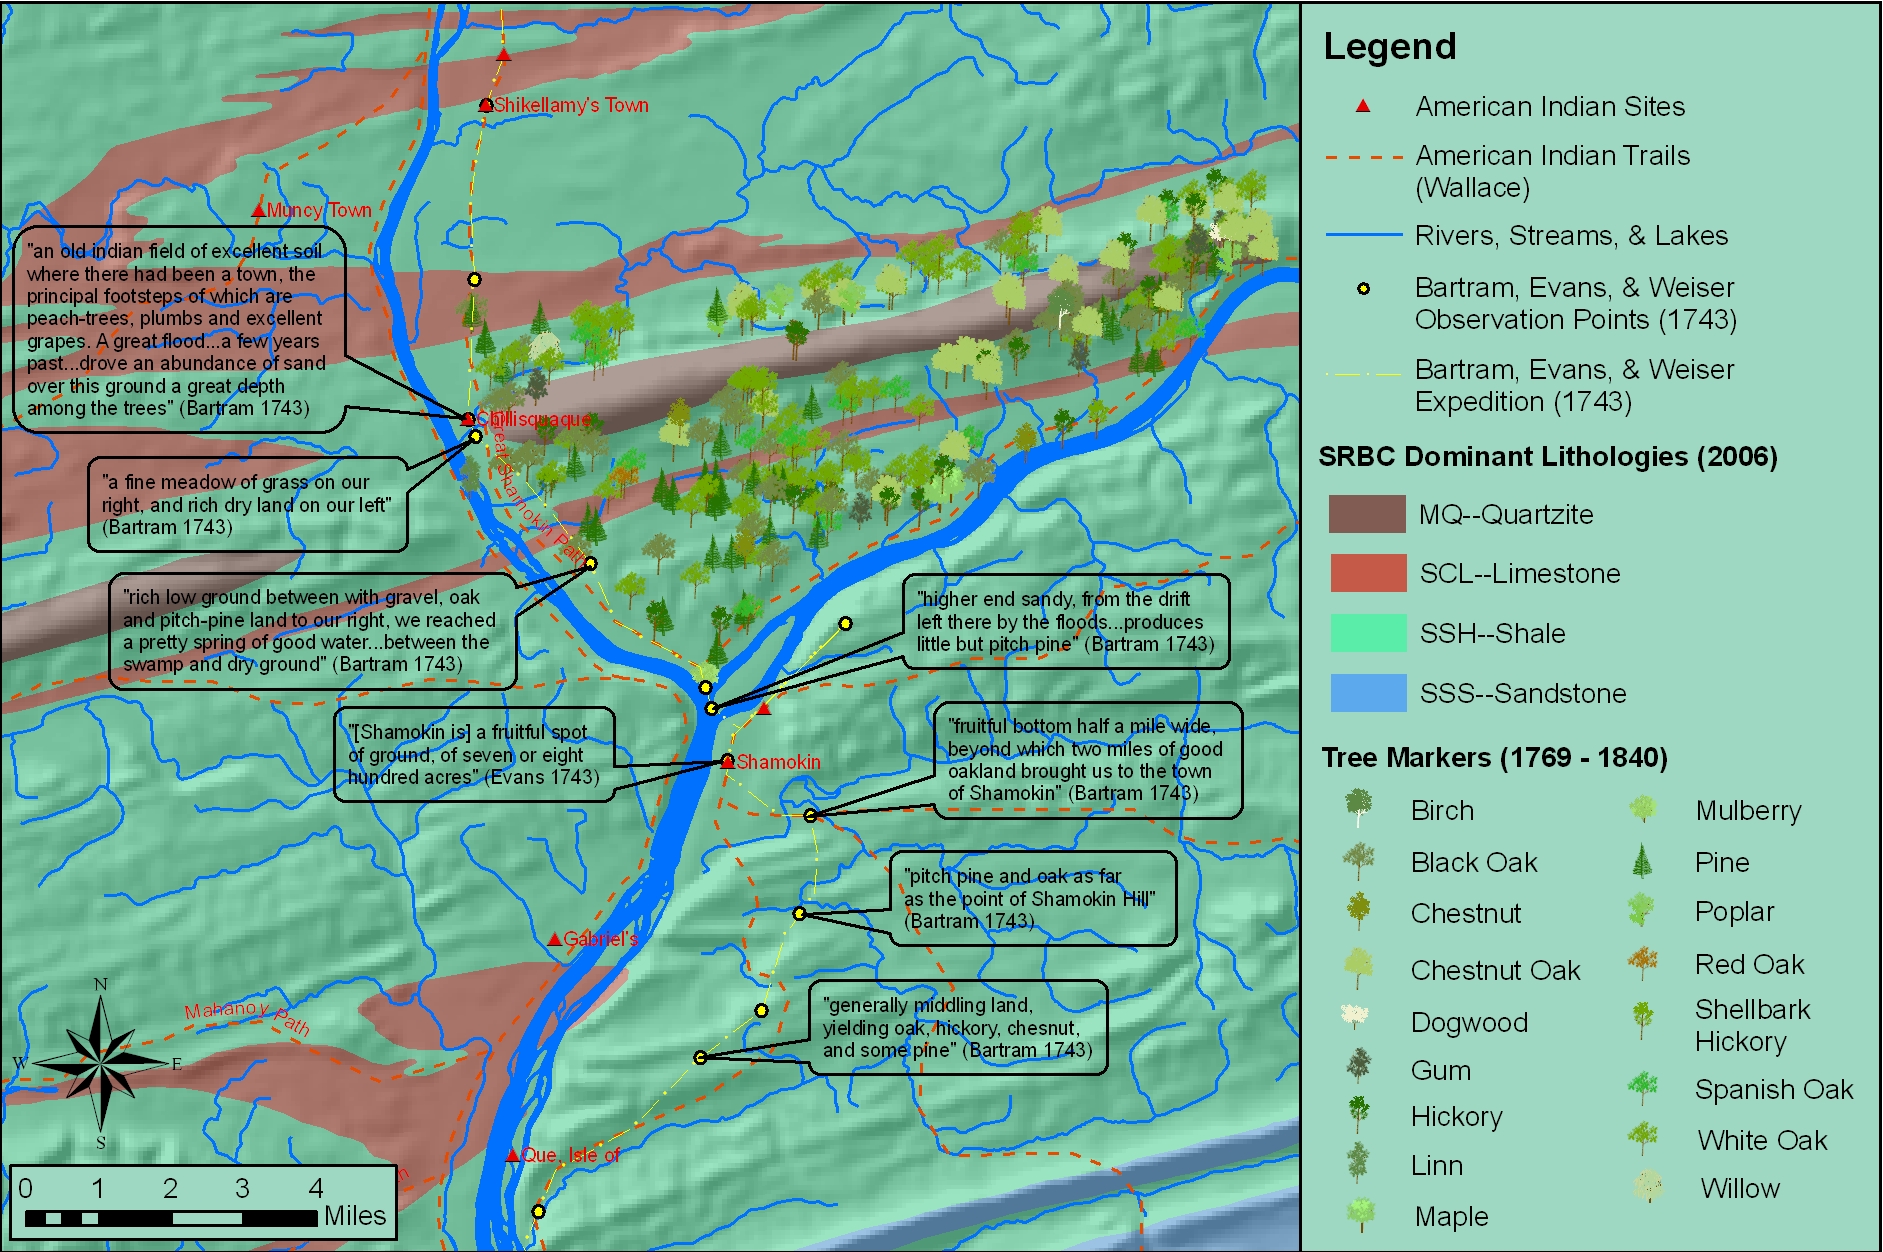
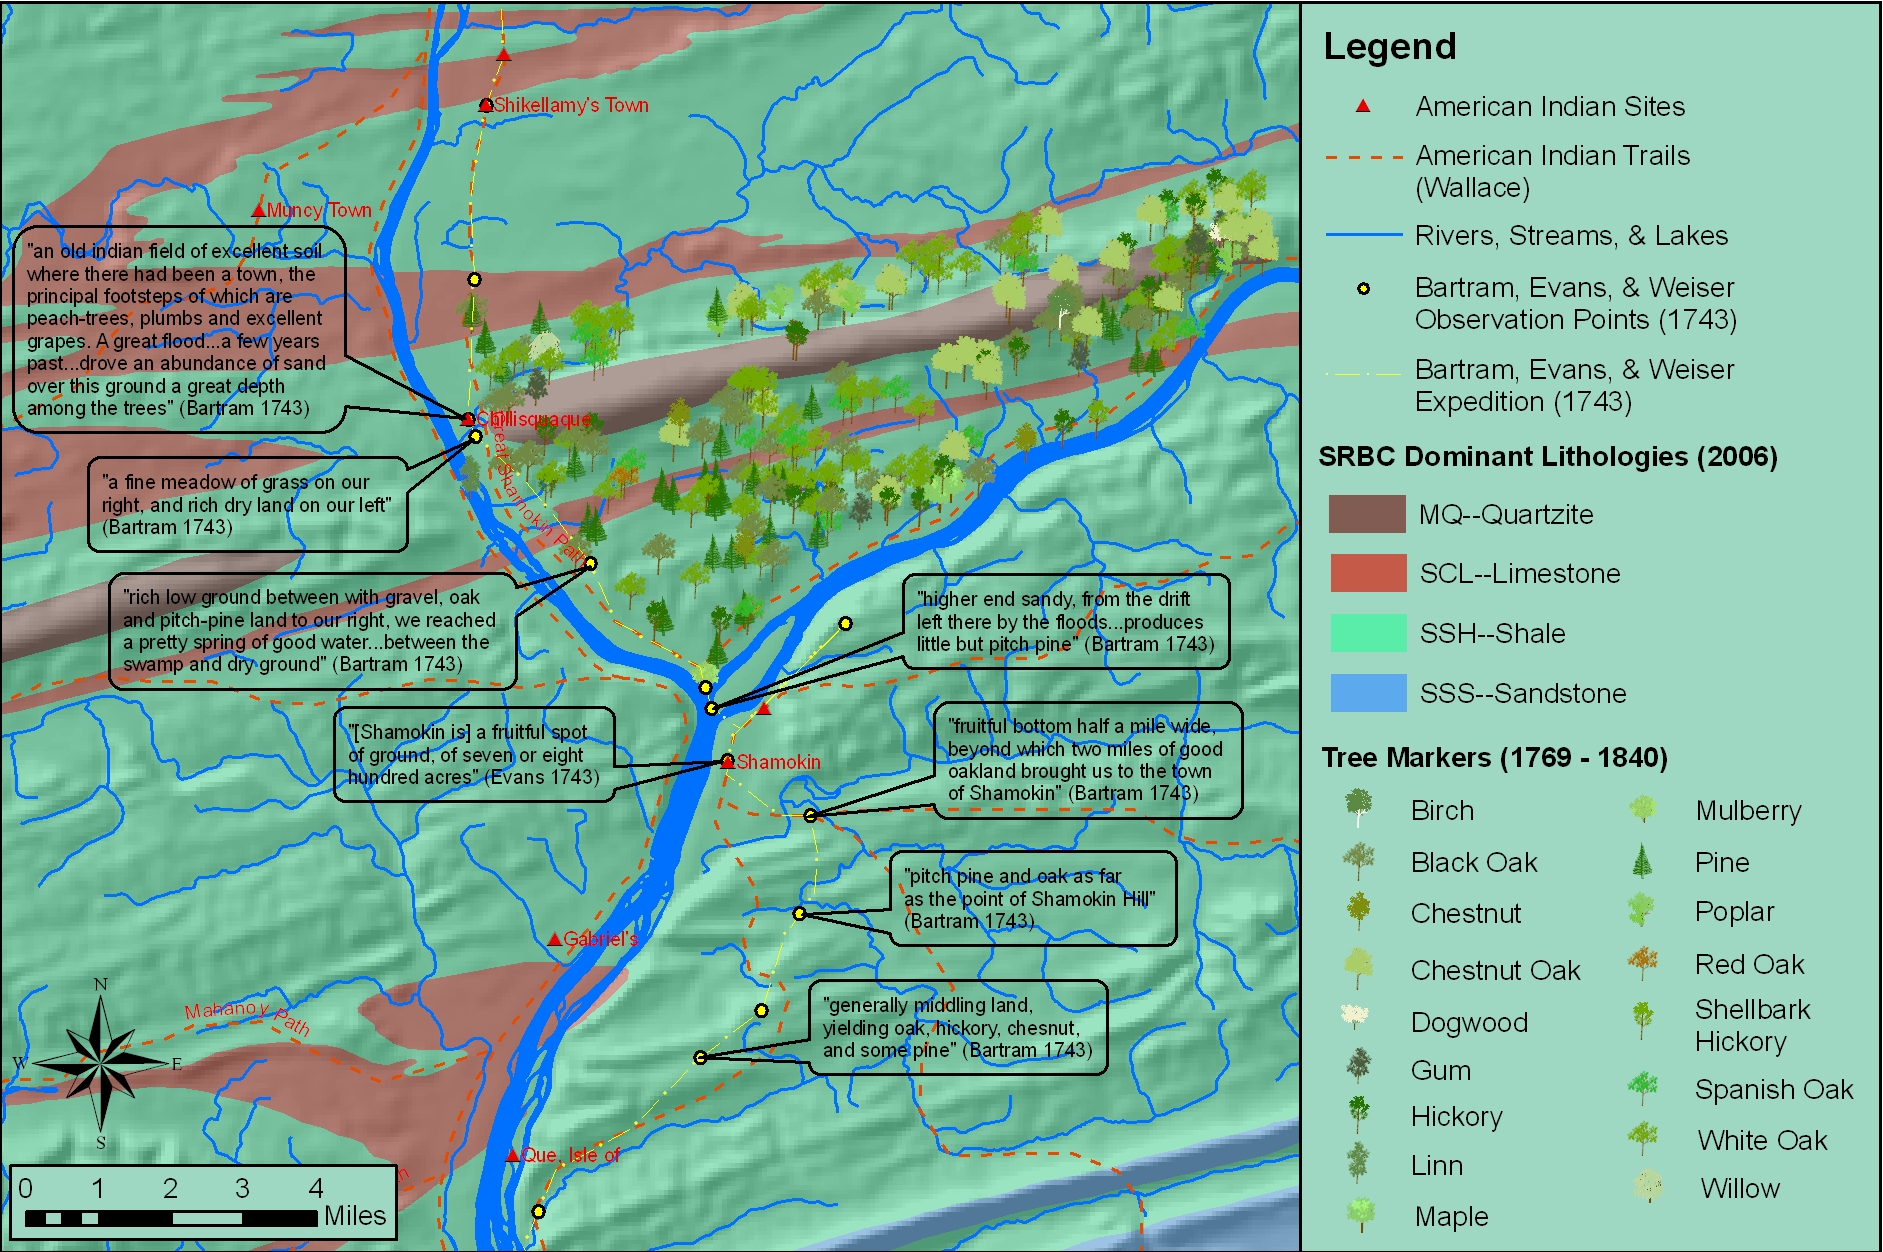
Sample map constructed from witness tree markers and georeferenced historic maps:

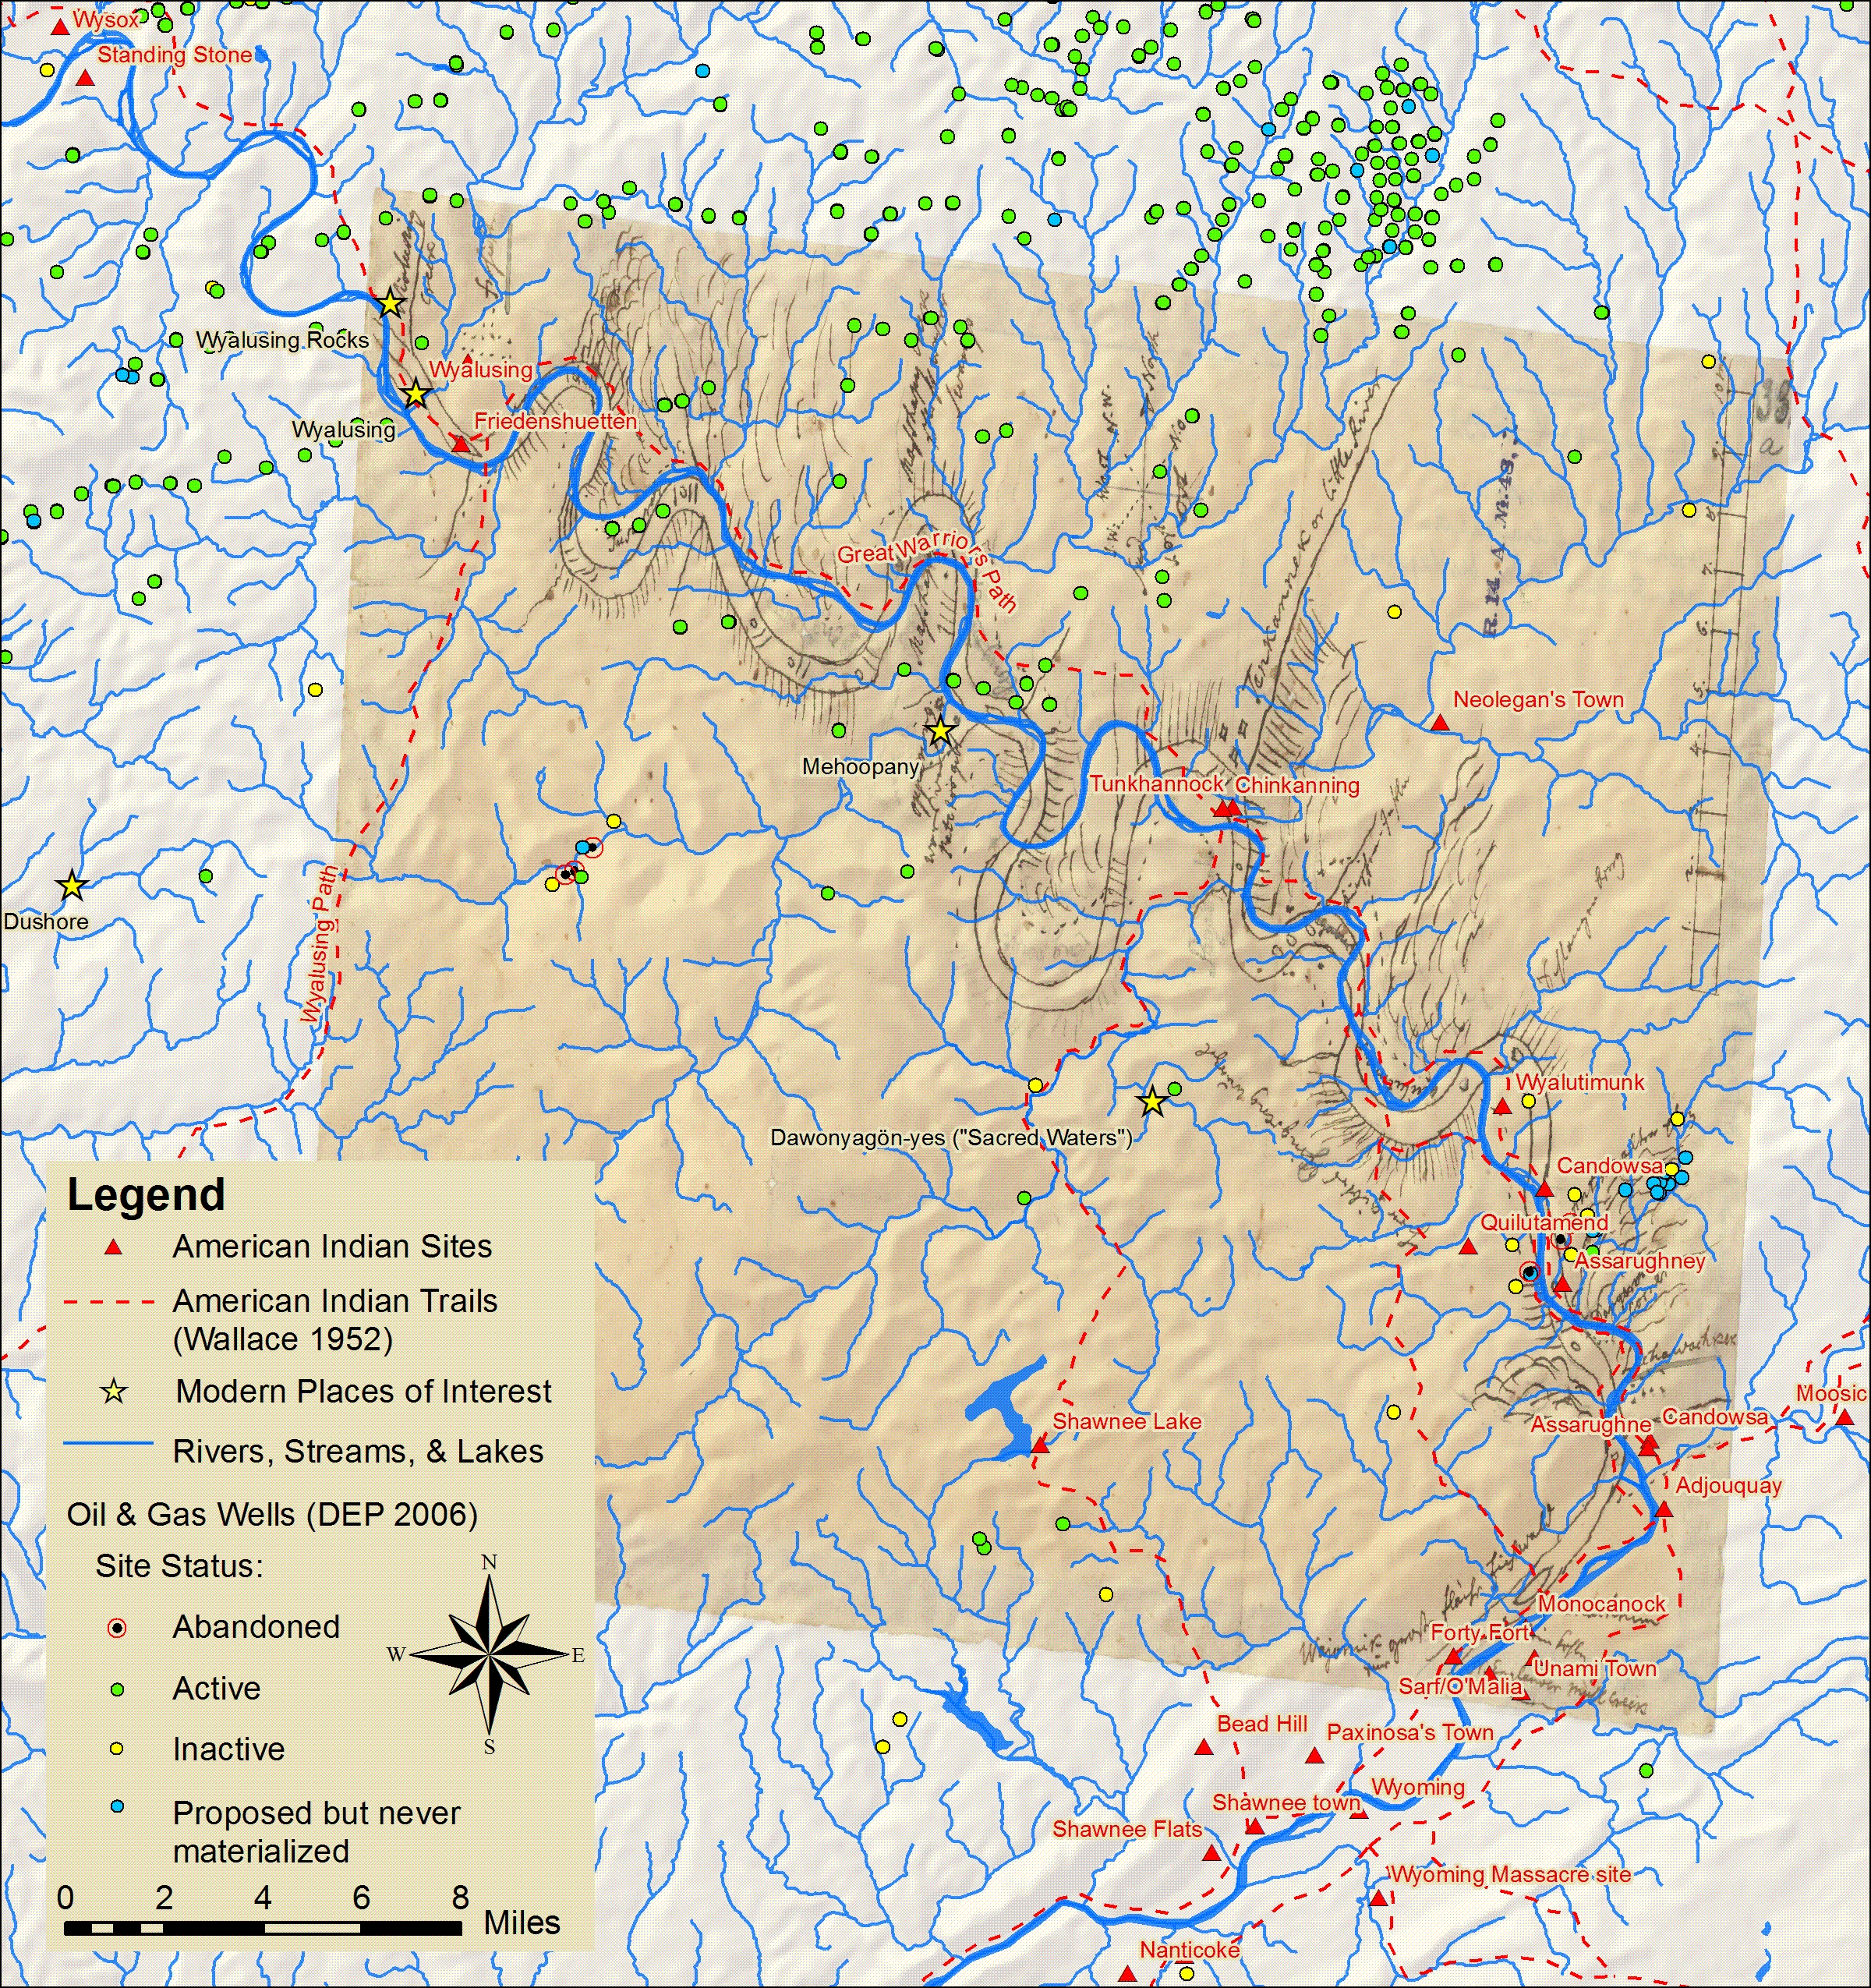
Sample map showing locations of Native American sites, trails and sacred places in relation to Marcellus Shale gas drilling.