Categories
Bucknell/Local Interest Environment General GIS GIS in Geology Marcellus Shale Slideshow

NYT map graphic on toxic contamination from natural gas wells

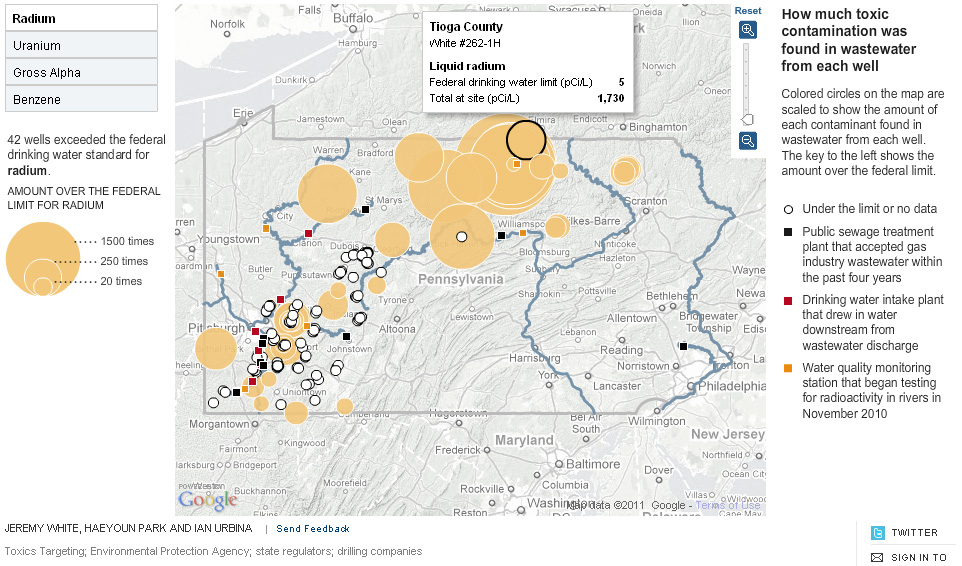
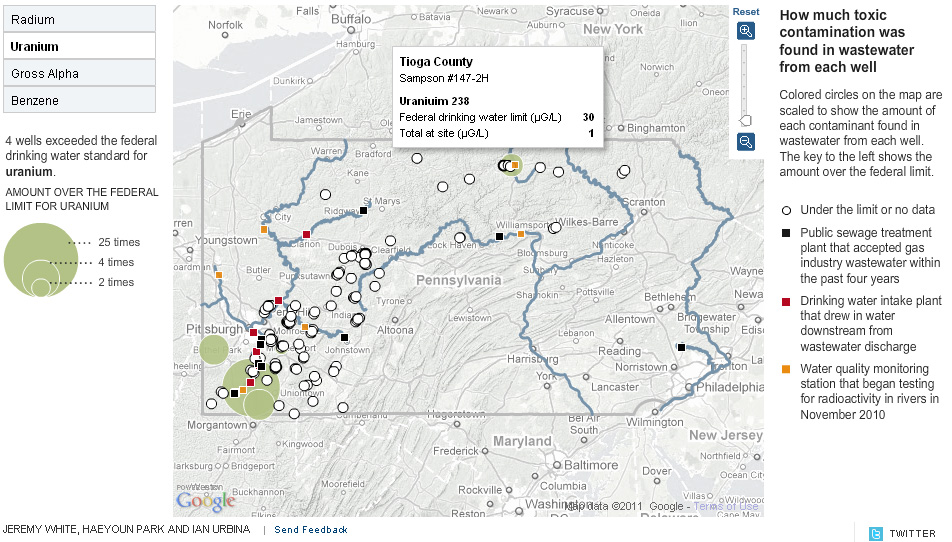
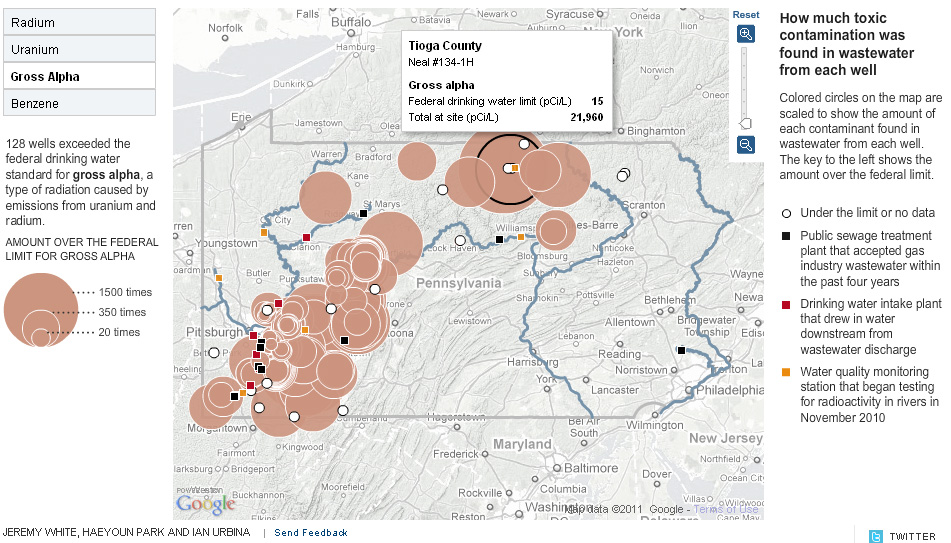
The New York Times has put out a new interactive map graphic that visualizes toxic contamination found in the wastewater from natural gas wells in PA.  The data – from 149 wells – is visualized by the type of contaminant (radium, uranium, gross alpha and benzene) and the amount by which each well exceeded the federal drinking water standard.  Below are some screenshots from the interactive graphic.

Radium contamination:
 

Uranium contamination:
 

Gross alpha contamination:
 

Benzene contamination:


Categories
Bucknell/Local Interest Environment General GIS Marcellus Shale Slideshow

Using GIS to analyze Marcellus Shale impacts in Pennsylvania

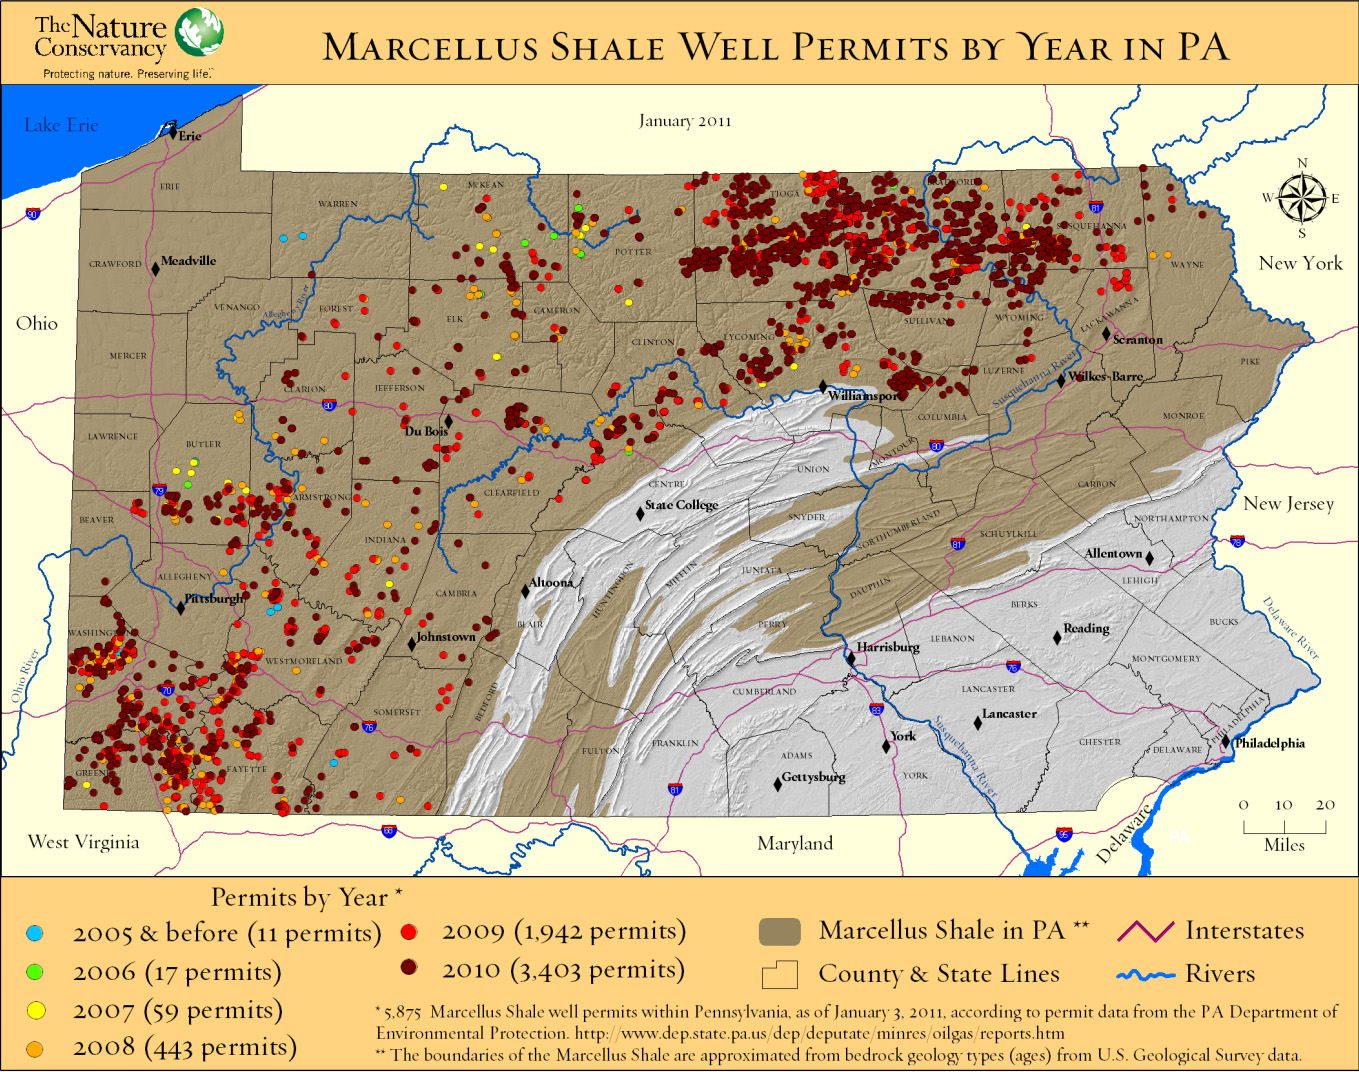
The Nature Conservancy recently released a study analyzing potential habitat impacts of energy development – including Marcellus Shale – in Pennsylvania over the next 20 years. Click here to watch a recorded presentation by the two lead researchers on the project. Click here for a copy of the full report.

The presentation includes discussion of how GIS and spatial analysis were used to project how much energy might be developed in PA during the next 20 years and where that development is more or less likely to occur.

Categories
Bucknell/Local Interest Digital Humanities Environment General GIS GIS in Environmental Studies GIS in Humanities Marcellus Shale Slideshow

Tour the front lines of the Marcellus Shale boom with students from the Susquehanna Valley Summer Writer’s Institute

In Summer 2010, a team of five Bucknell undergrads participated in the Susquehanna Valley Summer Writer’s Institute with the goal of collecting and reporting stories of how the Marcellus Shale gas-drilling boom is transforming communities and cultural landscapes. Given how central geography is to the story of the Marcellus Shale boom, it was quickly agreed that the most powerful way to share this work would be through embedding the emerging, evolving stories into a clickable, interactive map – giving users the ability to interactively explore and engage with the material.  The map for the Summer 2010 project was built using the Google Maps API but plans are underway to implement ArcGIS Server technology to add additional functionality and interactivity.  Thanks to Mike Weaver from ITEC for his work in building the Google Maps site!