Categories
Bucknell/Local Interest Data Environment General GIS Map Apps Slideshow

ChesapeakeView

Maurie Kelly and her team at PASDA (part of the Penn State Institute of Energy and the Environment) have just released ChesapeakeView, a website that provides free access to remotely sensed data about the Chesapeake Bay region. The website currently holds 263 datasets related to the Chesapeake Bay region – including remotely sensed data as well as habitat, land use, biodiversity, wildlife distribution, historical aerial photos, agricultural imagery, digital coastline images and other types of environmental data related to the region.

“No simple place existed to find remote sensing information about land use, habitat changes and biodiversity,” said Maurie Caitlin Kelly, director of informatics, Penn State Institutes of Energy and the Environment. “Researchers could spend days searching to find whatever data might be available.”

The data interface for ChesapeakeView will look familiar to anyone who has used PASDA’s website.  There are options for downloading the data via FTP, using an internet based data viewer/map tool or streaming it directly into your ArcMap session. ChesapeakeView is part of the AmericaView initiative.
Categories
Crisis-Mapping General GIS GIS in Political Science Map Apps Slideshow

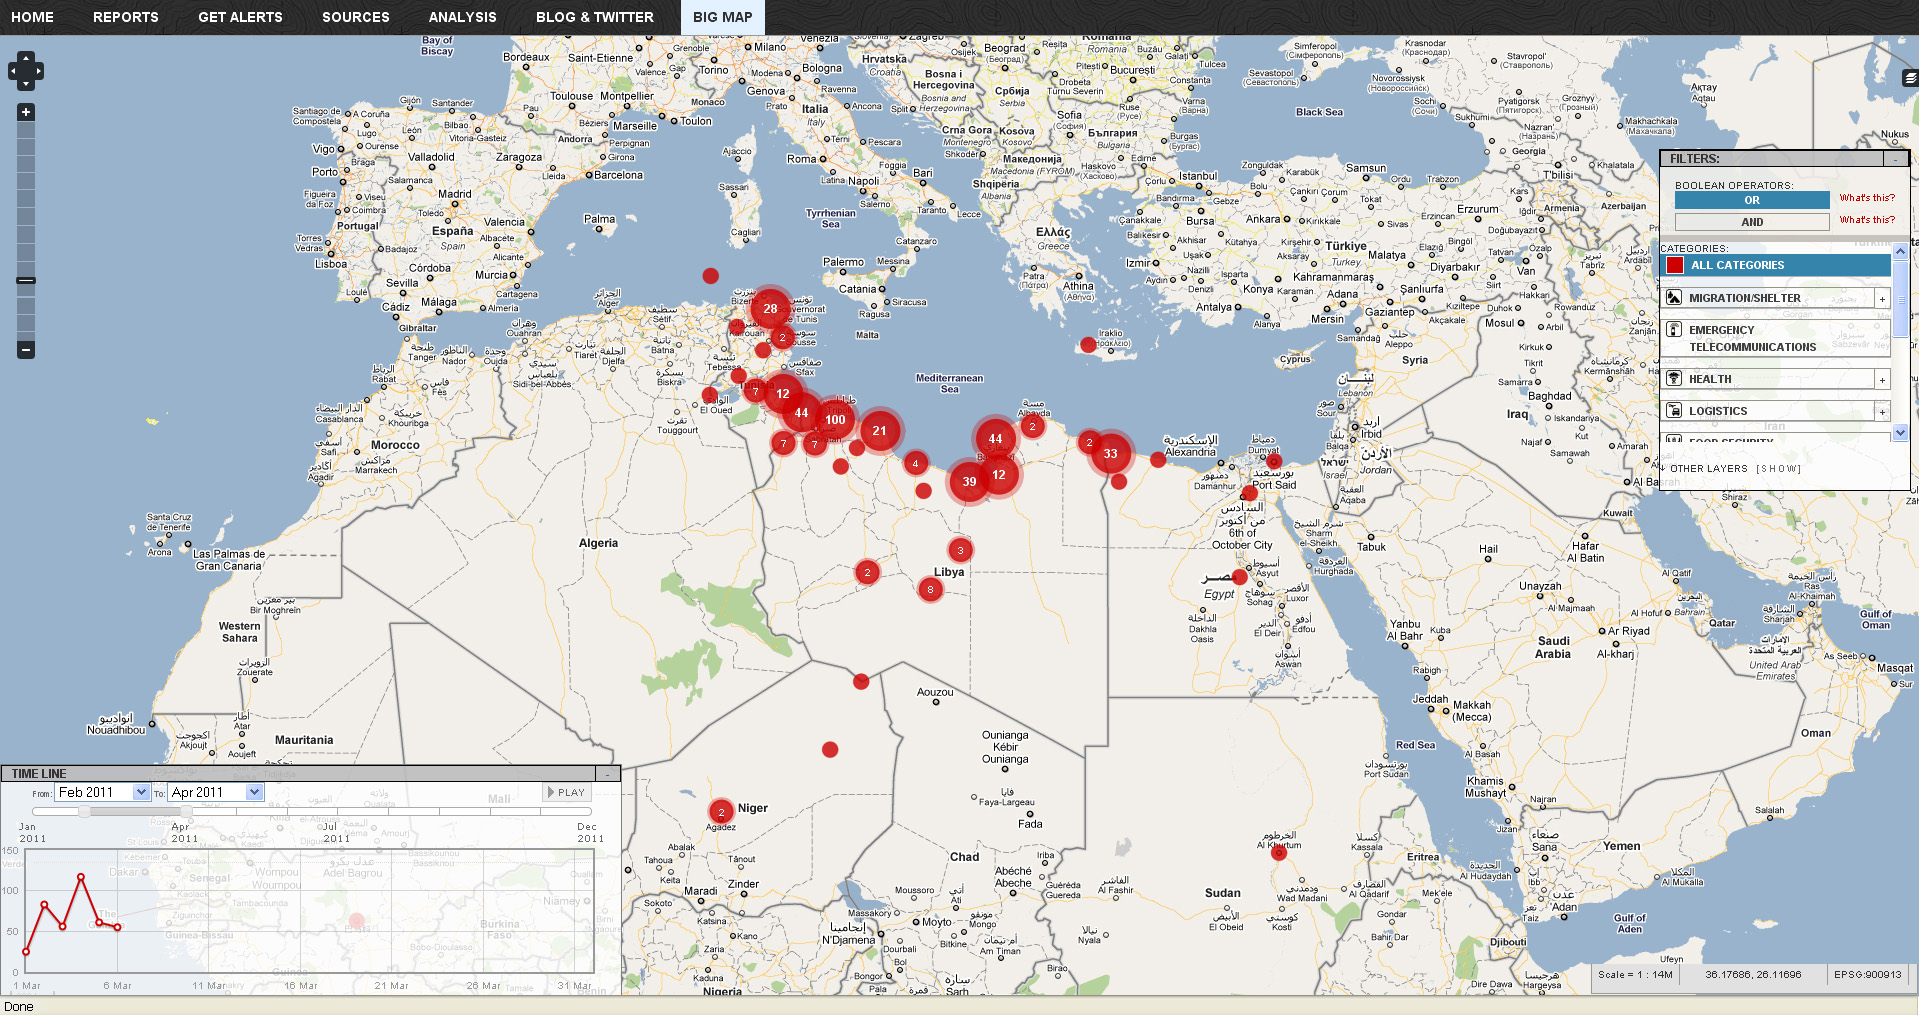
Libya crisis map

Click here to check out the new Libya Crisis Map.  Courtesy of Adena Schutzberg over at AllPointsBlog:

OCHA, UNOSAT and NetHope have been collaborating with the Volunteer Technical Community (VTC) specifically CrisisMappers, Crisis Commons, Open Street Map, and the Google Crisis Response Team over the past week.

The CrisisMappers Standby Task Force has been undertaking a mapping of social media, news reports and official situation reports from within Libya and along the borders at the request of OCHA. The Task Force is also aiding in the collection and mapping of 3W information for the response. UNOSAT is kindly hosting the Common Operational Datasets to be used during the emergency. Interaction with these groups is being coordinated by OCHA’s Information Services Section.

The public version of this map does not include personal identifiers and does not include descriptions for the reports mapped. This restriction is for security reasons. All information included on this map is derived from information that is already publicly available online


Categories
Bucknell/Local Interest Crisis-Mapping General GIS GIS in Political Science GIS in Public Health Slideshow Videos

Penn State releases episode 3 of “Geospatial Revolution” series

A new episode of Penn State’s “Geospatial Revolution” project was released today.  With the tagline “the location of anything is becoming everything” the Geospatial Revolution series is produced by Penn State’s public broadcasting group and described as an “an integrated public service media and outreach initiative about the world of digital mapping and how it is changing the way we think, behave, and interact.”  The new episode – part 3 in a 4 part series – focuses on using GIS for public safety and military/defense purposes. Episode 4 is due out on May 1, 2011. See below for the full-length videos for episodes 1, 2 and 3.  Videos are also available for individual chapters within each episode.

Episode 1:

  • Chapter 1 –  Welcome to the Geospatial Revolution
  • Chapter 2-  A look at what GPS is and how it works
  • Chapter 3 – A timeline of mapping and geospatial technology from stones to phones, including mobile technologies
  • Chapter 4 – A look at how crisis mapping and global crowd-sourcing was critical to aid and rescue during the 2010 Haiti earthquake

httpv://www.youtube.com/watch?v=poMGRbfgp38

Episode 2:

  • Chapter 1 – Creating an interactive city
  • Chapter 2 – Powering business
  • Chapter 3 – Finding a healthy future

httpv://www.youtube.com/watch?v=GXS0bsR0e7w

Episode 3:

  • Chapter 1 – Mapping the road to peace
  • Chapter 2 – Waging modern war
  • Chapter 3 – Serving and protecting
  • Chapter 4 – Staying safe

httpv://www.youtube.com/watch?v=OePOK6nzcaY

Categories
Bucknell/Local Interest General GIS GIS in Environmental Studies GIS in Geography Slideshow

Bucknell student uses ArcGIS in research on sleeping sickness

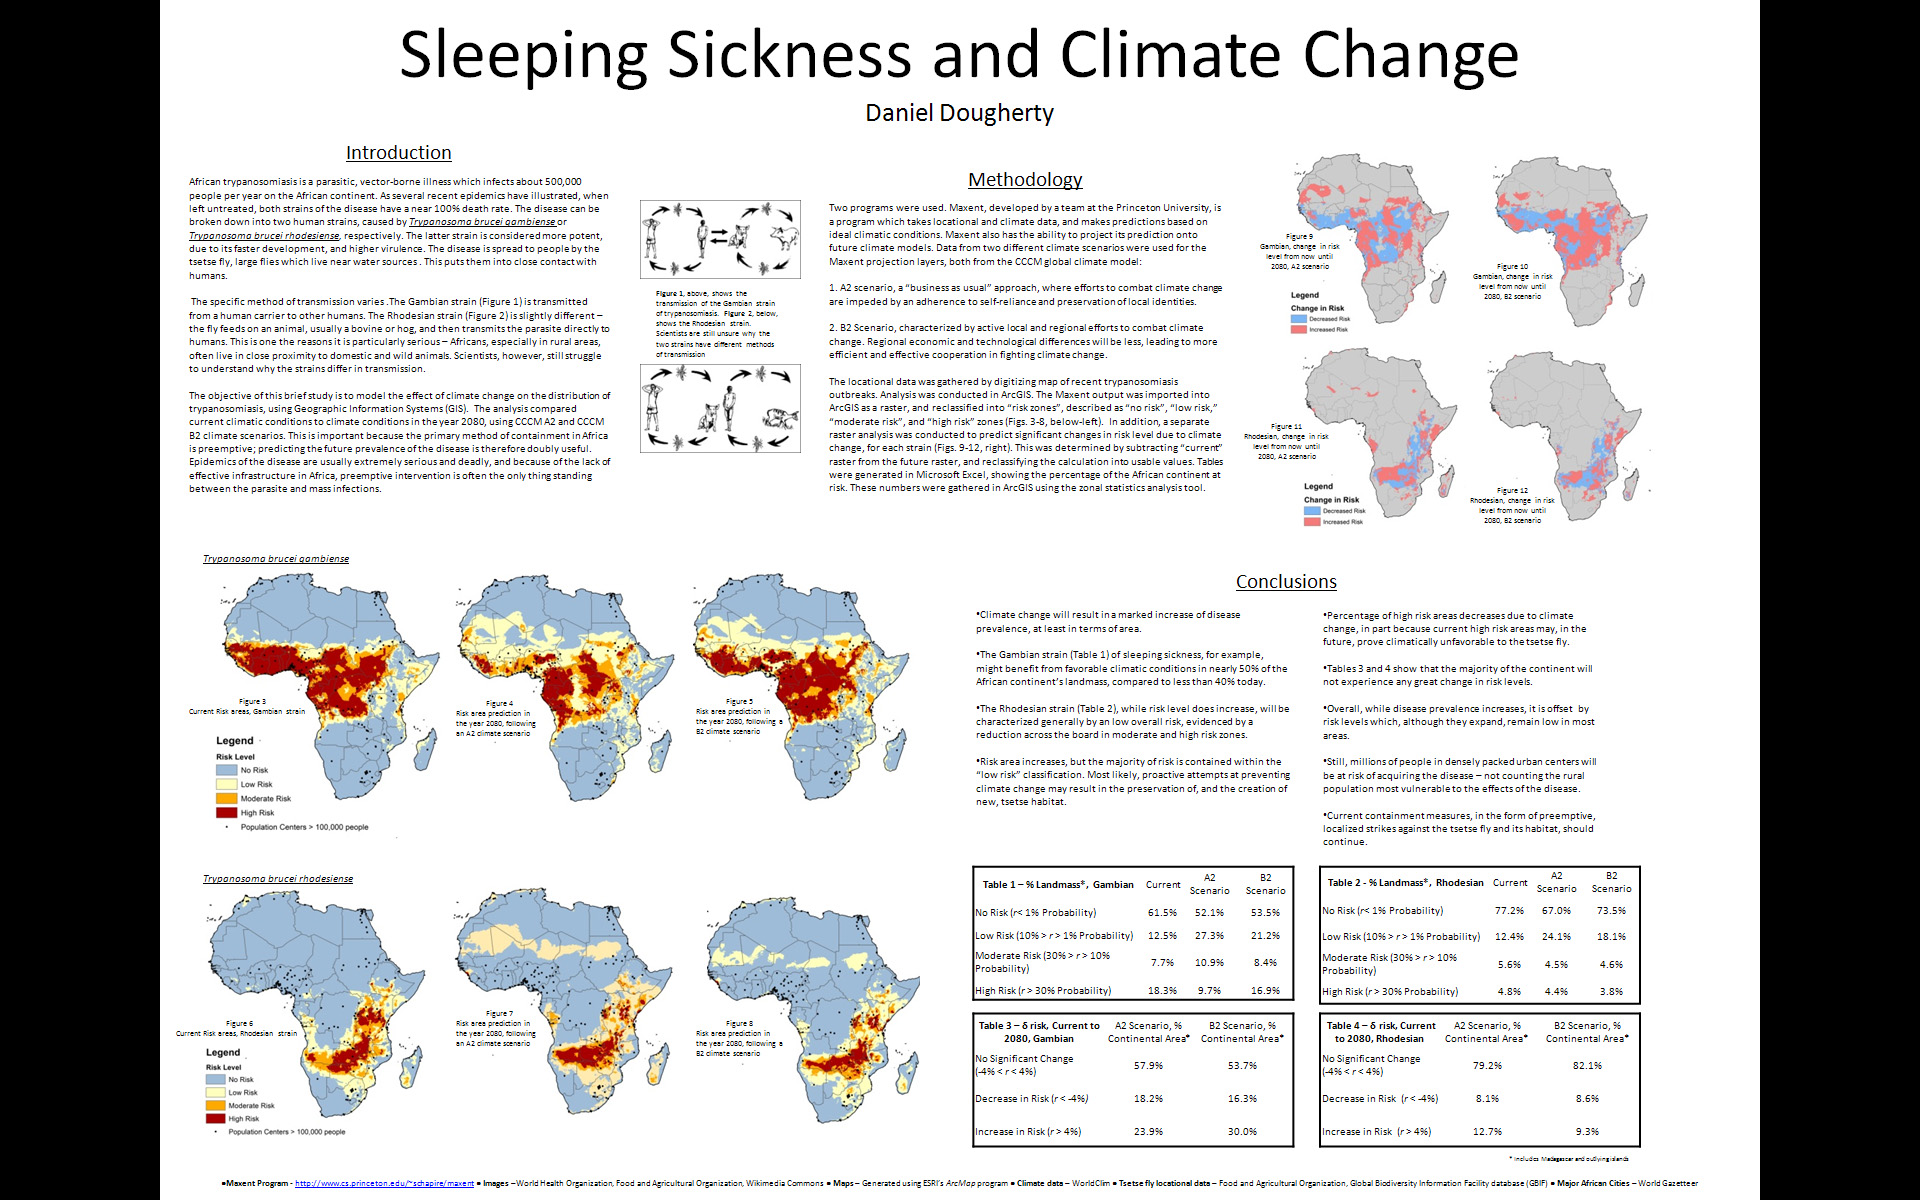
Below is an interview with Daniel Dougherty ’12, a History and Geography major, discussing his use of GIS for an analysis of the impact of climate change on sleeping sickness.  The research project was conducted as part of Prof. Duane Griffin’s Geography 204 course Applied GIS. In the interview, Dougherty describes the data and methodology he used for the project and talks about some of the conclusions he drew from his analysis.

httpv://www.youtube.com/watch?v=UsJf29_Mujw

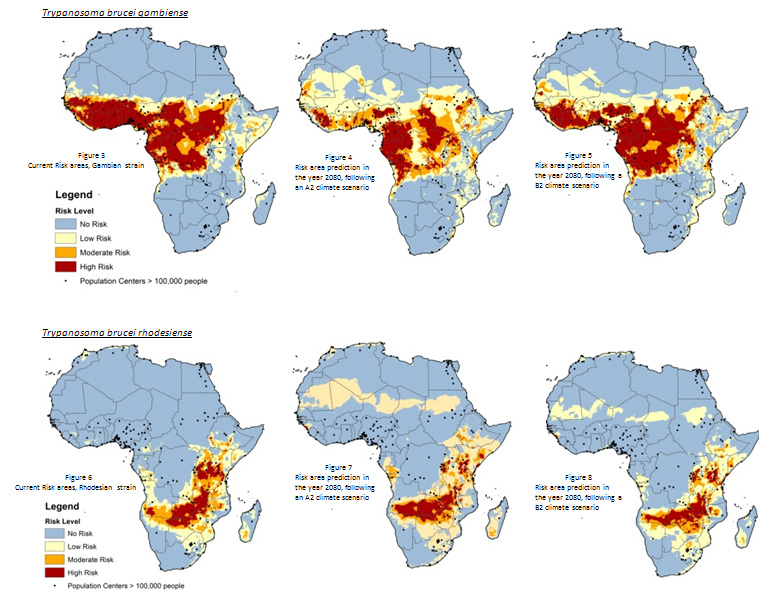
The images below show some of the maps Dougherty was able to produce using ArcGIS, MaxEnt and data from WorldClim.

Categories
Bucknell/Local Interest Crisis-Mapping Digital Humanities General GIS GIS in Environmental Studies GIS in Geography GIS in History GIS in Humanities GIS in Political Science GIS in Public Health GIS in Sociology Map Apps Slideshow

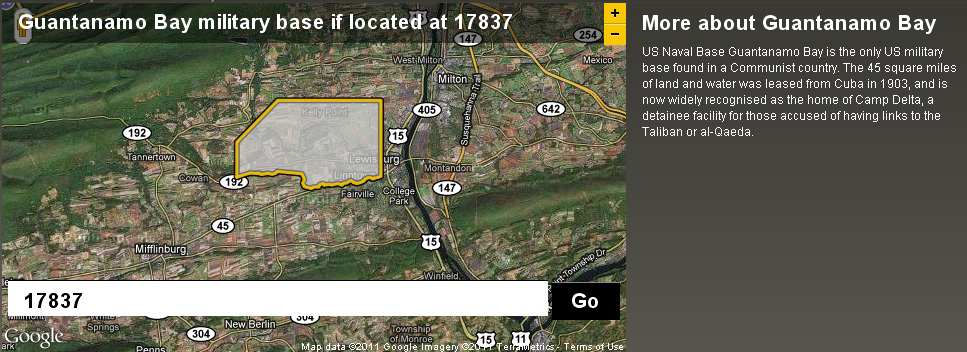
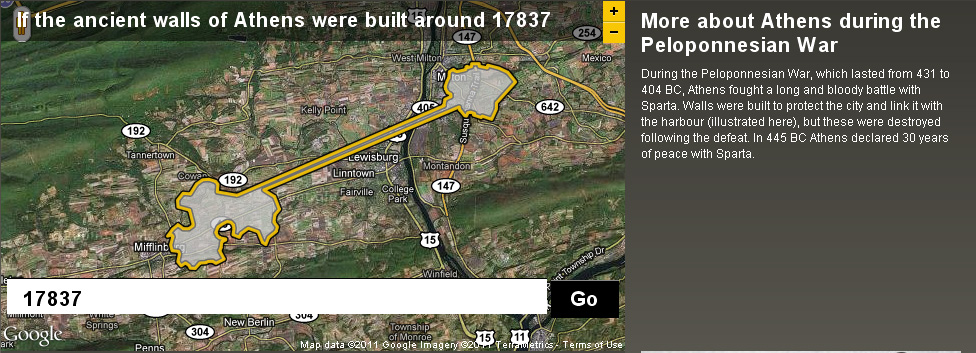
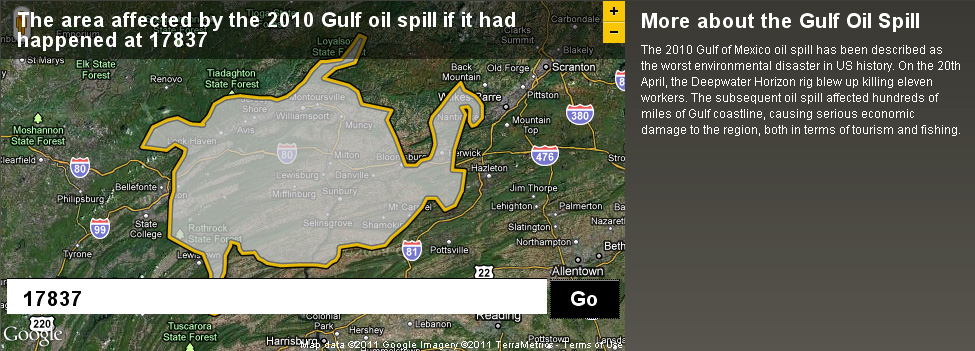
How big is it really?

Back in December I posted about an NPR story about map scale.  I got so excited about the baseball on the moon map that I neglected to point out the other really interesting link from the story – to the BBC Dimensions website.  Dimensions (or, ‘howbigisitreally’) has a tool that lets you plug in any zip code or location and then choose from a list of events, places or things that you want to superimpose onto your area. See below for a map showing the area that the Guantanamo Bay Naval base would occupy if it was located in Lewisburg. I’ve also included maps showing what the ancient walls of Athens and the Gulf oil spill would look like if superimposed over the Lewisburg area. The Dimensions website has numerous places, events and things to choose from in making your map, including: the war on terror, ancient worlds, the industrial age, space, environmental disasters, depths, cities in history and more.