Follow the events unfolding in Egypt in real-time by using the Egypt Events Map to track social media posts in the region. The interactive map app is hosted by ESRI and provides live feeds from Twitter, YouTube and Flicker.
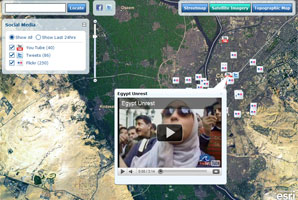
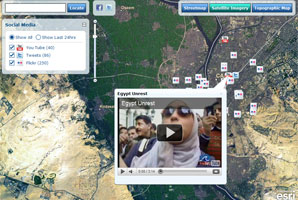
Follow the events unfolding in Egypt in real-time by using the Egypt Events Map to track social media posts in the region. The interactive map app is hosted by ESRI and provides live feeds from Twitter, YouTube and Flicker.
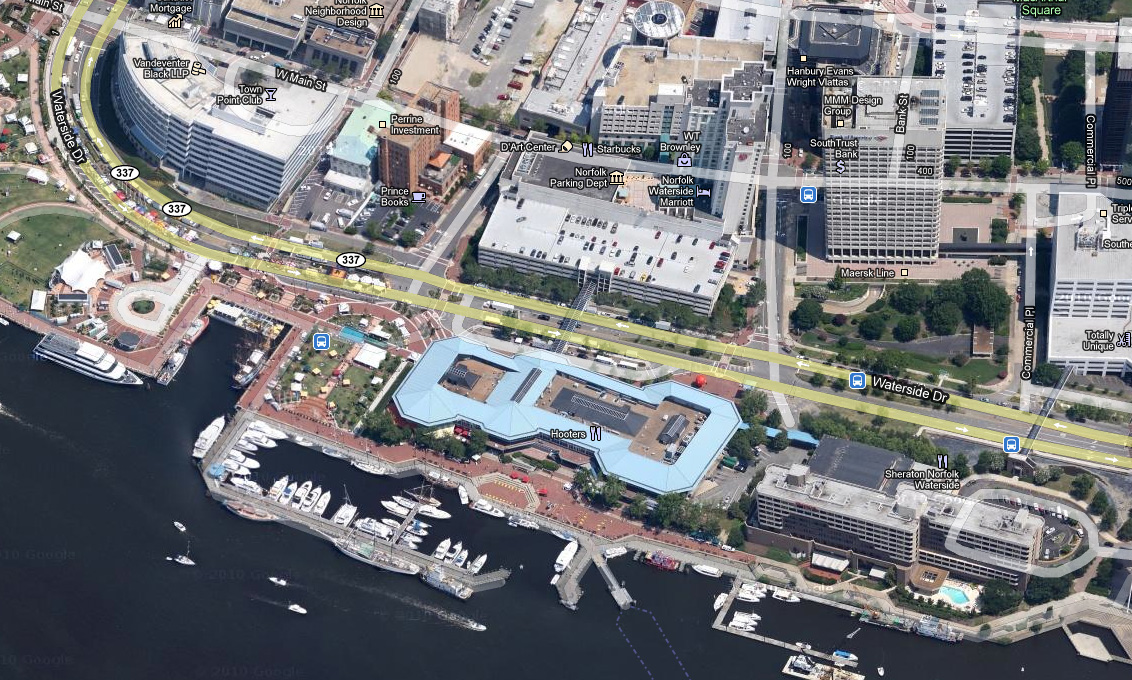
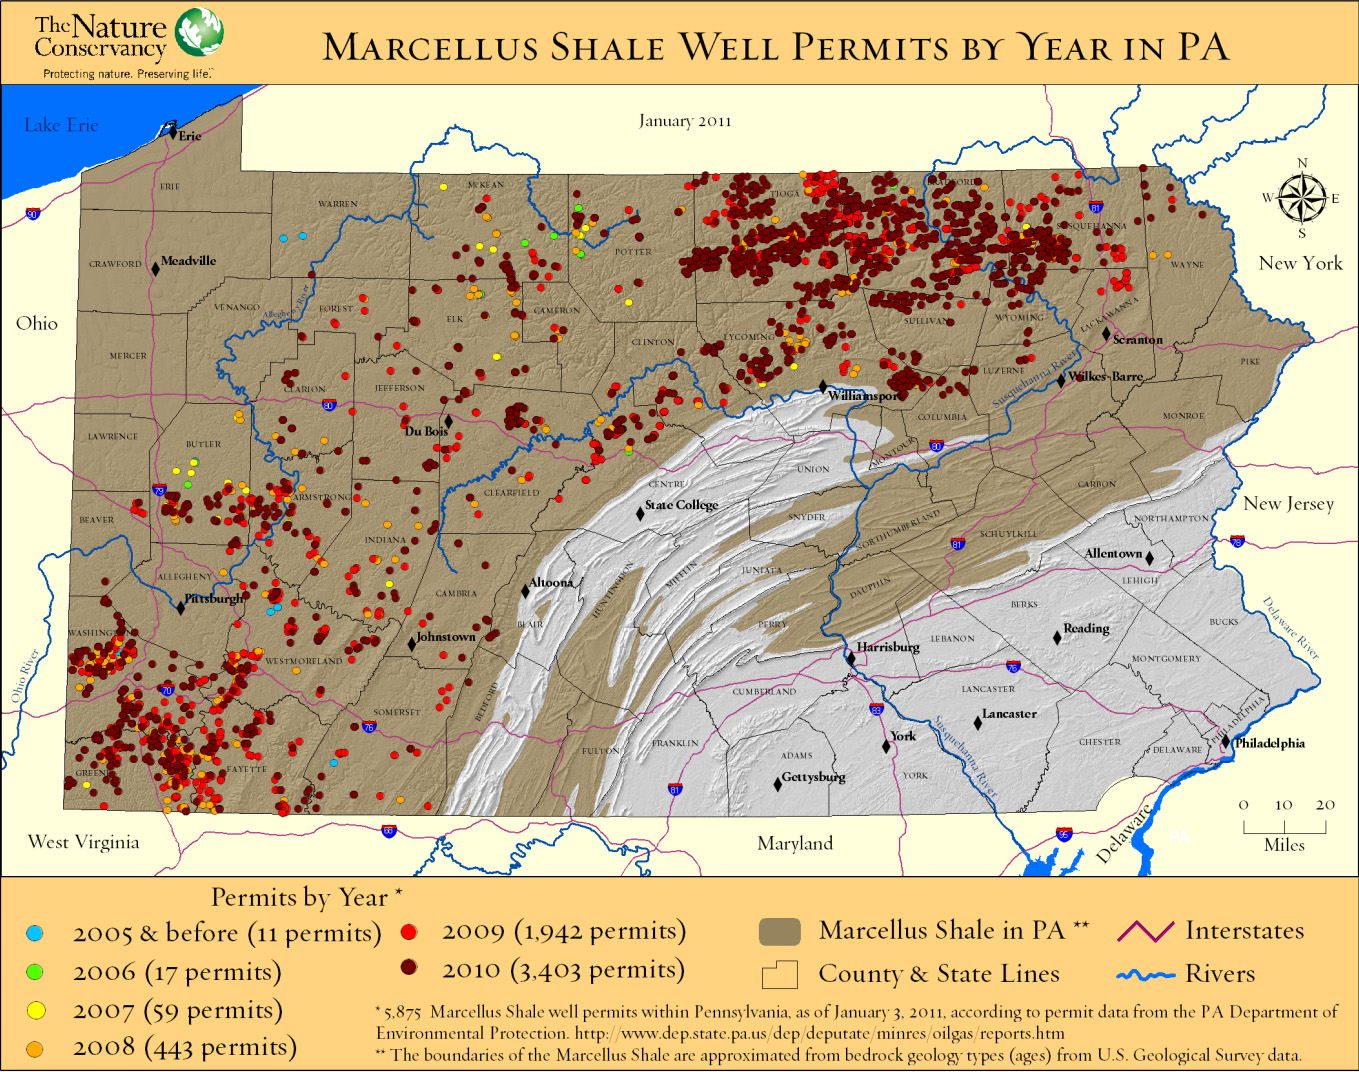
The Nature Conservancy recently released a study analyzing potential habitat impacts of energy development – including Marcellus Shale – in Pennsylvania over the next 20 years. Click here to watch a recorded presentation by the two lead researchers on the project. Click here for a copy of the full report.
The presentation includes discussion of how GIS and spatial analysis were used to project how much energy might be developed in PA during the next 20 years and where that development is more or less likely to occur.
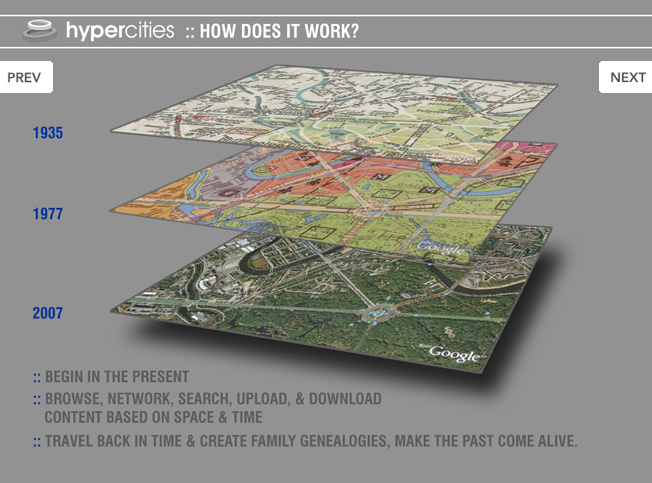
Click here (click on link for ‘Archived Program Recording’ in upper right hand corner) to watch a recorded presentation about two exciting digital humanities projects that have been built around GIS and other geospatial technologies.
The presentation, part of the NITLE next Digital Scholarship Seminar Series includes presentations by Scott Nesbit (Assoc. Director of the Digital Scholarship Lab) and Todd Presner (Director, Germanic Languages, Comparative Literature, and Digital Humanities, UCLA) onThe History Engine and Hypercities projects, respectively.
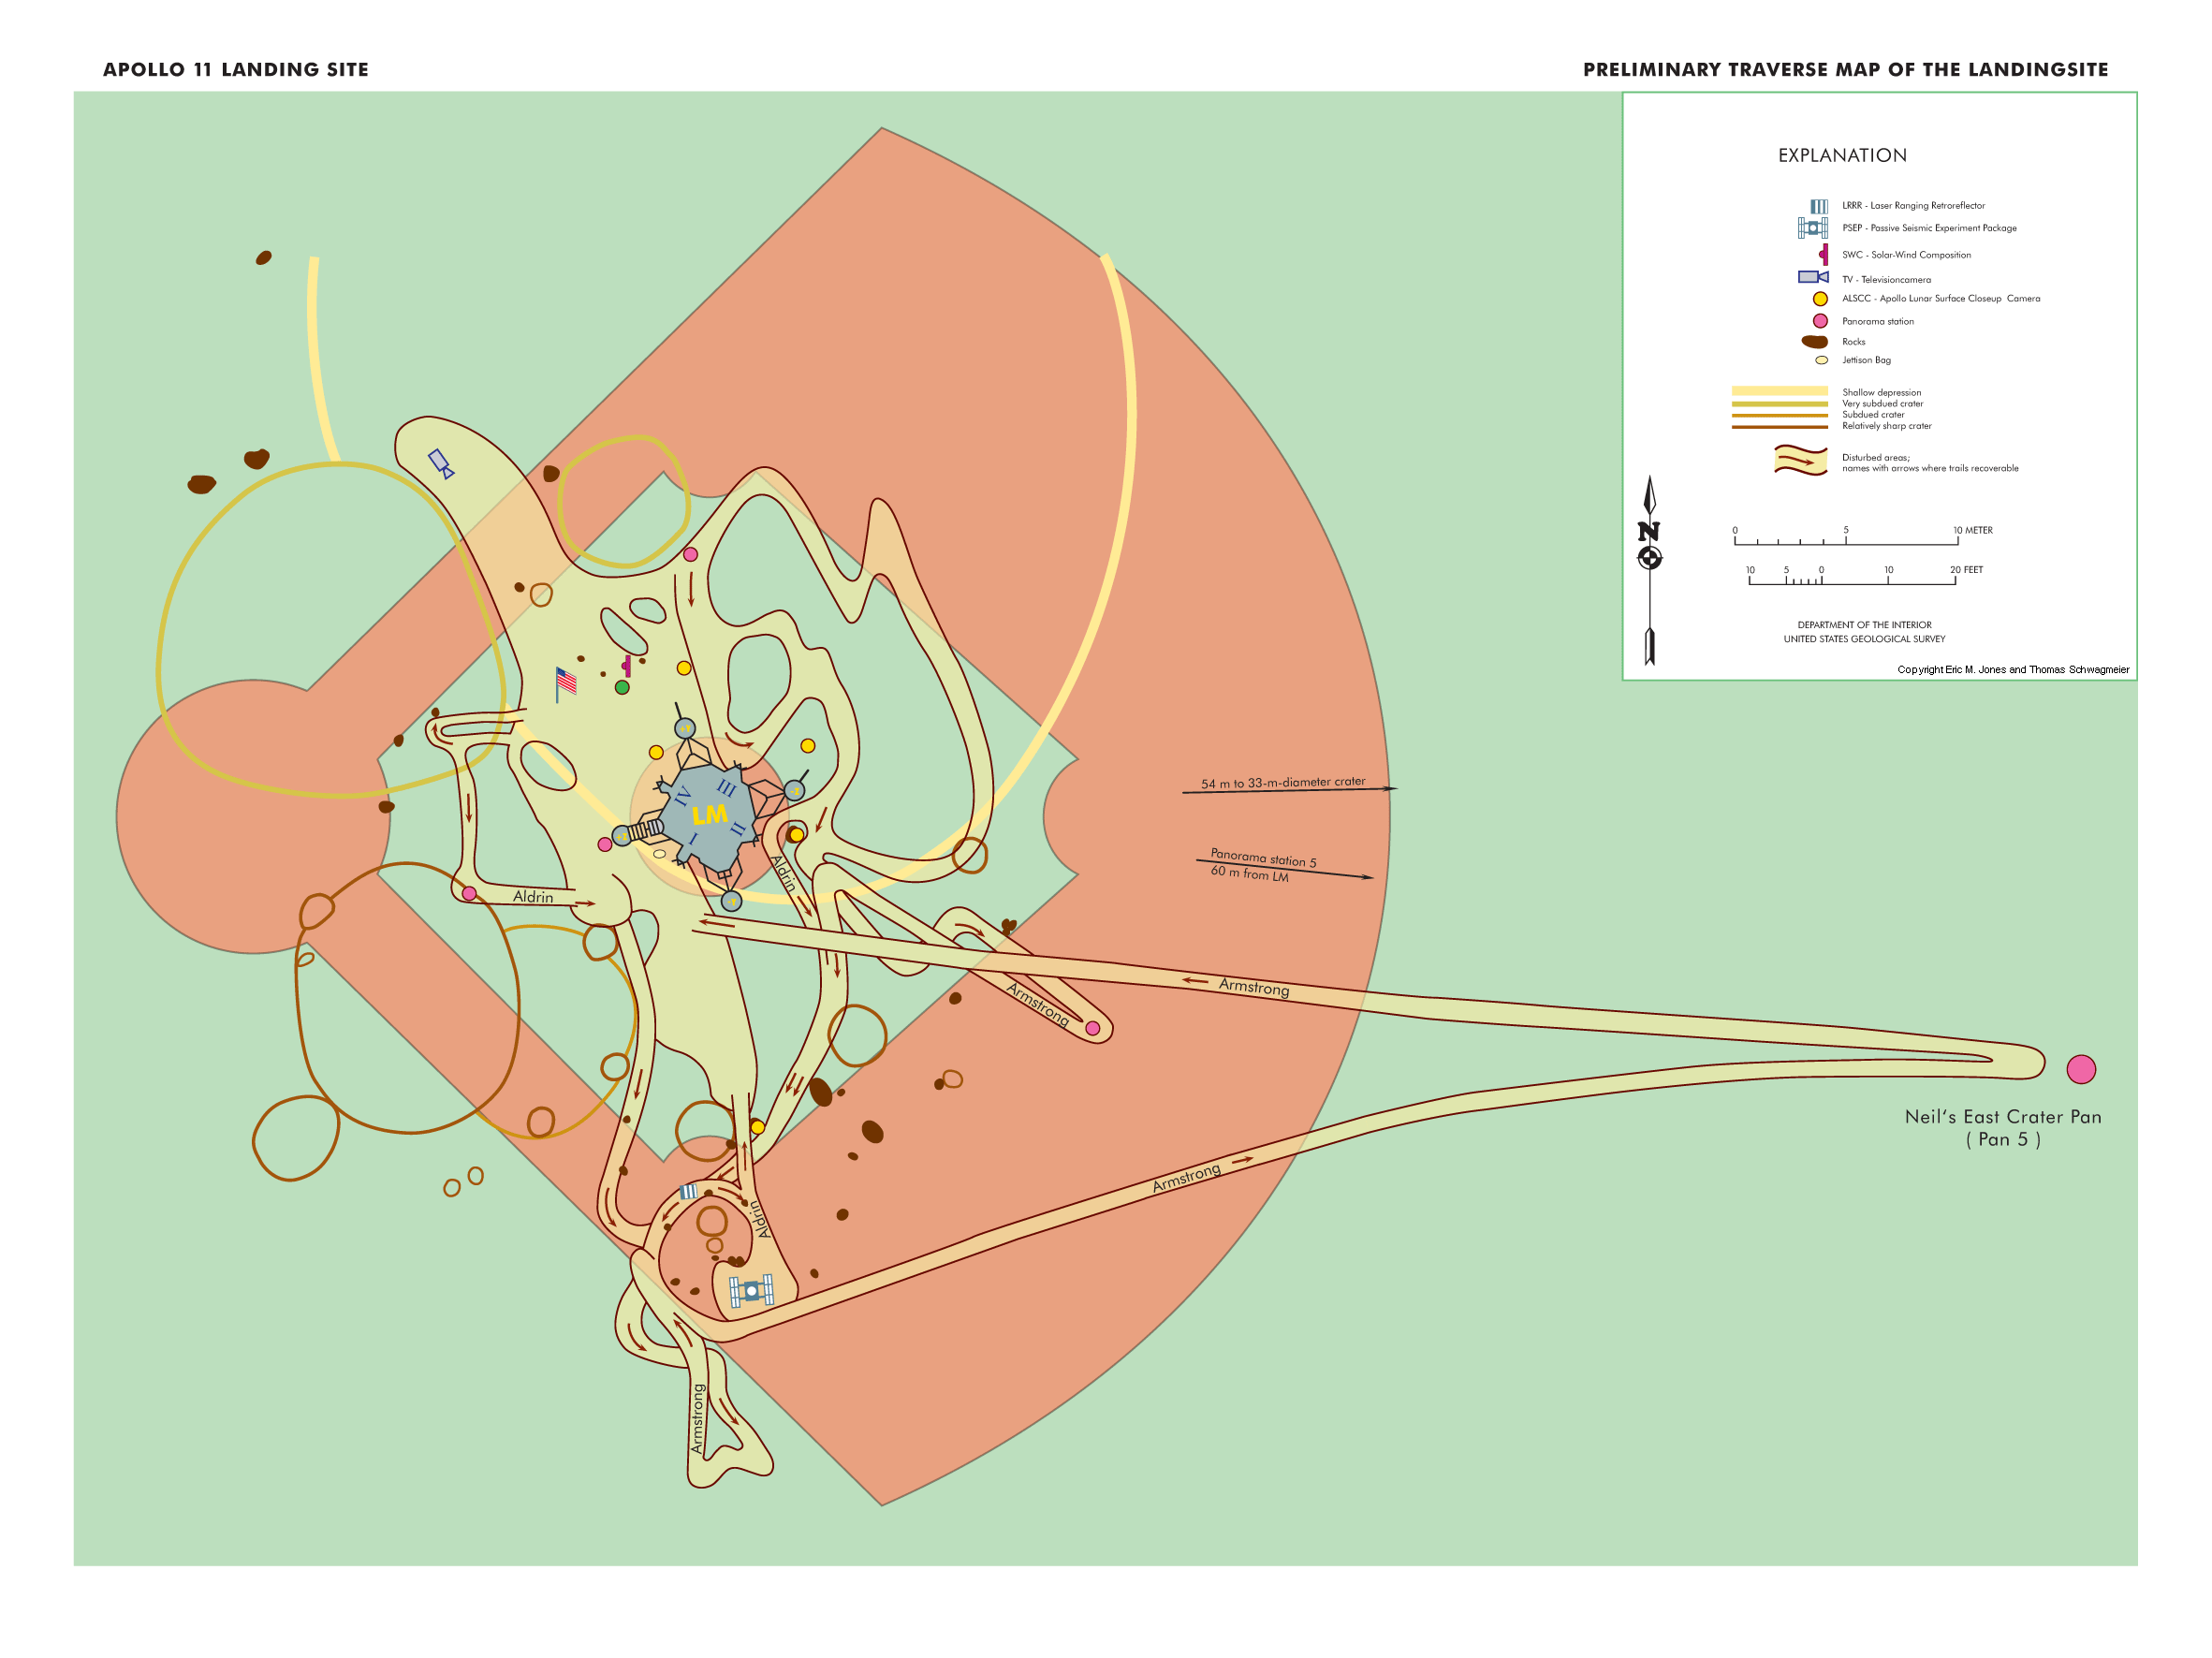
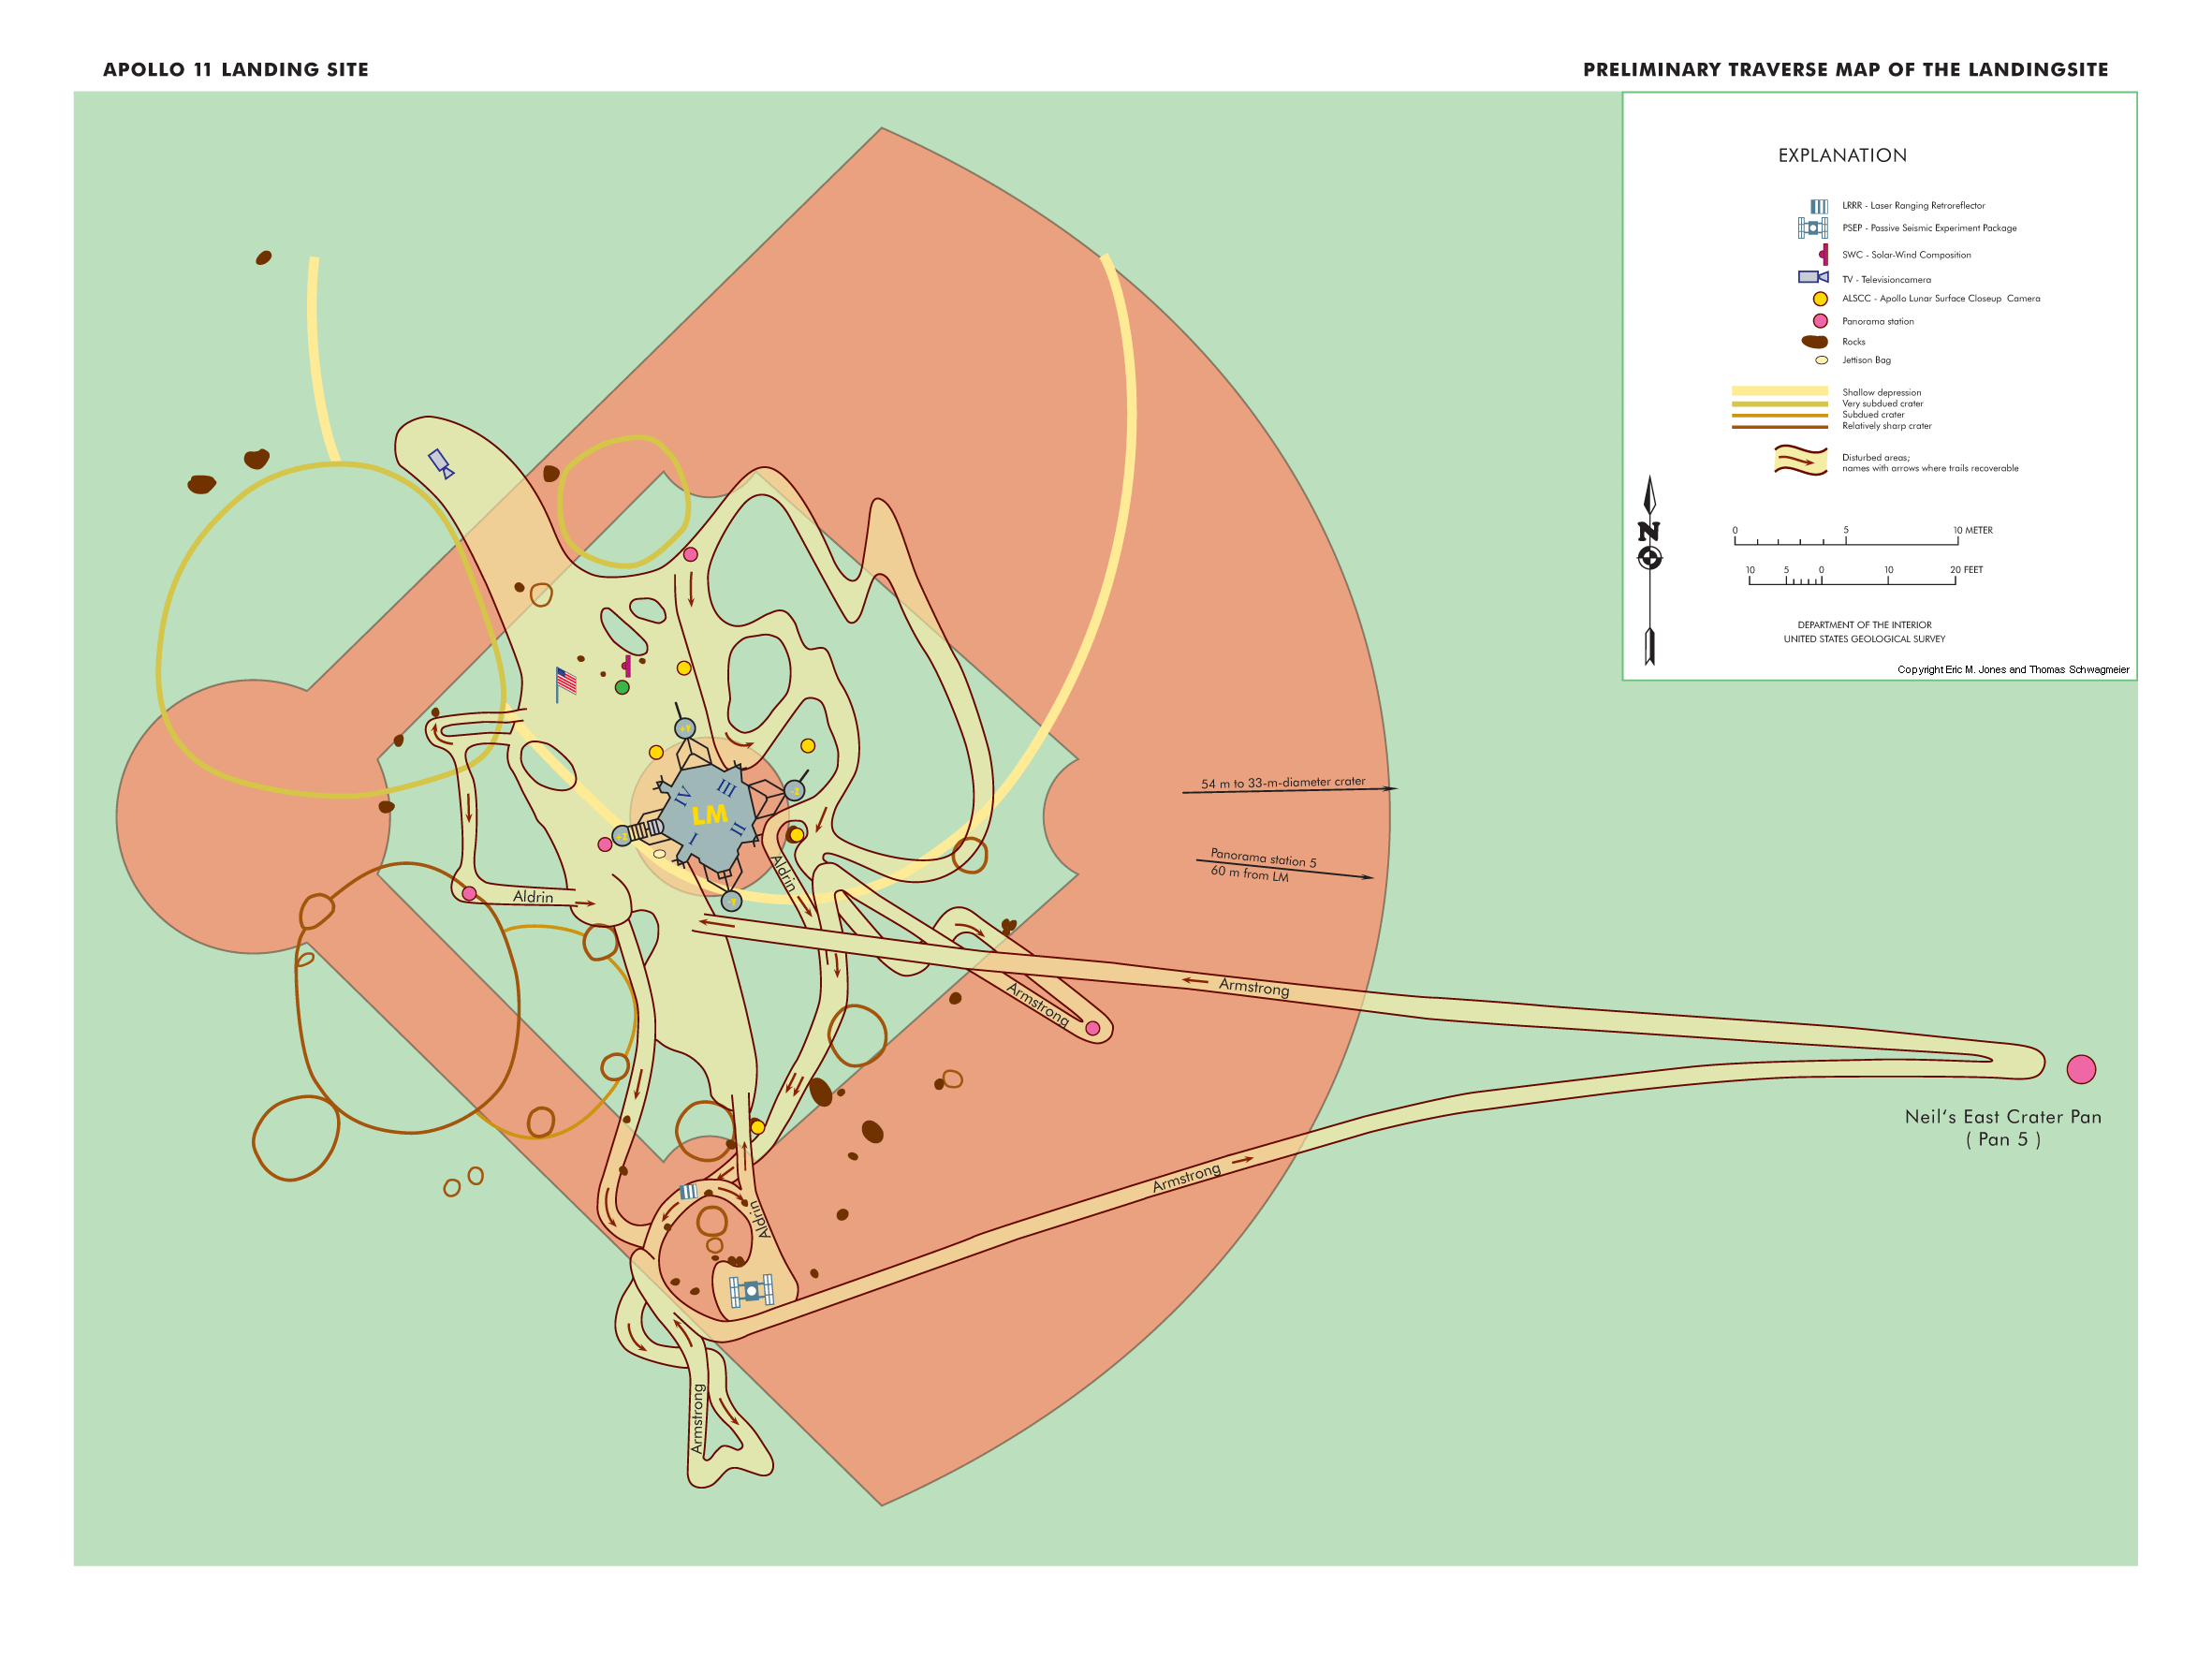
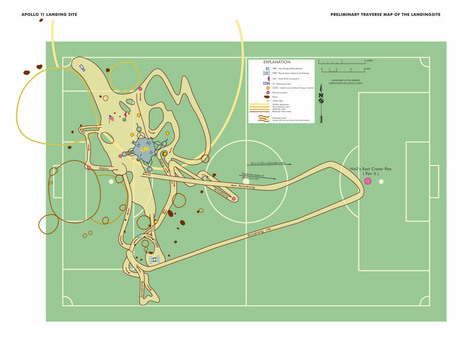
Here’s a link to an interesting NPR story about scale. It highlights a new map from Frank Jacobs (from the Strange Maps blog) that superimposes a map of Neil Armstrong and Buzz Aldrin’s 1969 moon walks onto a baseball field to better convey the scale involved. Jacobs’ map is actually a re-make of a NASA map that superimposed the moon walk route onto a soccer field (see below).