Categories
Bucknell/Local Interest Crisis-Mapping Digital Humanities General GIS GIS in Environmental Studies GIS in Geography GIS in History GIS in Humanities GIS in Political Science GIS in Public Health GIS in Sociology Map Apps Slideshow

How big is it really?

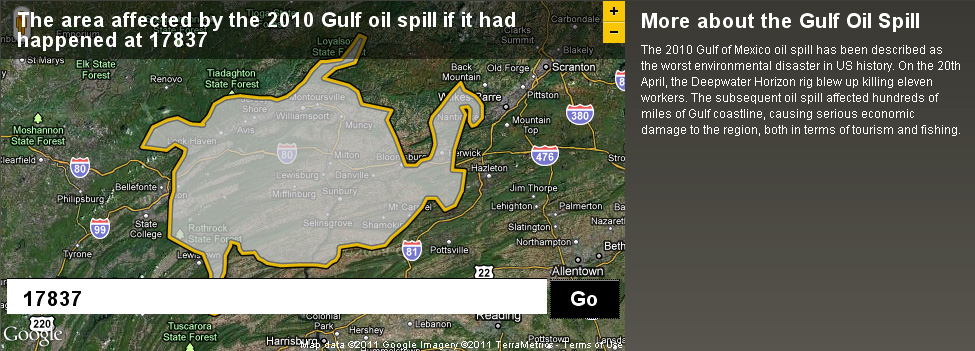
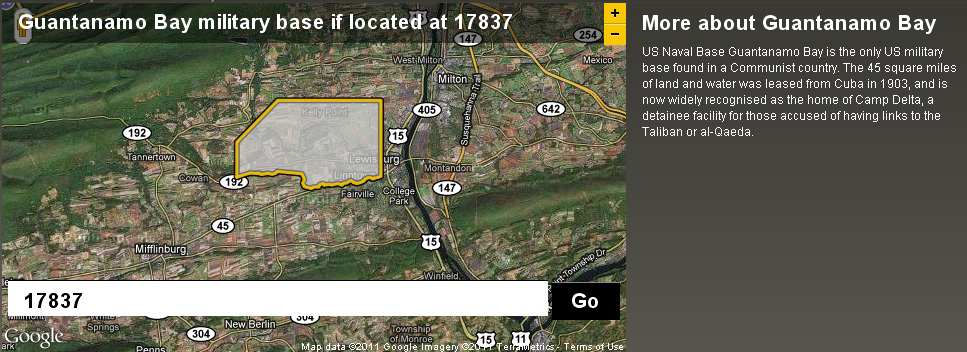
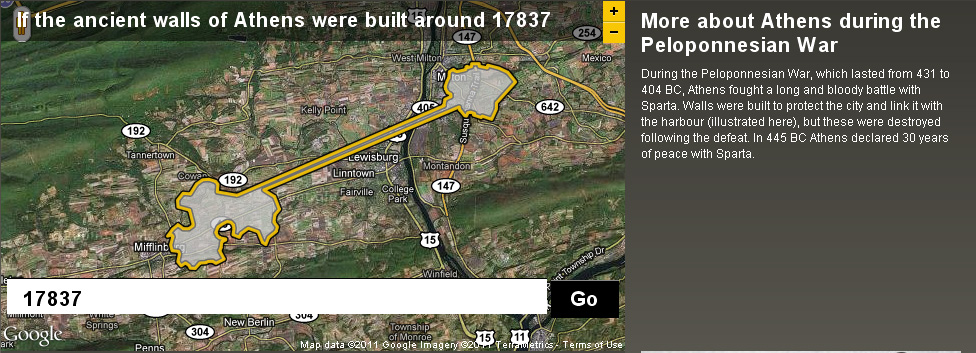
Back in December I posted about an NPR story about map scale.  I got so excited about the baseball on the moon map that I neglected to point out the other really interesting link from the story – to the BBC Dimensions website.  Dimensions (or, ‘howbigisitreally’) has a tool that lets you plug in any zip code or location and then choose from a list of events, places or things that you want to superimpose onto your area. See below for a map showing the area that the Guantanamo Bay Naval base would occupy if it was located in Lewisburg. I’ve also included maps showing what the ancient walls of Athens and the Gulf oil spill would look like if superimposed over the Lewisburg area. The Dimensions website has numerous places, events and things to choose from in making your map, including: the war on terror, ancient worlds, the industrial age, space, environmental disasters, depths, cities in history and more.
Categories
Data General GIS Map Apps Slideshow

Map your name

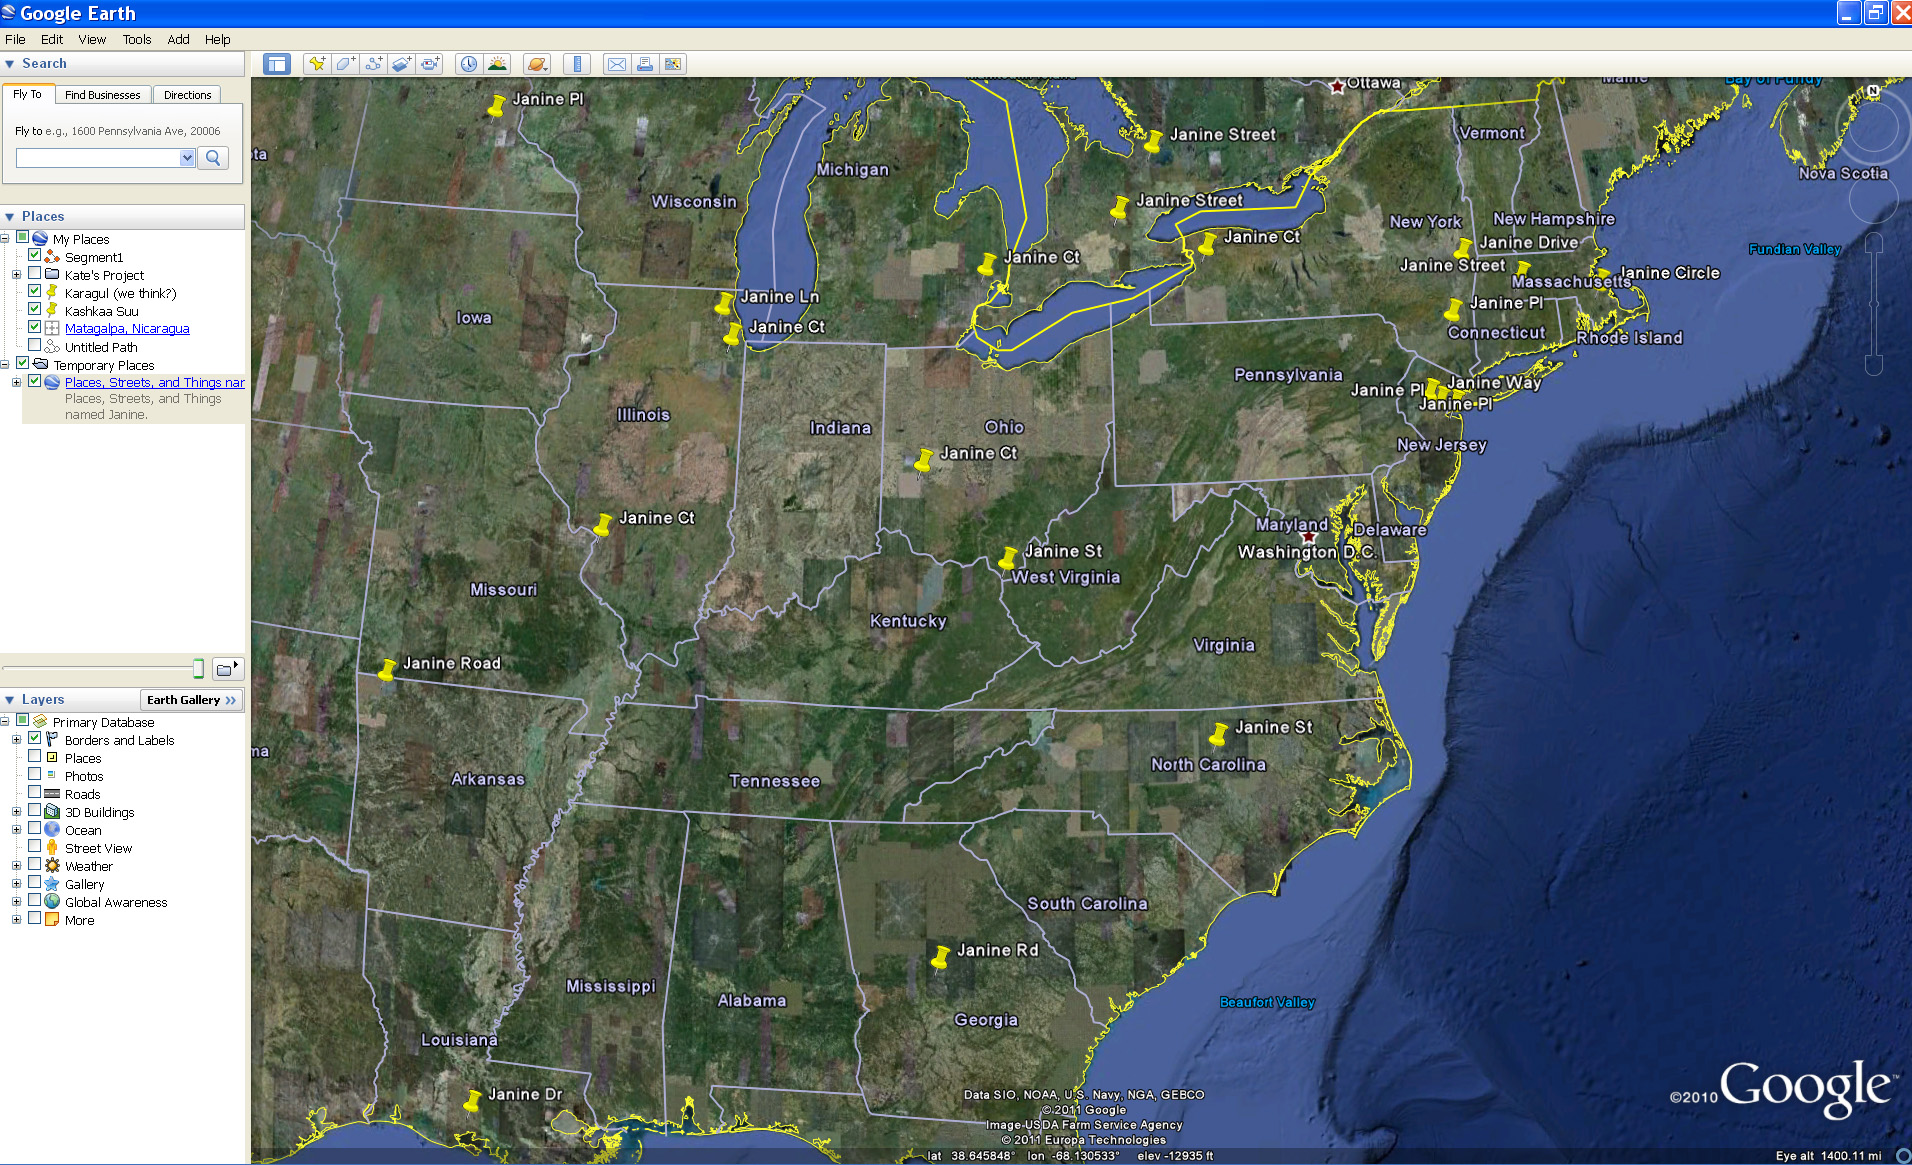
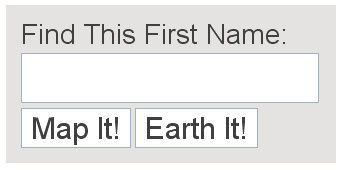
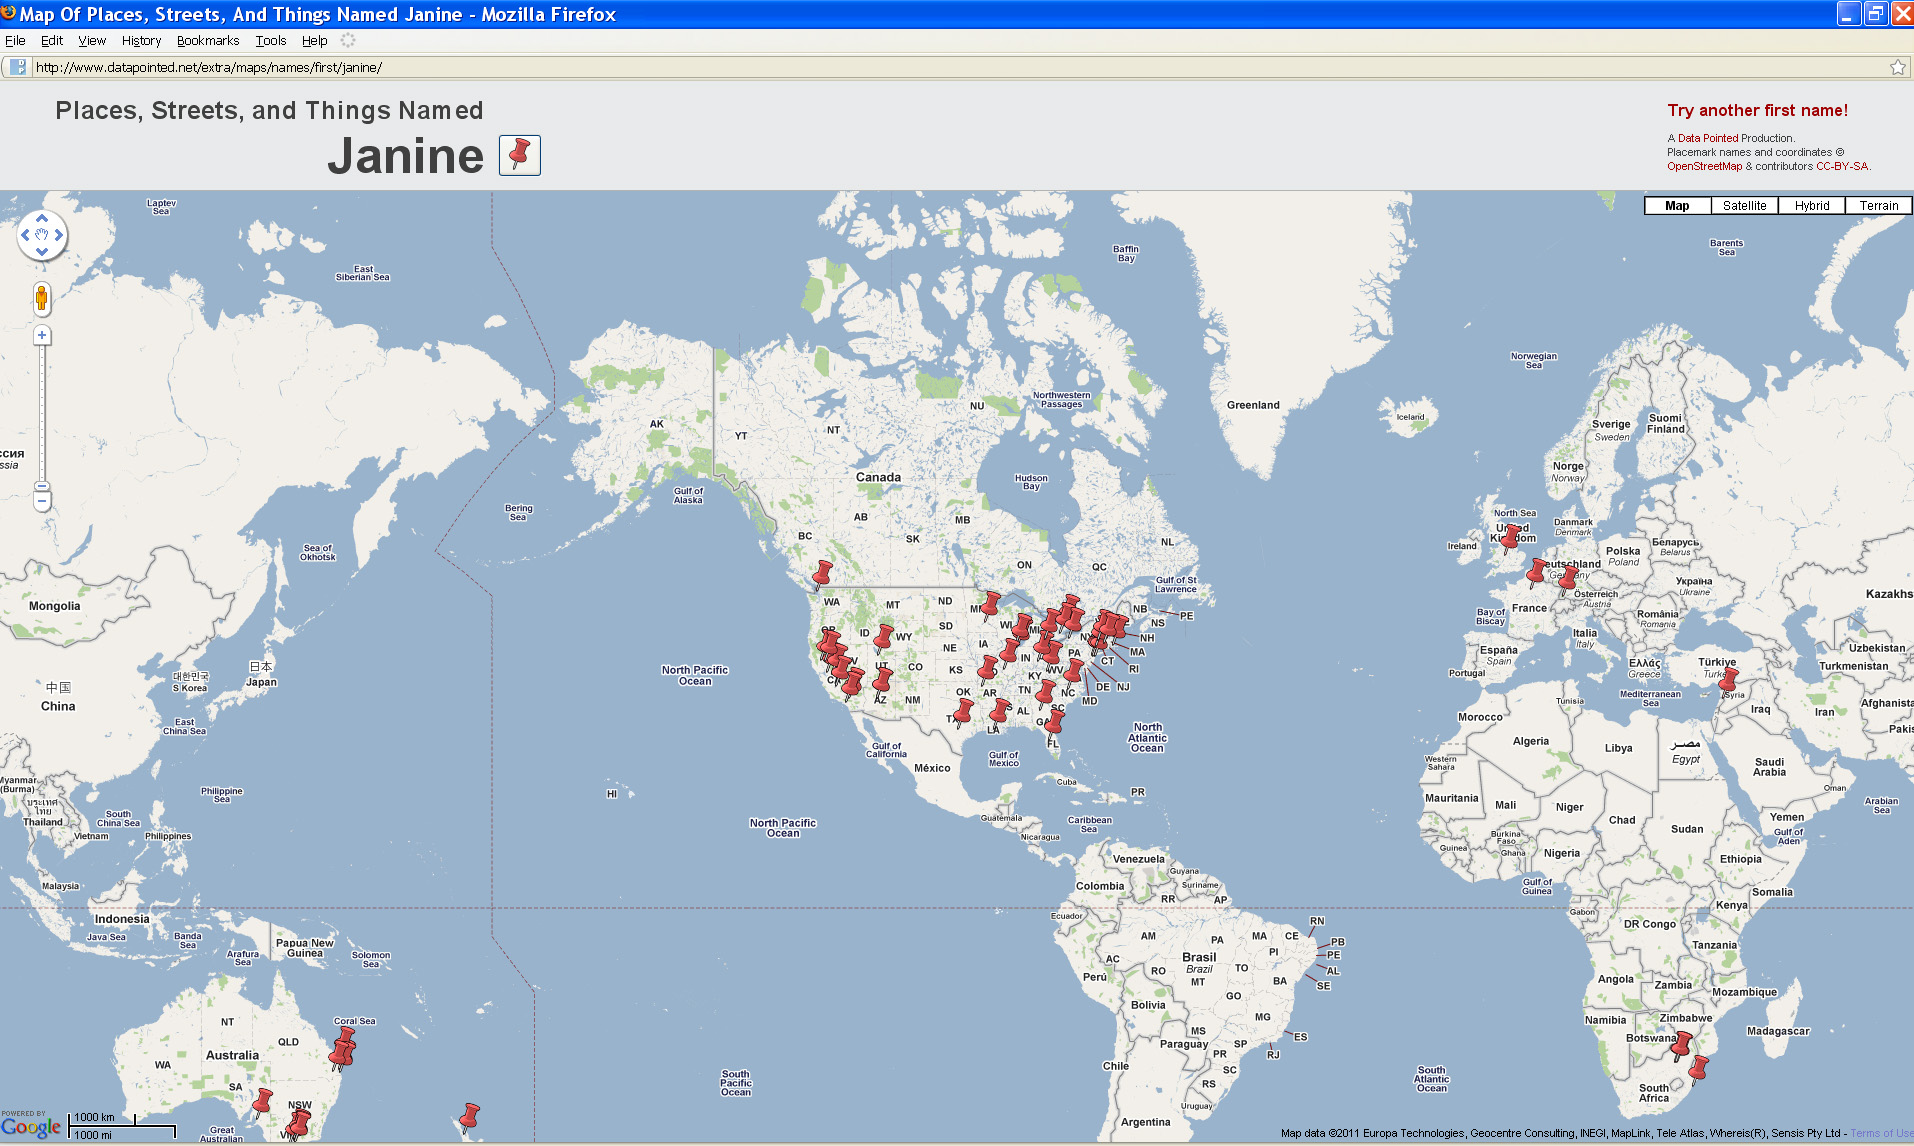
A fun new map site from Stephen Von Worley of Datapointed.net.  Click here then scroll to the ‘Find This First Name’ tool (screenshot below) and type in your first name.  Clicking the ‘Map it!’ button will return a map showing the worldwide locations of streets, places and things with your name. Clicking the ‘Earth it!’ option will give you the option of saving and/or opening a Google Earth KML file with the data.

Map my name tool:

Map of streets, places and things named ‘Janine’

Google Earth view of streets, places and things named ‘Janine’

Categories
Bucknell/Local Interest Events/Calendar General GIS Videos

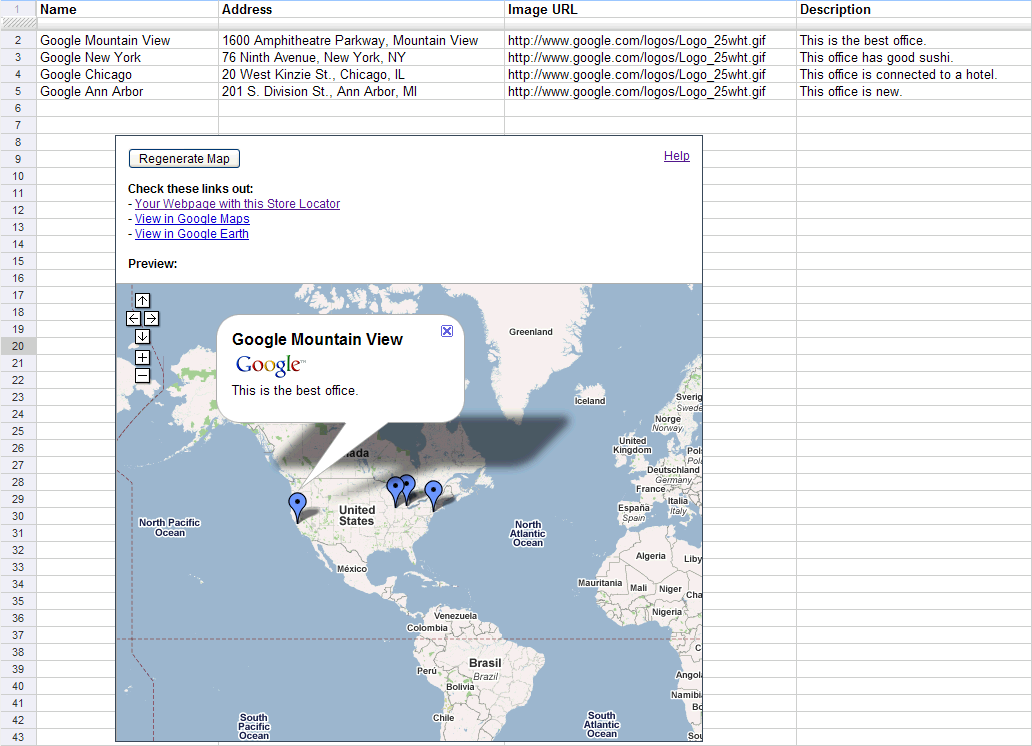
Open Lab session on Google spreadsheet mapper, docs, sites and video

There will be an Open Lab session for faculty in the ITEC office on Tuesday, March 1 from 9am-11am and Wednesday, March 2 from 2pm-4pm. Drop in at any time during the Open Lab hours to learn more about using the Google suite of tools for your teaching or research. The focus next week will be on Google spreadsheet mapper, docs, video and sites. The Open Lab is intended to be an informal workshop setting where you can learn more about tech tools and begin integrating them into your work. Feel free to bring your own data or we can use ours to show you how the tools work.

Categories
Bucknell/Local Interest Data Environment General GIS Marcellus Shale

New conservation and Marcellus Shale-related data available on Xanthus GIS Server

Several new datasets from Platts (an energy consulting firm) and the Nature Conservancy were added to the GIS Data folder on Xanthus last night.  The data includes gas compressor stations for PA, NY and WV along with current and projected locations of Marcellus Shale wells and wind turbines in PA.  Forest patches and landscape blocks are also included in the data from the Nature Conservancy . Full metadata is available on Xanthus. Bucknell faculty and students – please contact me for access and/or additional information on the new datasets.

Data from Platts:

Gas compressor station locations for PA, NY and WV.

Datasets from TNC’s Pennsylvania Energy Impacts Assessment:

Projections by The Nature Conservancy and Western Pennsylvania Conservancy

  • Probability surface of conversion to Marcellus Shale development
  • Projected Marcellus Shale pad locations under low, medium, and high development scenarios

Marcellus Shale drilling permits from the PA Department of Environmental Protection (PA DEP)

  • Drilled, valid, and expired Marcellus well permits as of January 2011
  • Drilled Marcellus Shale wells only as of January 2011

Projections by The Nature Conservancy and Western Pennsylvania Conservancy

  • Probability surface of conversion to wind energy development

—> Original model output at 30-meter resolution
—> Re-sampled raster at 60-meter resolution with exclusionary areas removed

  • Projected wind turbine locations under low, medium, and high development scenarios

Case information from the Federal Aviation Administration (FAA)

  • Built and proposed wind turbines and meteorological towers
  • Built large-scale wind turbines only
Categories
Data General GIS Map Apps Slideshow

Forecasting snow and finding supermarkets

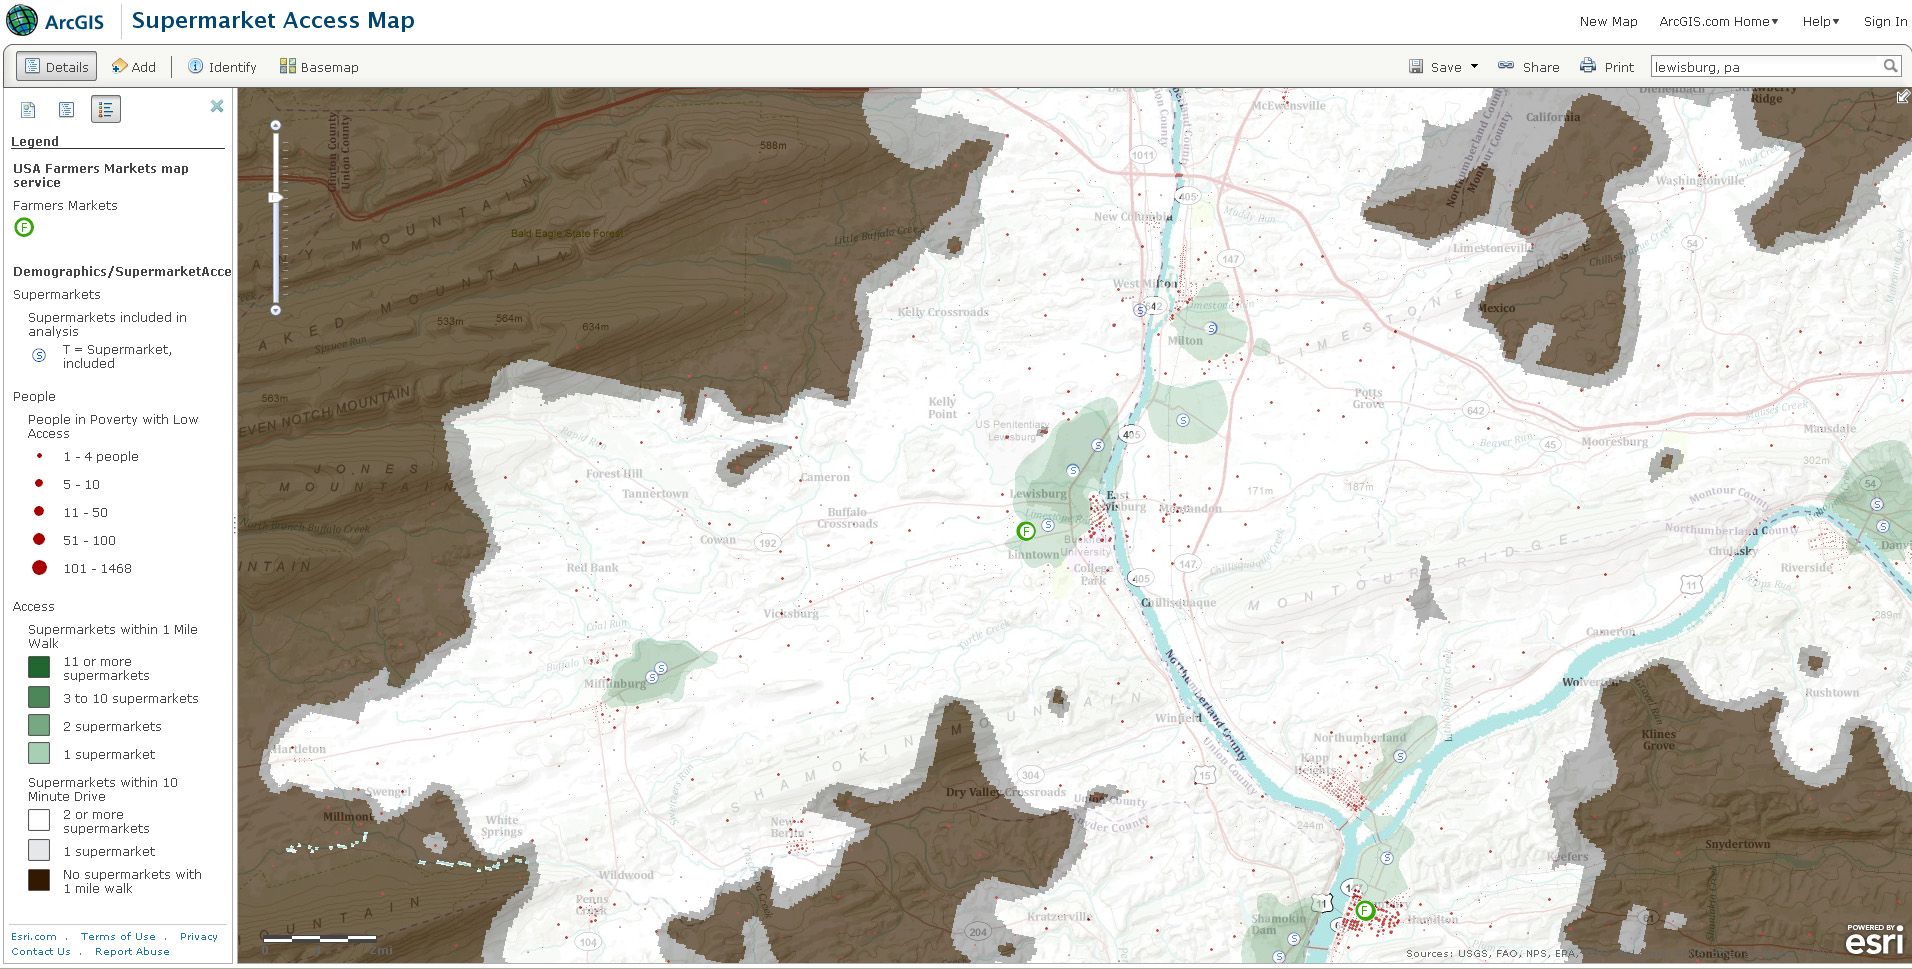
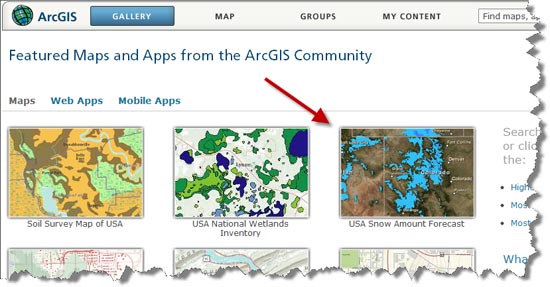
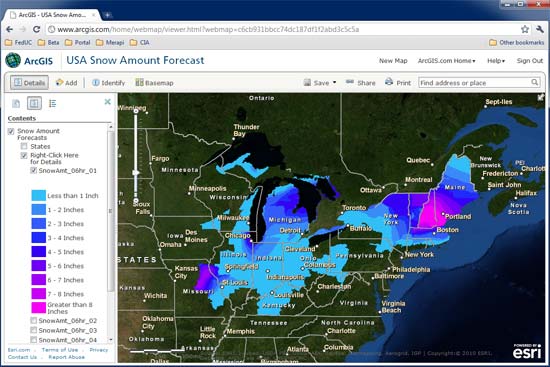
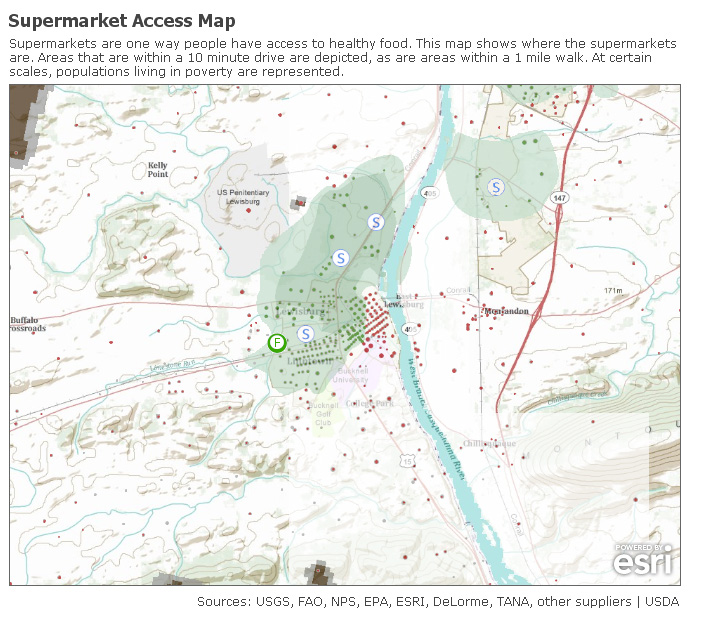
If you’re the type of person who loads up on bread and milk at the first hint of snowfall, then ArcGIS Online is your new best friend.  Using ArcGIS Online you can create a map showing projected snowfall amounts for your area along with the locations of nearby supermarkets. The ArcGIS Online Gallery has free basemaps that you can use to create quick and easy mash-ups online, stream directly into your ArcGIS map project, or (in many cases) download the raw data to use in whatever way you want. The basemaps shown below for snowfall forecasts and supermarket access are just two of the dozens of basemaps you can choose from in the ArcGIS Online Gallery.

View Larger Map

Read more about this on the ESRI ArcGIS Online blog.

ArcGIS Online Basemaps

Snowfall forecast map

Supermarket access in Lewisburg