Categories
Bucknell/Local Interest Environment General GIS Map Apps Videos

WikiWatershed – Model My Watershed

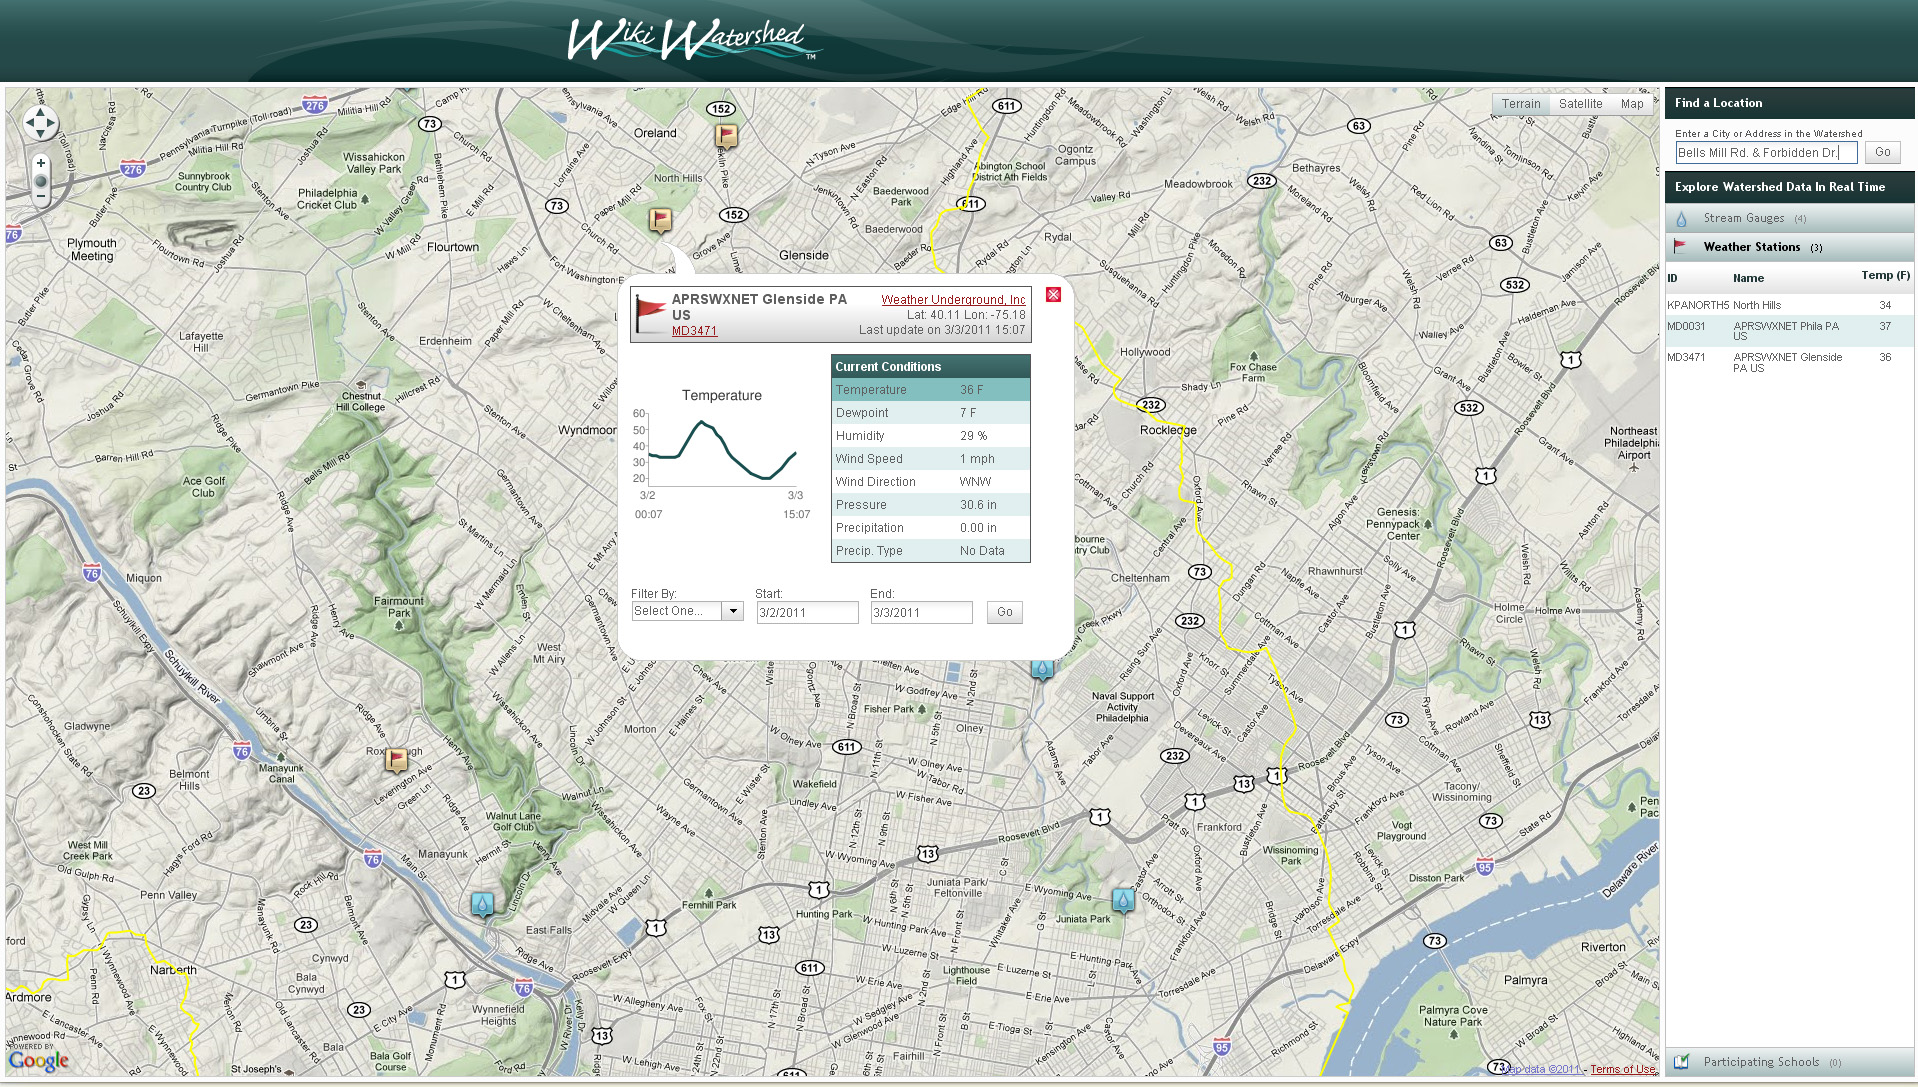
WikiWatershed is another exciting project under development by the team at Azavea.  The project – a collaboration between the Stroud Water Research CenterAzavea, University of Pennsylvania’s Cartographic Modeling Lab and Millersville University –  features a suite of web-based mapping and analysis tools designed for use by students and concerned citizens in sharing information about the streams, rivers and natural resources in their watersheds.  The first component of WikiWatershed to be released is the Model My Watershed tool which allows for web-based modeling of stormwater:

This game-like simulaton will enable students to modify underlying environmental conditions and simulate how these changes to the ecosystem affect the hydrologic cycle in their local watersheds …[and will] will use the latest version of Azavea’s DecisionTree geoprocessing framework to provide high performance, scalable modeling capabilities.

From the Stroud Water Research Center website:

When fully developed, [WikiWatershed] will leverage open source software and will function as an open collaborative resource for the community, enabling users to share geographically-tagged data, photos, videos, comments, educational curricula, simulation models and other tools on streams and rivers. As “Wiki” implies, content will be primarily contributed, enhanced and maintained by the user community. The WikiWatershed™ web portal will link a database of watershed information to geo-tagged visual content viewable on Google Maps®/Earth®, Flickr®, Panoramio®, YouTube®, etc.

Click here to explore the WikiWatershed mapping application.
Categories
Data Environment General GIS Slideshow

Online global reefs map

The World Resources Institute has a new online map of global reefs classified by threat risk. Click here to explore the map and/or download the KML.  Click here for additional data and maps on global reefs.


Categories
Bucknell/Local Interest Environment General GIS GIS in Geology Marcellus Shale Slideshow

NYT map graphic on toxic contamination from natural gas wells

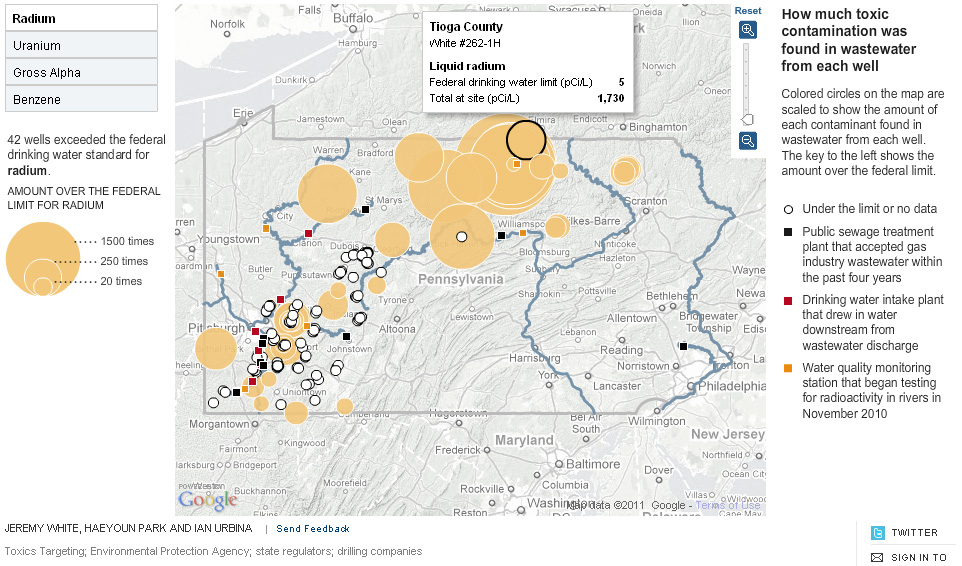
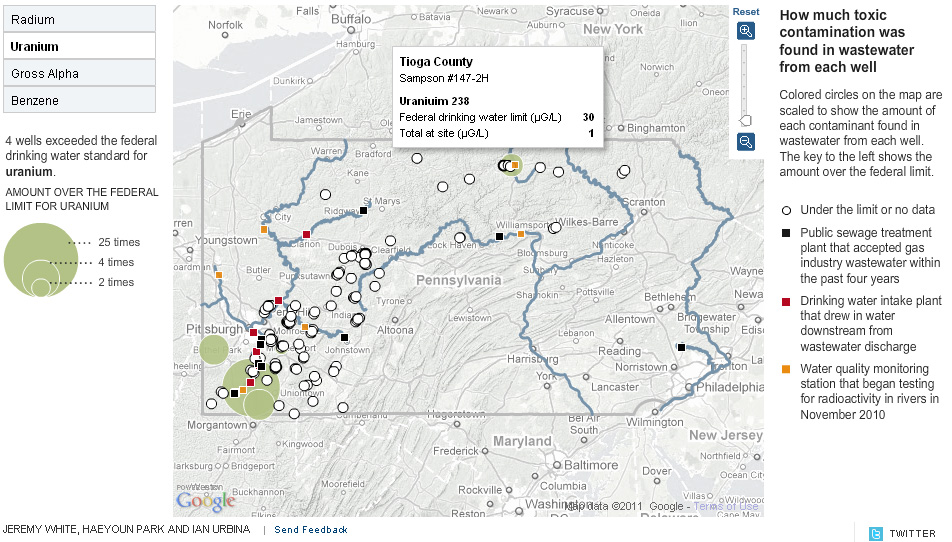
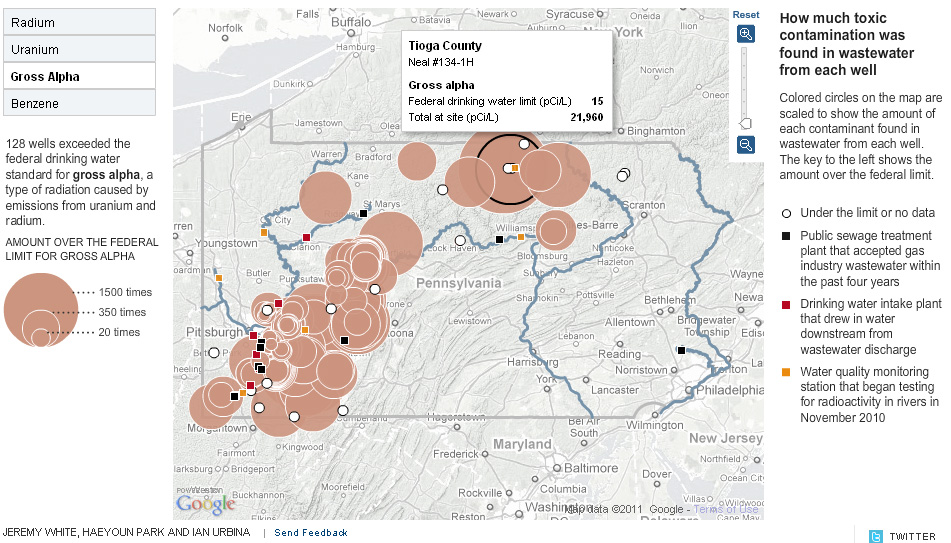
The New York Times has put out a new interactive map graphic that visualizes toxic contamination found in the wastewater from natural gas wells in PA.  The data – from 149 wells – is visualized by the type of contaminant (radium, uranium, gross alpha and benzene) and the amount by which each well exceeded the federal drinking water standard.  Below are some screenshots from the interactive graphic.

Radium contamination:


Uranium contamination:


Gross alpha contamination:


Benzene contamination:


Categories
Bucknell/Local Interest General GIS GIS in Environmental Studies GIS in Geography Slideshow

Bucknell student uses ArcGIS in research on sleeping sickness

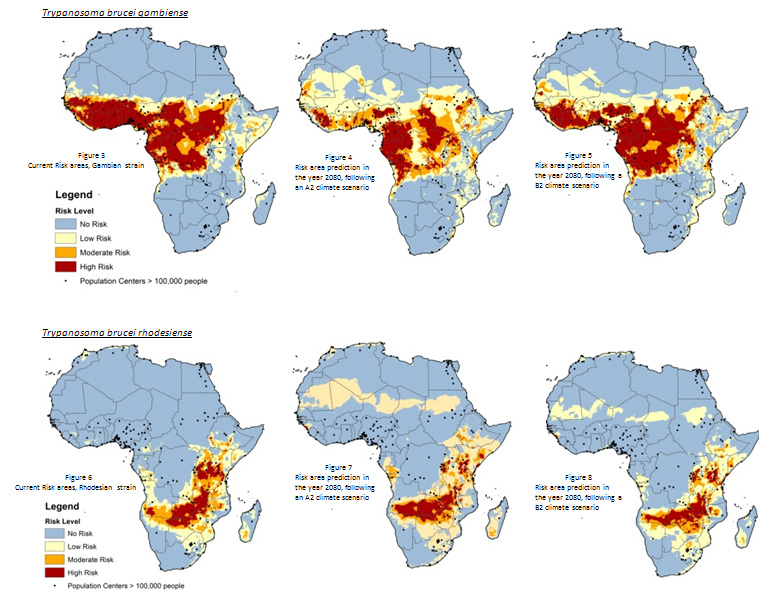
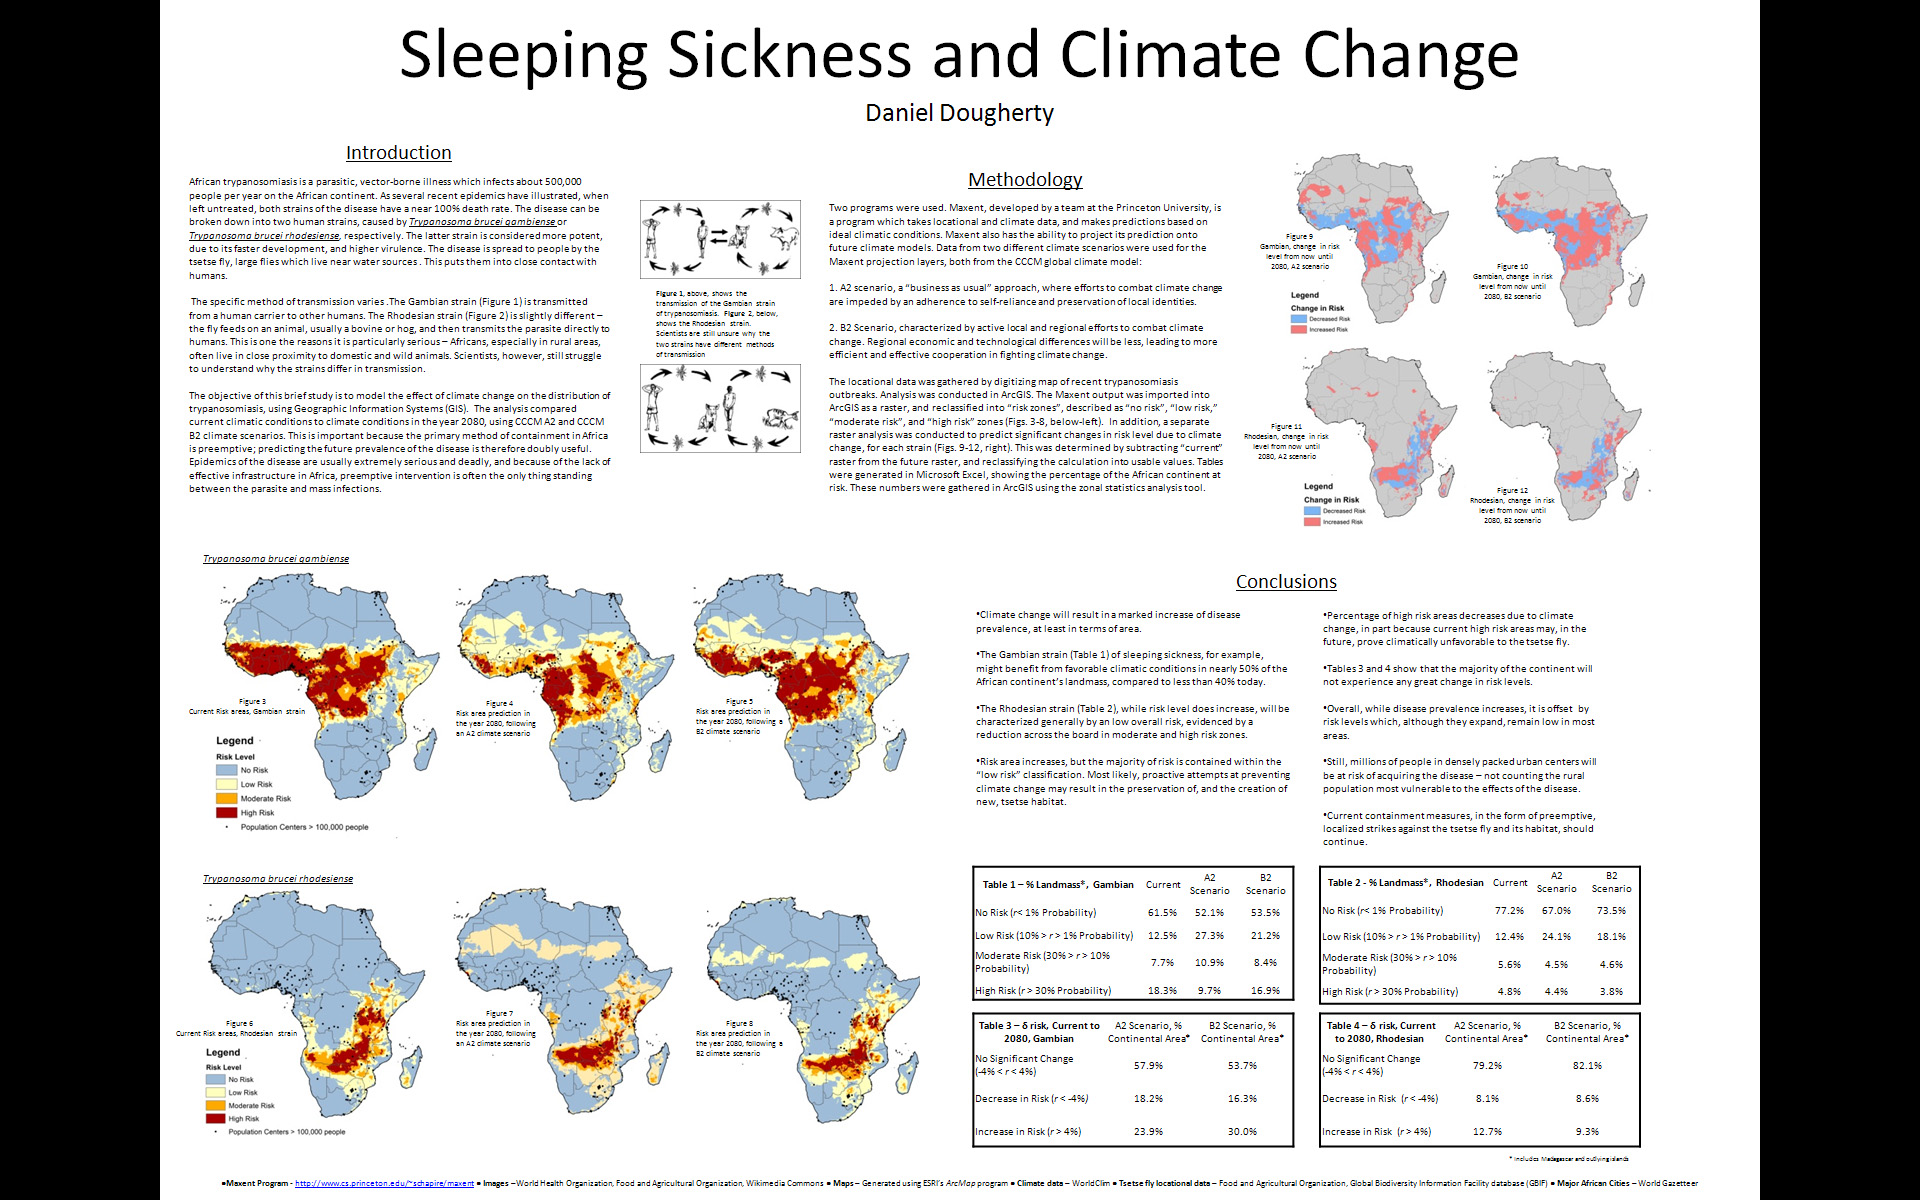
Below is an interview with Daniel Dougherty ’12, a History and Geography major, discussing his use of GIS for an analysis of the impact of climate change on sleeping sickness.  The research project was conducted as part of Prof. Duane Griffin’s Geography 204 course Applied GIS. In the interview, Dougherty describes the data and methodology he used for the project and talks about some of the conclusions he drew from his analysis.

httpv://www.youtube.com/watch?v=UsJf29_Mujw

The images below show some of the maps Dougherty was able to produce using ArcGIS, MaxEnt and data from WorldClim.

Categories
Bucknell/Local Interest Data Environment General GIS Marcellus Shale

New conservation and Marcellus Shale-related data available on Xanthus GIS Server

Several new datasets from Platts (an energy consulting firm) and the Nature Conservancy were added to the GIS Data folder on Xanthus last night.  The data includes gas compressor stations for PA, NY and WV along with current and projected locations of Marcellus Shale wells and wind turbines in PA.  Forest patches and landscape blocks are also included in the data from the Nature Conservancy . Full metadata is available on Xanthus. Bucknell faculty and students – please contact me for access and/or additional information on the new datasets.

Data from Platts:

Gas compressor station locations for PA, NY and WV.

Datasets from TNC’s Pennsylvania Energy Impacts Assessment:

Projections by The Nature Conservancy and Western Pennsylvania Conservancy

  • Probability surface of conversion to Marcellus Shale development
  • Projected Marcellus Shale pad locations under low, medium, and high development scenarios

Marcellus Shale drilling permits from the PA Department of Environmental Protection (PA DEP)

  • Drilled, valid, and expired Marcellus well permits as of January 2011
  • Drilled Marcellus Shale wells only as of January 2011

Projections by The Nature Conservancy and Western Pennsylvania Conservancy

  • Probability surface of conversion to wind energy development

—> Original model output at 30-meter resolution
—> Re-sampled raster at 60-meter resolution with exclusionary areas removed

  • Projected wind turbine locations under low, medium, and high development scenarios

Case information from the Federal Aviation Administration (FAA)

  • Built and proposed wind turbines and meteorological towers
  • Built large-scale wind turbines only