Categories
General GIS GIS in Computer Science Slideshow

GPS vs. Smartphone positional accuracy

Joseph Kerski, part of Esri’s education team had some interesting blog posts last week comparing the accuracy of GPS units to his smartphone and implications that might have for using the SmartPhone for academic purposes

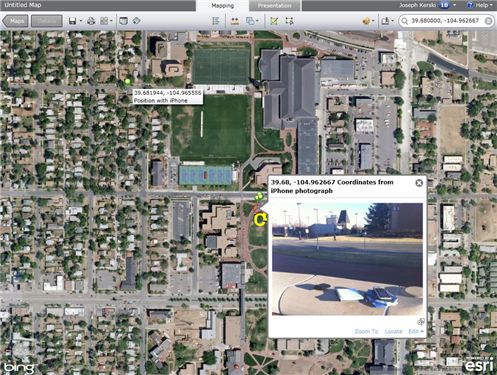
Recently I wrote about techniques to use photographs taken on a SmartPhone as hyperlinks to locations where you have collected field data using ArcGIS Online as your mapping platform. These photographs are geotagged with a latitude-longitude coordinate recorded at the time and location that the photograph is taken. But how accurate are those coordinates, and how do they compare to the accuracy of locations recorded by a GPS receiver? In other words, do I really need my GPS receiver any longer, since modern SmartPhones can capture positions using an embedded GPS chip and even supplement the GPS position by triangulating off cell phone towers?

Click here for part 1 of the blog post.

Click here for part 2 of the blog post.
Categories
General GIS GIS in Computer Science Map Apps Slideshow Videos

Your iPhone is Tracking You

O’Reilly Media published a story yesterday (on the penultimate day of its Where2.0 conference no less…)  describing Alasdair Allan and Pete Warden’s discovery of a hidden file on your iPhone and 3G iPad that keeps a running record of your device’s whereabouts. The file, part of the iOS4 release, records both latitude/longitude and timestamps – making it possible to create a detailed map of any and all movements you’ve made while having the iPhone or 3G iPad on your person.

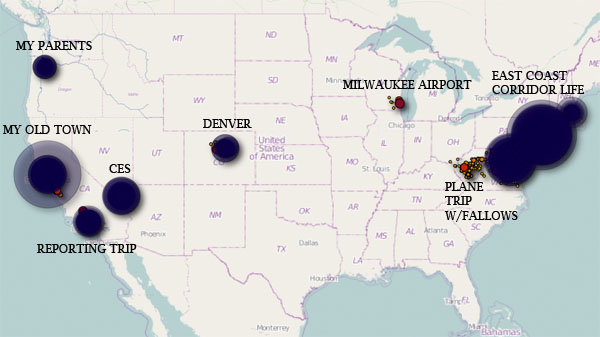
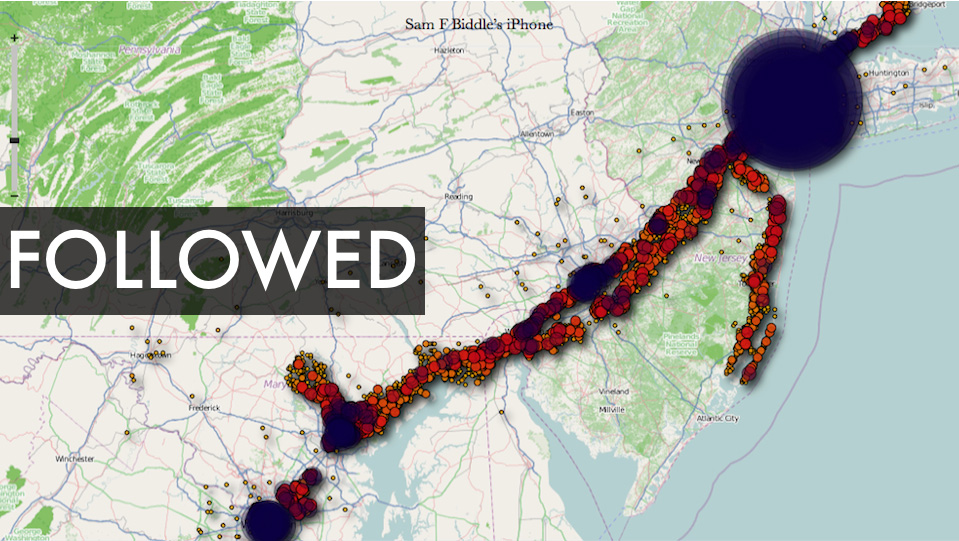
There is a debate underway about both the significance of this finding as well as how new a ”discovery’ it is  (see links below). But I’m kinda on the same page as Alexis Madrigal from the Atlantic – as much as I’m a little disturbed by the idea of a secret log of my whereabouts, I’m also fascinated by the idea of playing around with the data my iPhone has recorded and I’m curious to see what kinds of visualizations could be created out of it. If you’re curious about this too, you can visit Pete Warden’s website to download a free, open source app that will map the data from your iPhone or iPad tracking file.  See below for some sample ‘heat maps’ that were created using the tracking data from various user’s iPhones. Click here to see a video from Pete Warden’s website showing animation of tracking data from Warden’s iphone mapped by location and timestamp.

Story from O’Reilly Media:
Got an iPhone or 3G iPad? Apple is recording your moves

Story from Alex Levinson’s Blog:
Three Major Issues with the Latest iPhone ‘Discovery’

Story from The Atlantic:
My Life According To The iPhone’s Secret Tracking Log

Story from Gizmodo:
iSpy Conspiracy: Your iPhone is Secretly Tracking Everywhere You’ve Been, All the Time

Story from zdnet.com
Your iPhone is Tracking You (And Has Been for Awhile)

Two O’Reilly media researchers, Alasdair Allan and Pete Warden, caused quite a stir yesterday when they published an article about a hidden file in iOS 4 that regularly records the position of your device. All iPhones running iOS 4.0 or later log your location to a file called “consolidated.db” (a plain SQL file) which contains latitude-longitude coordinates and a timestamp.

Story from The Guardian:
iPhone Tracking Prompts Privacy Fears

Security researchers have discovered that Apple‘s iPhone keeps track of where you go – and saves every detail of it to a secret file on the device which is then copied to the owner’s computer when the two are synchronised. The file contains the latitude and longitude of the phone’s recorded coordinates along with a timestamp, meaning that anyone who stole the phone or the computer could discover details about the owner’s movements using a simple program.For some phones, there could be almost a year’s worth of data stored, as the recording of data seems to have started with Apple’s iOS 4 update to the phone’s operating system, released in June 2010.

YouTube Video of Pete Warden and Alastair Allan discussing the iPhone tracker at Where2.0:

httpv://www.youtube.com/watch?v=GynEFV4hsA0&p=0B2FEB8AACD826BE

Sample ‘heat map’ of Alexis Madrigal’s movements (created from data in the iPhone tracker file):


Sample ‘heat map’ from Sam Biddle’s iPhone:


Categories
Crisis-Mapping Events/Calendar General GIS GIS in Political Science Slideshow Videos

Where 2.0

The 2011 Where 2.0 conference is wrapping up today in Santa Clara, CA.  Over the course of the week, many of the presentations have been streamed live over the conference website. I’m including a few YouTube videos for some of noteworthy presentations.

Jack Dangermond – CEO and founder of Esri: “Living Maps – Making Collective Geographic Information a Reality”

httpv://www.youtube.com/watch?v=vIbGwY3aG0g&p=0B2FEB8AACD826BE


Blaise Agüera y Arcas, Architect of Bing Maps and MSN at Microsoft:  “Read/Write World”

httpv://www.youtube.com/watch?v=4X9u4JG9H6E&p=0B2FEB8AACD826BE


Ben Fry – principal of Fathom: “Mapping: From Interesting to Insightful to Irrelevant” (coming soon)


Patrick Meier, Director of Crisis Mapping & New Media for Ushahidi: “May the Crowd Be With You: The Future of Crisis Mapping for Disaster Response”

httpv://www.youtube.com/watch?v=M_NguESRZ4g&p=0B2FEB8AACD826BE


Dennis Crowley, Co-founder, foursquare; and Robert Scoble, Managing Director, Rackspace: “Future Location: Scoble & Dens”

httpv://www.youtube.com/watch?v=TpTDGeLiFnc&p=0B2FEB8AACD826BE


John Barratt, self-described “Geo, twitter & weather web hacker”:  “Who, What, Where, When: Creating New Maps from Geo-tweets”

httpv://www.youtube.com/watch?v=ey_m0F_b-Vw&p=0B2FEB8AACD826BE


Sylvain Carle, CEO & co-founder @ Needium: “Locking Yourself Out in London (and Tweeting about it)

httpv://www.youtube.com/watch?v=Gvcs4H_A0Wc&feature=autoplay&list=PL0B2FEB8AACD826BE&index=16&playnext=1


Categories
General GIS GIS in Psychology Map Apps Slideshow

Sad maps at University of Florida

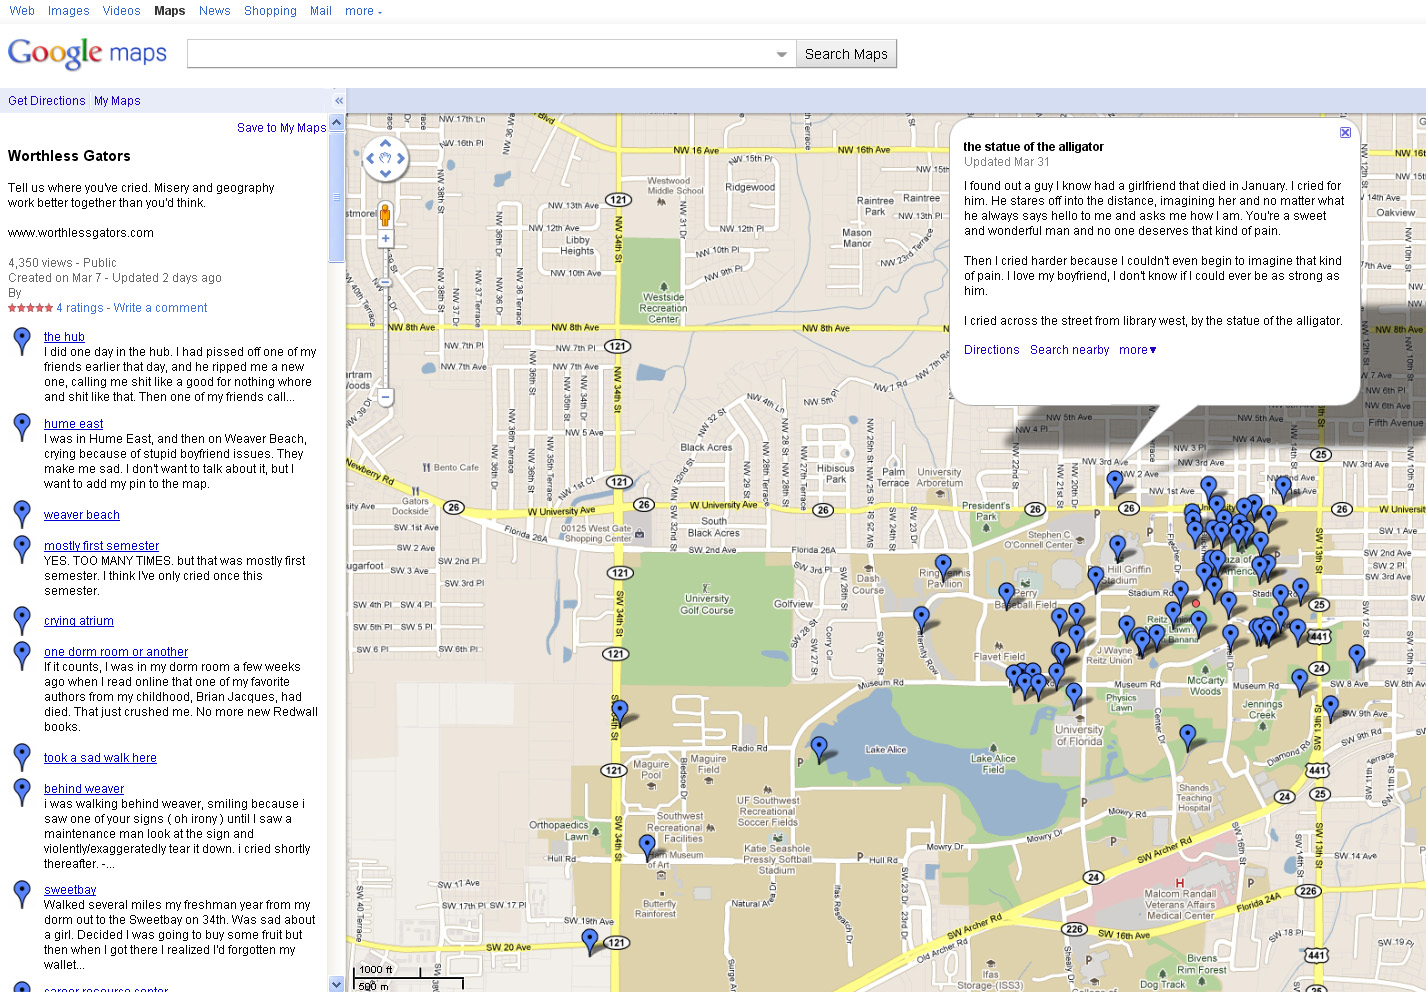
A few weeks ago I posted about Cambridge University PhD student Alex Davies’ project on mapping happiness.   Over at worthlessgators.com University of Florida student(?)  ”Sad Hector’ is doing the exact opposite – mapping sadness on University of Florida’s Gainesville campus.  Prompted to ‘tell us where you’ve cried,’ visitors to the site can fill out a short form (below) with the location and details of the crying incident and then see their entry added to the GoogleMaps ‘sad map.’

Created in early March, the site already has 60+ entries mapped. Crying locations run the gamut from the predictible (fraternity row, dorms) to the scenic (shores of Lake Alice, local parks) to the  unexpected (near the Florida Museum of Natural History Ogliocene Period display).  Parking garages seem to be a fairly popular crying location at U of F.  In addition to just noting the locations of crying on campus, the site also has a link to the U of F Counseling and Wellness Center for students who want to seek help.

Thanks to Kathleen for the heads up about this site!


Categories
General GIS GIS in Geography GIS in Sociology Map Apps Slideshow

The 12 States of America

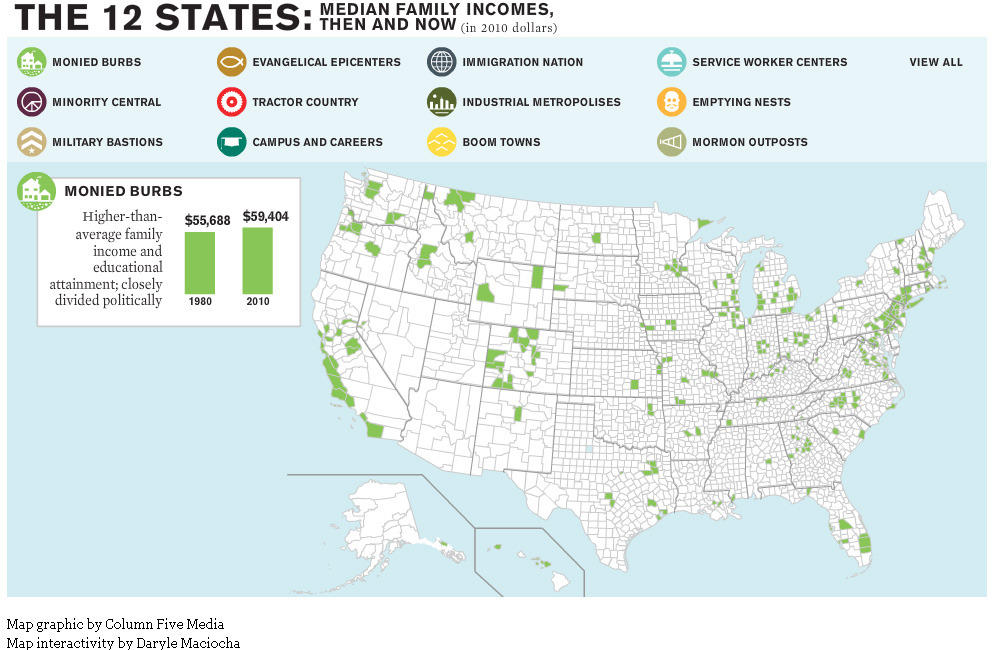
The website for The Atlantic magazine has an interesting new map graphic visualizing the ways in which income inequality has fractured the nation over the past 30 years.  The graphic breaks the nation into 12 different ‘states’ – monied burbs, minority central, military bastions, evangelical epicenters, tractor country, campuses and careers, immigration nation, industrial metropolises, boom towns, service worker centers, emptying nests and mormon outposts – based on a variety of different demographic characteristics.

For example, the Boom Town state is defined as relatively wealthy U.S. counties that saw rapid growth and increasing minority populations prior to the last recession. Whereas Monied Burbs have higher than average family income and educational attainment and are closely divided politically.

See map samples for the Boom Town and Monied Burb states below. Click here to see the interactive map graphic on The Atlantic’s website. Thanks to Ben Marsh for the heads up about this graphic!