Categories
Bucknell/Local Interest Digital Humanities General GIS GIS in Environmental Studies GIS in Geography GIS in History GIS in Humanities Map Apps Marcellus Shale Slideshow Videos

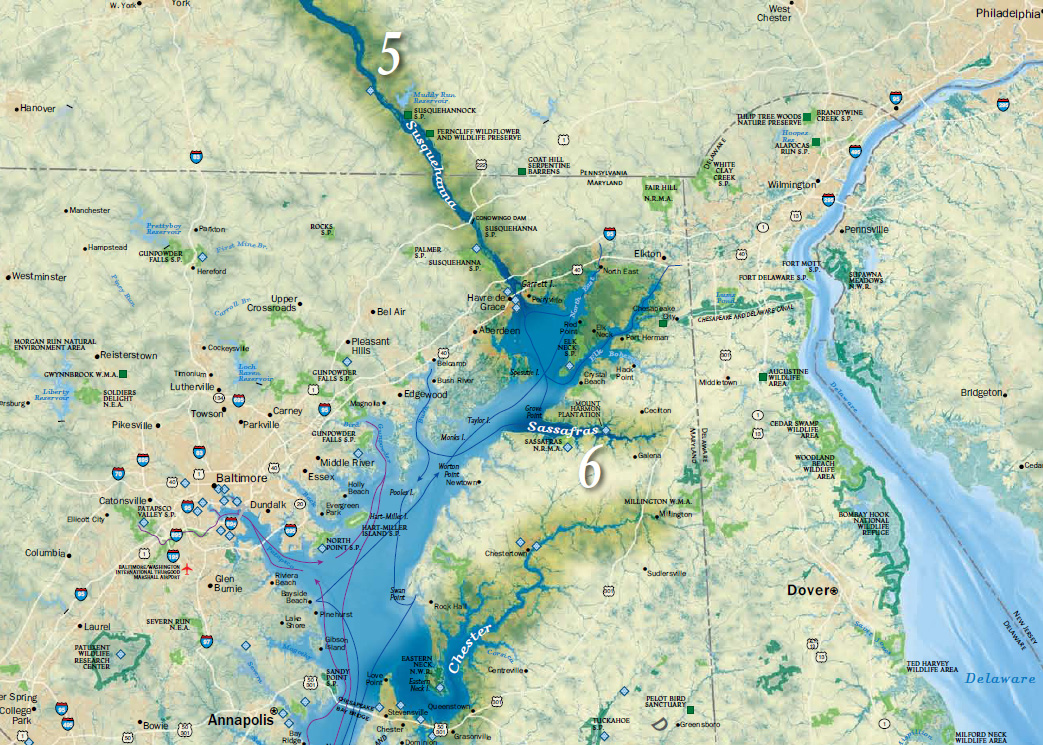
Uncovering the ‘Stories of the Susquehanna’ using GIS

Bucknell faculty have long had an interest in grounding their research efforts locally – using the physical, cultural, historical and sociological landscapes of the Susquehanna Valley region as a living laboratory. The two videos below feature Prof. Katherine Faull and student Emily Bitely ’11 talking about the role of GIS in two such projects – the Stories of the Susquehanna, and the John Smith Trail Extension project (both multi-year, inter-disciplinary projects involving faculty from across the campus).

Katie Faull discussing her use of GIS for the John Smith Trail Extension and Stories of the Susquehanna project:
httpv://www.youtube.com/watch?v=j2eG2v8FnOA

Emily Bitely ’11 discussing her use of GIS for the same projects:
httpv://www.youtube.com/watch?v=1uPcaaqSzII

More about the John Smith Trail:

  • To learn more about the John Smith Trail, click here or here.
  • To view a National Geographic map detailing Captain John Smith’s voyage, click here.
  • To view a map of interpretive ‘smart’ buoys located in the river, click here.

More about the Stories of the Susquehanna project:

  • A pilot web mapping application featuring two of the ‘Stories of the Susquehanna’ is scheduled to launch this fall.  Stay tuned for more details.
  • Click here to read about the 2010 Susquehanna Valley Summer Writer’s Institute (SVSWI).  The SVSWI project is related to the Stories of the Susquehanna both in the type of local stories it explores and in its use of maps, audio, video, images and text to reflect on those stories in an interactive digital story-telling environment.
  • Click here to view the SVSWI’s interactive mapping application featuring students’ reflections on the impact of the Marcellus Shale gas boom on different populations in the Susquehanna Valley region.
Categories
Environment General GIS GIS in Environmental Studies GIS in Geography GIS in Sociology Map Apps Slideshow Videos

Go Philly! GIS helps improve access to healthy food in the city

Yesterday’s NY Times had an opinion piece praising Philadelphia’s efforts in recent years to improve access to healthy food for its most disadvantaged neighborhoods and citizens.  In ‘Go Philly!’, Mark Bittman describes the collaborative efforts of Philadelphia municipal government, the Commonwealth of PA and a whole host of local non-profits (including my former employer, the newly renamed  Greater Philadelphia Urban Affairs Coalition) in developing programs to bring supermarkets and healthy food options to under-served neighborhoods.

What he doesn’t describe is the critical role that GIS has played in bringing these programs to life.  See below for some background information and resources related to using GIS for improving access to healthy food.

1. Watch this short video (Ch. 3 of Episode 2 from Penn State’s Geospatial Revolution video series) to learn more about the role of GIS in Philadelphia’s ‘healthy food’ success story.

httpv://www.youtube.com/watch?v=RYzHcPHRhWQ

2. Read reports from the Food Trust and The Reinvestment Fund (TRF) describing their work in Philadelphia and other communities. Both organizations are Philadelphia-based non-profits that have been at the center of Philadelphia’s efforts to improve access to healthy food.

“The Grocery Gap: Who Has Access to Healthy Food and Why It Matters” – click here

Food Trust/TRF Report on the Fresh Food Financing Initiatives projects – click here

TRF’s resource page on food access – click here

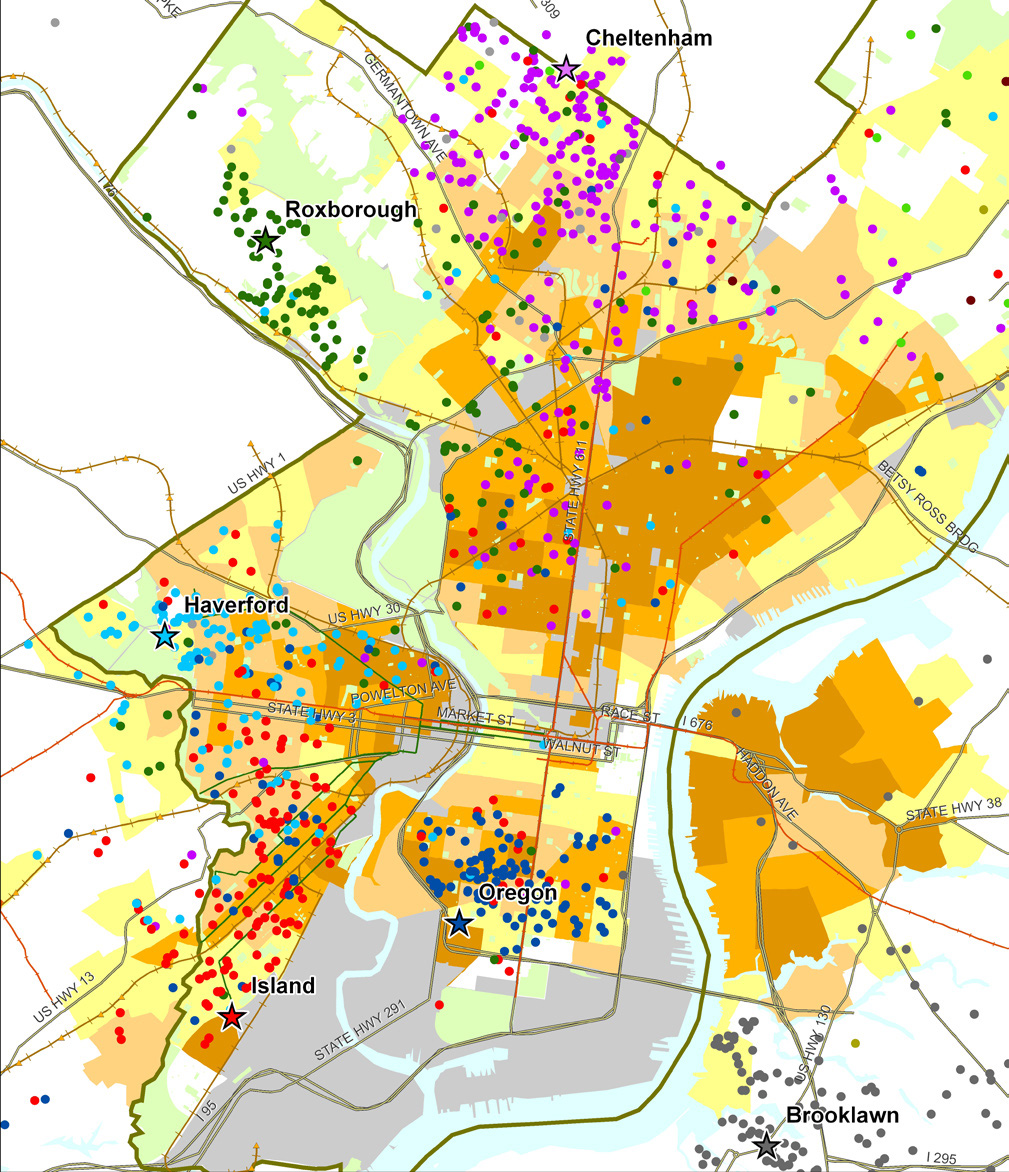
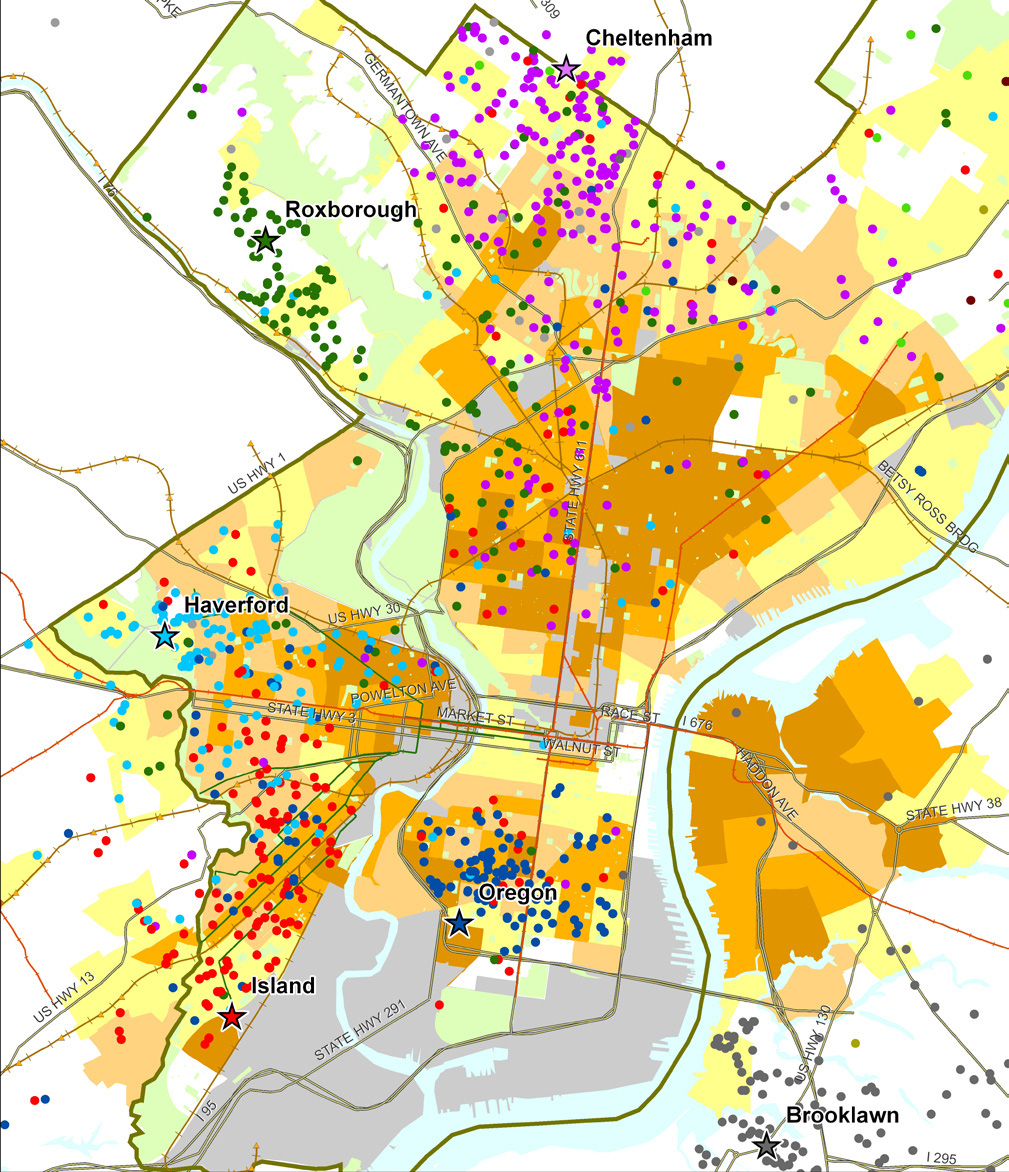
Sample map from Food Trust/TRF report on the Fresh Food Financing Initiative:

“Map 1: Residence of ShopRite Employees by Poverty Rate of Census Tract.  Each star on the map represents a Brown’s ShopRite store, with the location of the store’s employees illustrated by correspondingly colored dots.”


3. Watch a video created by TRF in collaboration with the Brookings Foundation to describe their use of GIS and findings in their  “Getting to Market” report on healthy foods initiatives across the U.S.

httpv://www.youtube.com/watch?v=Wp1w9s4kkHU


and/or explore the project website for “Getting to Market” – click here . The project site includes profiles of food access in major U.S. metropolitan areas.


4. Explore interactive web mapping applications featuring data on supermarket access:

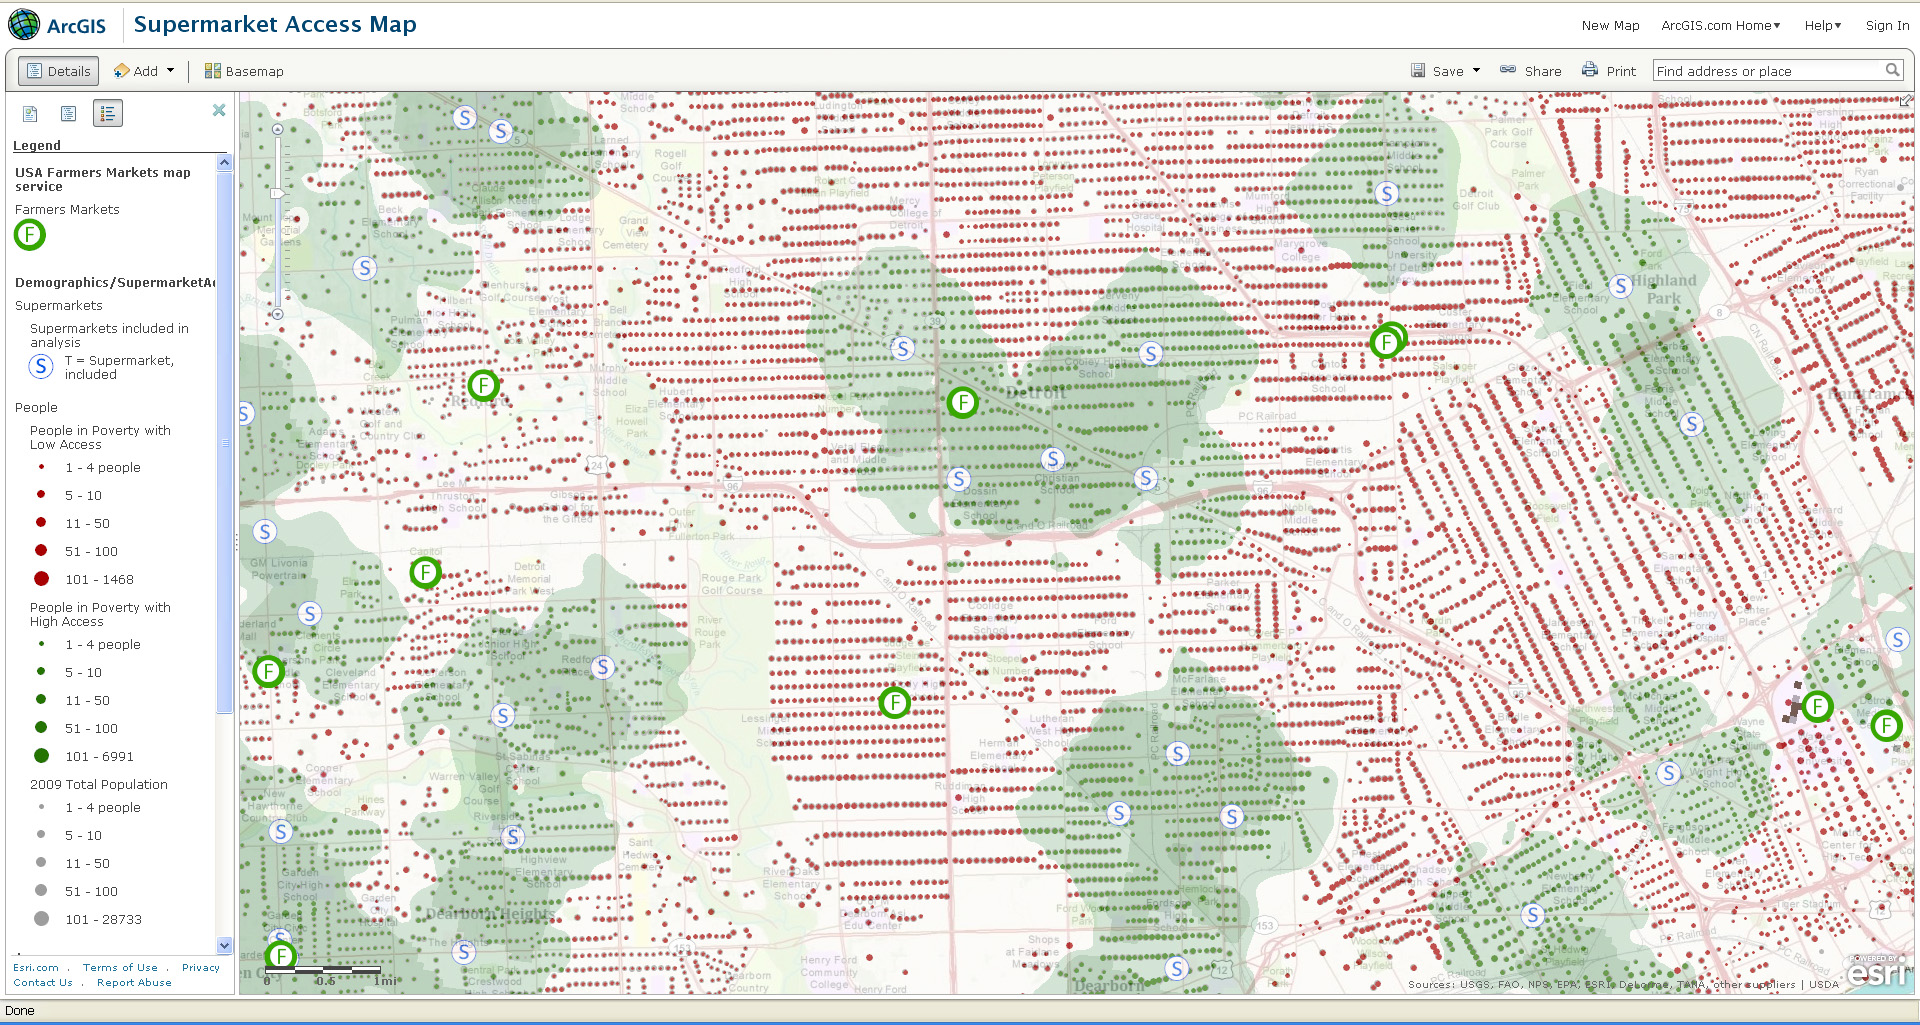
ESRI’s ArcGIS Online Supermarket Access Map – click here

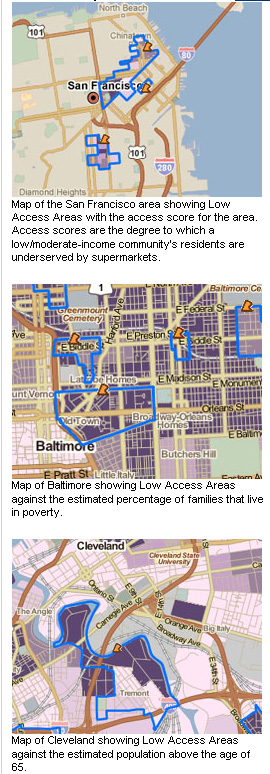
TRF’s PolicyMap Data on Supermarket Access – click here


Sample map from ESRI’s Supermarket Access Map:


Sample maps from TRF’s PolicyMap application:


Categories
Bucknell/Local Interest Data GIS in Engineering GIS in Environmental Studies GIS in Geology Slideshow

GIS in education – EPA grant and campus mapping

Notes on two interesting stories about GIS in education. Thanks to Adena Schutzberg’s All Points Blog for the heads up about the stories.

1. Texas State University’s Center for GIScience was recently awarded 500K grant from EPA to use GIS for modelling/mapping air pollution-exposure-health effects:
The U.S. Environmental Protection Agency’s Science to Achieve Results (USEPA-STAR) program has awarded a grant of nearly $500,000 to The Texas Center for Geographic Information Science in the Department of Geography at Texas State.

The grant will support a project entitled “Air Pollution-Exposure-Health Effects Indicators: Mining Massive Geographically Referenced Environmental Health Data to Identify Risk Factors for Birth Defects.”The three-year project will develop air pollution exposure assessment methods, visual geospatial data mining tools, and epidemiological analysis procedures to define new air pollution-exposure-health effect indicators that cover three components of the hazards-exposure-health effects-intervention paradigm.

San Marcos Local News

Click here to see more EPA STAR Research Grant Announcements.  The EPA STAR grants are just one of the types of research grants available through the US EPA National Center for Environmental Research.   Click here for an overview of the Center’s research and fellowship opportunities.  Check the Bucknell GIS Calendar (featured on the main page of the GIS blog) this fall for deadlines for student grant applications for the EPA GRO fellowships – awarded each year to undergraduate students in environmentally related fields of study.  From the EPA Fellowships web page:

Eligible students will receive support for their junior and senior years of undergraduate study and for an internship at an EPA facility during the summer between their junior and senior years. The fellowship provides up to $19,700 per year of academic support and up to $9,500 of internship support for the three-month summer period, for a total of up to $48,900 for the two year period.

2.   Grad students at Utah State University are collecting high resolution imagery of their campus using a small blimp.

Soaring above the Quad on Tuesday afternoon, a white blimp controlled by Utah State University graduate students was almost hard to spot against the Cache Valley’s overcast sky.The only object that was clearly visible was a black digital camera, snapping one picture every five seconds, providing color georeferenced aerial photography of the entire Quad in UTM (metric) coordinates.

The students were conducting a lab by running a blimp survey for Joseph M. Wheaton’s geographic information systems class. The objective: To provide aerial imagery of the entire Quad. The 1,000-plus pictures the blimp provides them with will be used to make an image that can fit “on top of” the images on Google map, said Bryan Watt, a USU graduate student in the class.

Herald Journal

Could we do this at Bucknell? Twice in the last month I’ve had faculty (half-jokingly) suggest that we rent a plane to do a data collection fly-over of Lewisburg. Forget the plane, let’s figure out how to get our hands on a blimp!

Categories
Bucknell/Local Interest General GIS GIS in Environmental Studies GIS in Geography Slideshow

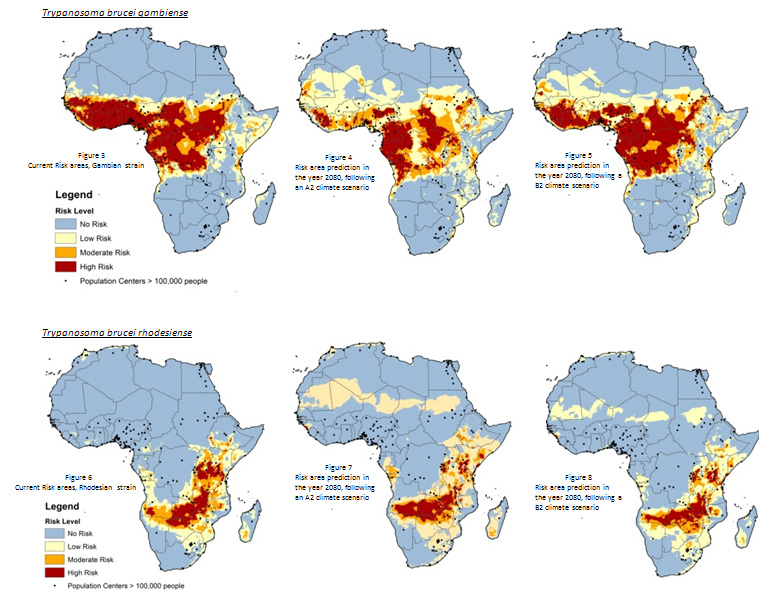
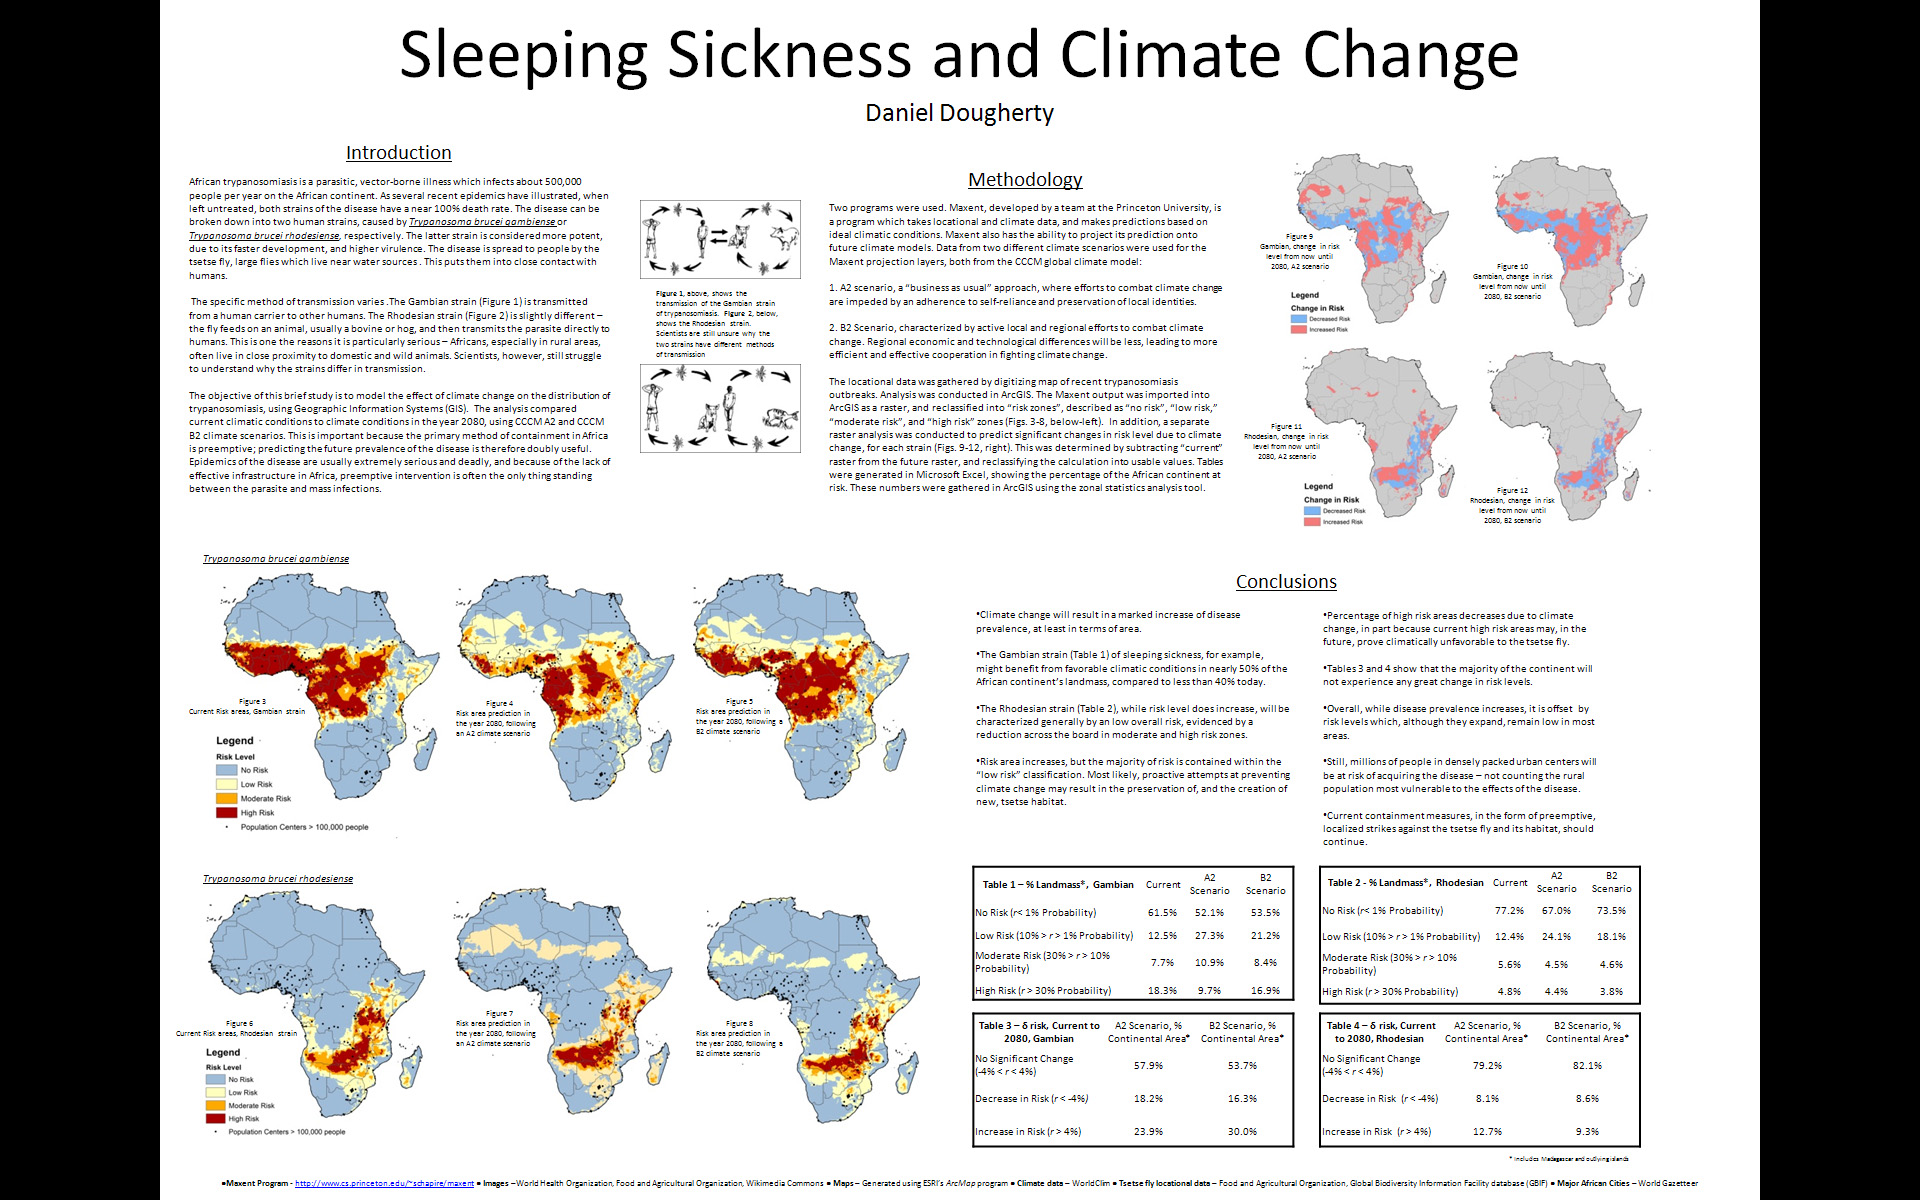
Bucknell student uses ArcGIS in research on sleeping sickness

Below is an interview with Daniel Dougherty ’12, a History and Geography major, discussing his use of GIS for an analysis of the impact of climate change on sleeping sickness.  The research project was conducted as part of Prof. Duane Griffin’s Geography 204 course Applied GIS. In the interview, Dougherty describes the data and methodology he used for the project and talks about some of the conclusions he drew from his analysis.

httpv://www.youtube.com/watch?v=UsJf29_Mujw

The images below show some of the maps Dougherty was able to produce using ArcGIS, MaxEnt and data from WorldClim.

Categories
Bucknell/Local Interest Crisis-Mapping Digital Humanities General GIS GIS in Environmental Studies GIS in Geography GIS in History GIS in Humanities GIS in Political Science GIS in Public Health GIS in Sociology Map Apps Slideshow

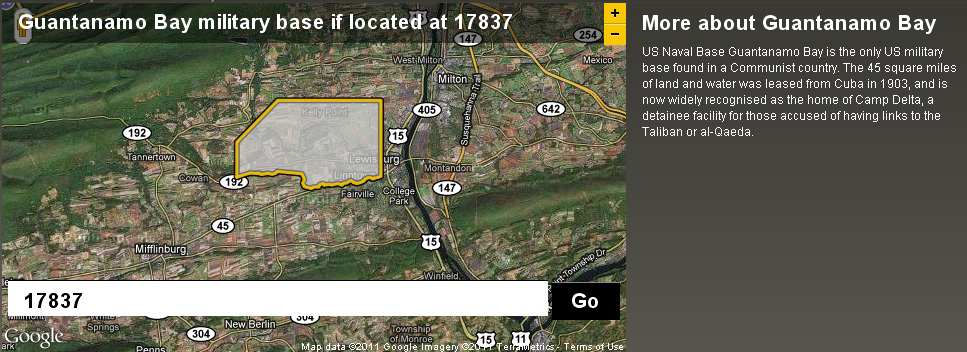
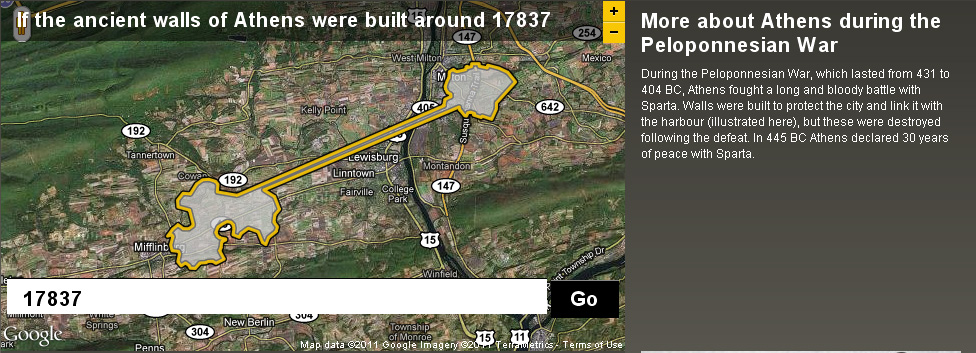
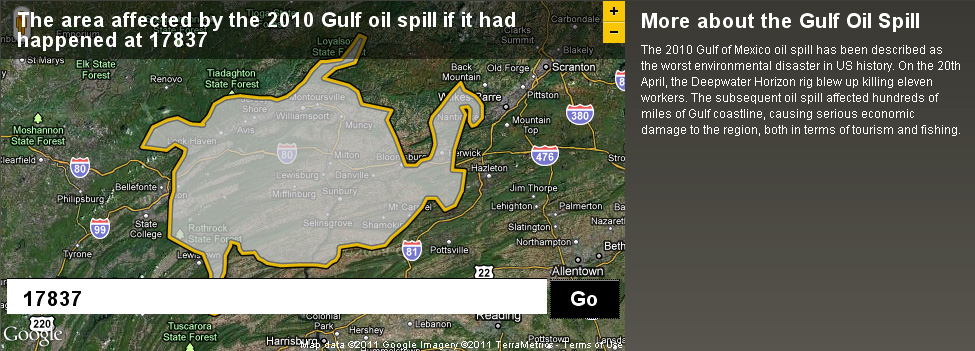
How big is it really?

Back in December I posted about an NPR story about map scale.  I got so excited about the baseball on the moon map that I neglected to point out the other really interesting link from the story – to the BBC Dimensions website.  Dimensions (or, ‘howbigisitreally’) has a tool that lets you plug in any zip code or location and then choose from a list of events, places or things that you want to superimpose onto your area. See below for a map showing the area that the Guantanamo Bay Naval base would occupy if it was located in Lewisburg. I’ve also included maps showing what the ancient walls of Athens and the Gulf oil spill would look like if superimposed over the Lewisburg area. The Dimensions website has numerous places, events and things to choose from in making your map, including: the war on terror, ancient worlds, the industrial age, space, environmental disasters, depths, cities in history and more.