Categories
Bucknell/Local Interest Events/Calendar General GIS Slideshow

Call for faculty participation in LIT and Mellon-funded summer GIS workshops

Call for faculty participation in LIT and Mellon funded summer GIS Workshops

Two GIS workshops for faculty will be offered during Summer 2011.
* Introductory GIS workshop (4 days)
Monday, August 8th through Thursday, August 11th from 9am-1pm*
(lunch provided)

* Advanced GIS workshop (2 days)
Monday, August 15th through Tuesday, August 16th*
(lunch provided)

*Additional workshop dates (e.g. end of May/early June) may be added depending on faculty interest. If you are interested in attending, but can’t join us during the August workshop dates, please click on the link below to suggest alternate dates.

These grant supported workshops ($400 for each participant) will enable 12 faculty to engage in a hands-on GIS experience designed to be broadly useful to faculty, regardless of their specific disciplines and areas of research. To make the workshop experience more meaningful and relevant, both the introductory and advanced workshops will feature local data and topics of interest

If you are interested in participating, please click the link below to complete the GIS workshop interest form. Please note – there is a limit of 12 funded seats for the Summer 2011 GIS Workshops. Additional Mellon funded GIS workshop opportunities will be announced prior to summer 2012 and 2013 sessions.

Click here to access GIS workshop interest form.
Categories
Bucknell/Local Interest Events/Calendar General GIS Marcellus Shale Slideshow

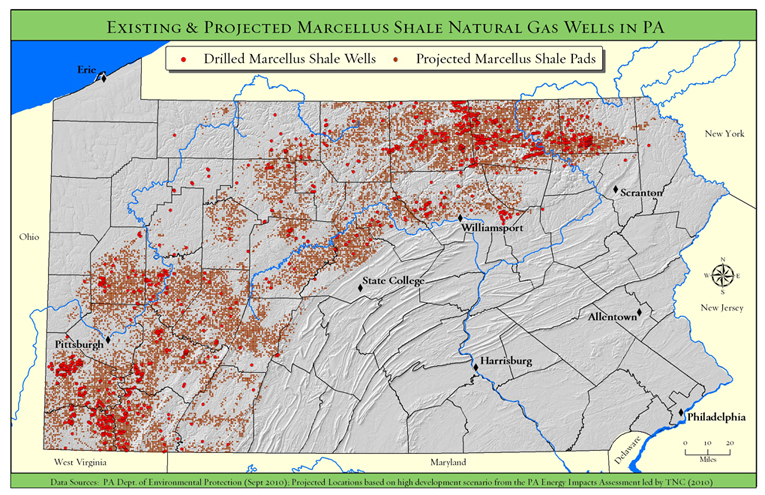
TNC Presentation on Marcellus Shale – Monday, April 4 @ 4:30pm

What: Presentation by The Nature Conservancy on Marcellus Shale/PA Energy Impacts
When: Monday, April 4th at 4:30pm
Where: Bertrand Library, Traditional Reading Room

Refreshments will be served.

Come and hear Tamara Gagnolet, GIS Analyst and Conservation Data Manager for the Pennsylvania chapter of the Nature Conservancy, discuss her work in using GIS to analyze potential impacts of Marcellus Shale gas drilling in Pennsylvania. Ms. Gagnolet’s presentation will focus on how GIS and spatial analysis were used to project how much energy might be developed in PA during the next 20 years, where that development is more or less likely to occur and what types of strategies might need to be employed to mitigate potential habitat impacts.

Students are welcome and encouraged to attend.

Categories
Crisis-Mapping Environment General GIS GIS in Political Science Slideshow Videos

NOAA visualizations of Japanese earthquake and tsunami

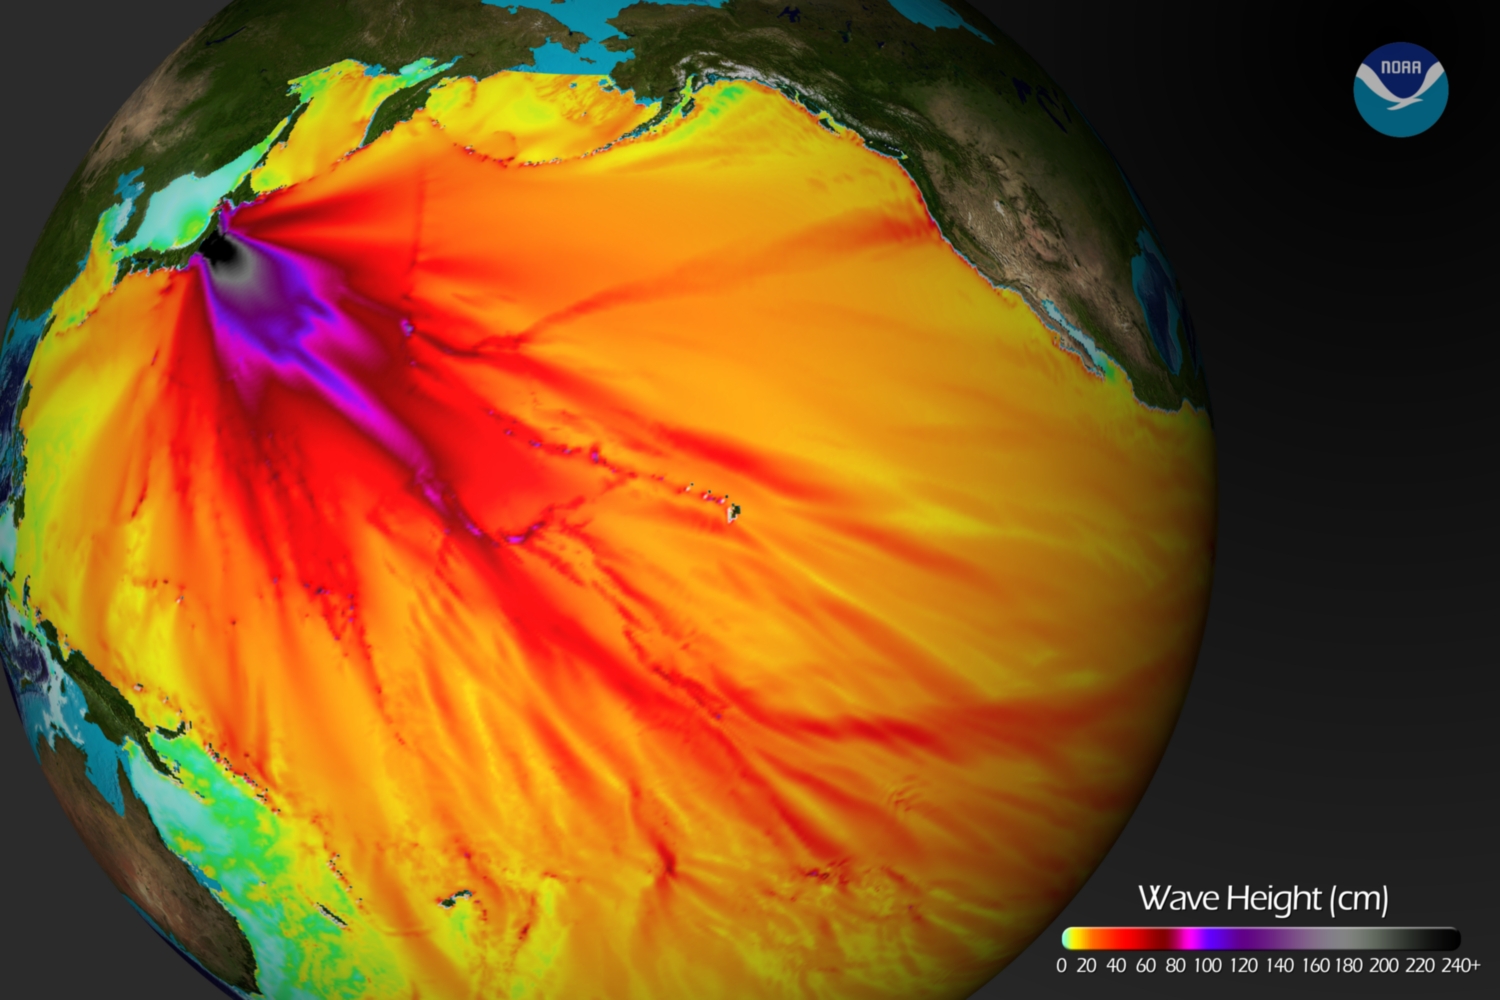
Below is a tsunami wave height model that shows the Pacific-wide impact of the event. The model was created by the NOAA Environmental Visualization Lab:

Description from NOAA:

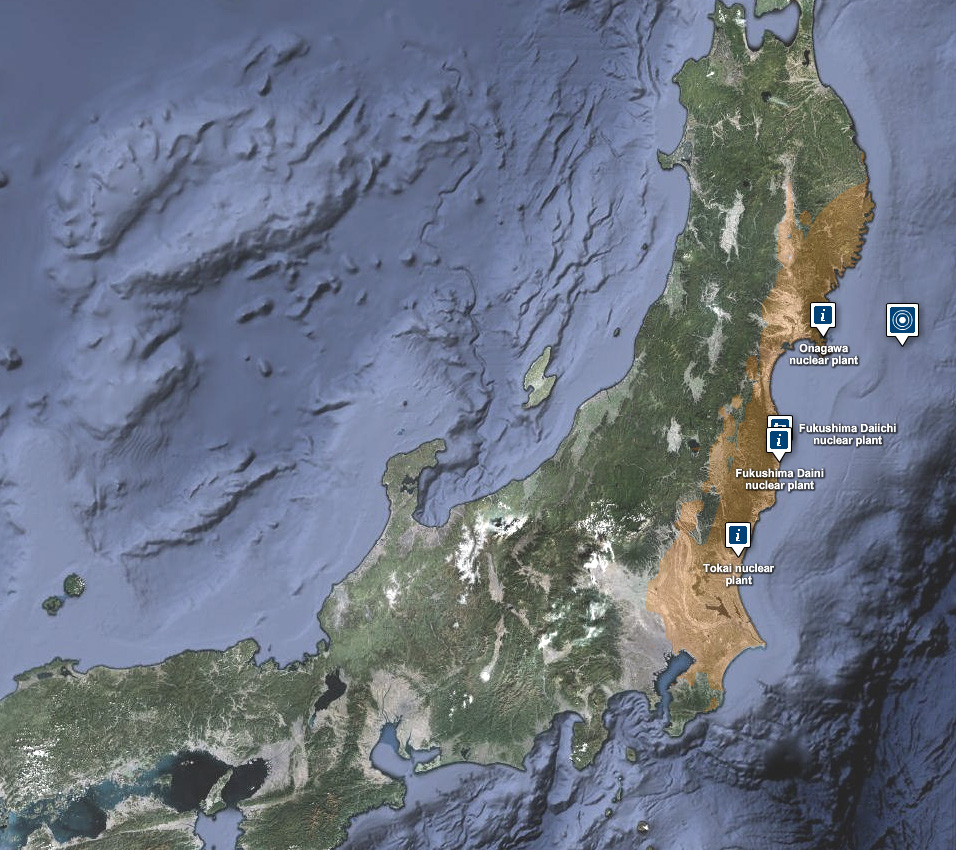
Model runs from the Center for Tsunami Research at the NOAA Pacific Marine Environmental Laboratory show the expected wave heights of the tsunami as it travels across the Pacific basin. The largest wave heights are expected near the earthquake epicenter, off Japan. The wave will decrease in height as it travels across the deep Pacific but grow taller as it nears coastal areas. In general, as the energy of the wave decreases with distance, the near shore heights will also decrease (e.g., coastal Hawaii will not expect heights of that encountered in coastal Japan).The second image shows the depth of the Pacific Ocean floor. Notice the similarity between areas of low wave height and deeper areas of the ocean.

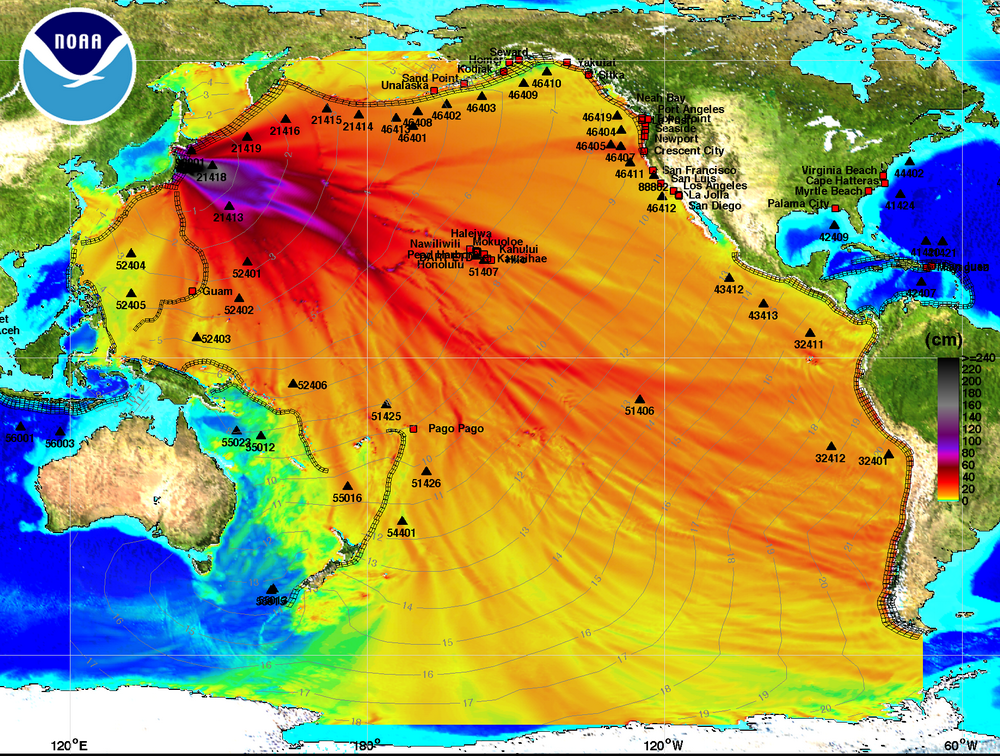
Below is an image visualizing the maximum amplitude plot for the tsunami wave.

Click here on the NOAA Center for Tsunami Research home page to download a Google Earth KMZ file with the maximum amplitude plot data shown in the visualization above.

And finally, a video showing the propagation of the tsunami wave.

httpv://www.youtube.com/watch?v=PBZGH3yieLc

From the NOAA Center for Tsunami Research:

Propagation of the March 11, 2011 Honshu tsunami was computed with the NOAA forecast method using MOST model with the tsunami source inferred from DART® data. From the NOAA Center for Tsunami Research, located at NOAA PMEL in Seattle, WA. See http://nctr.pmel.noaa.gov/honshu20110311


Categories
Crisis-Mapping General GIS GIS in Political Science Slideshow

Visualizing Japan crisis map inputs

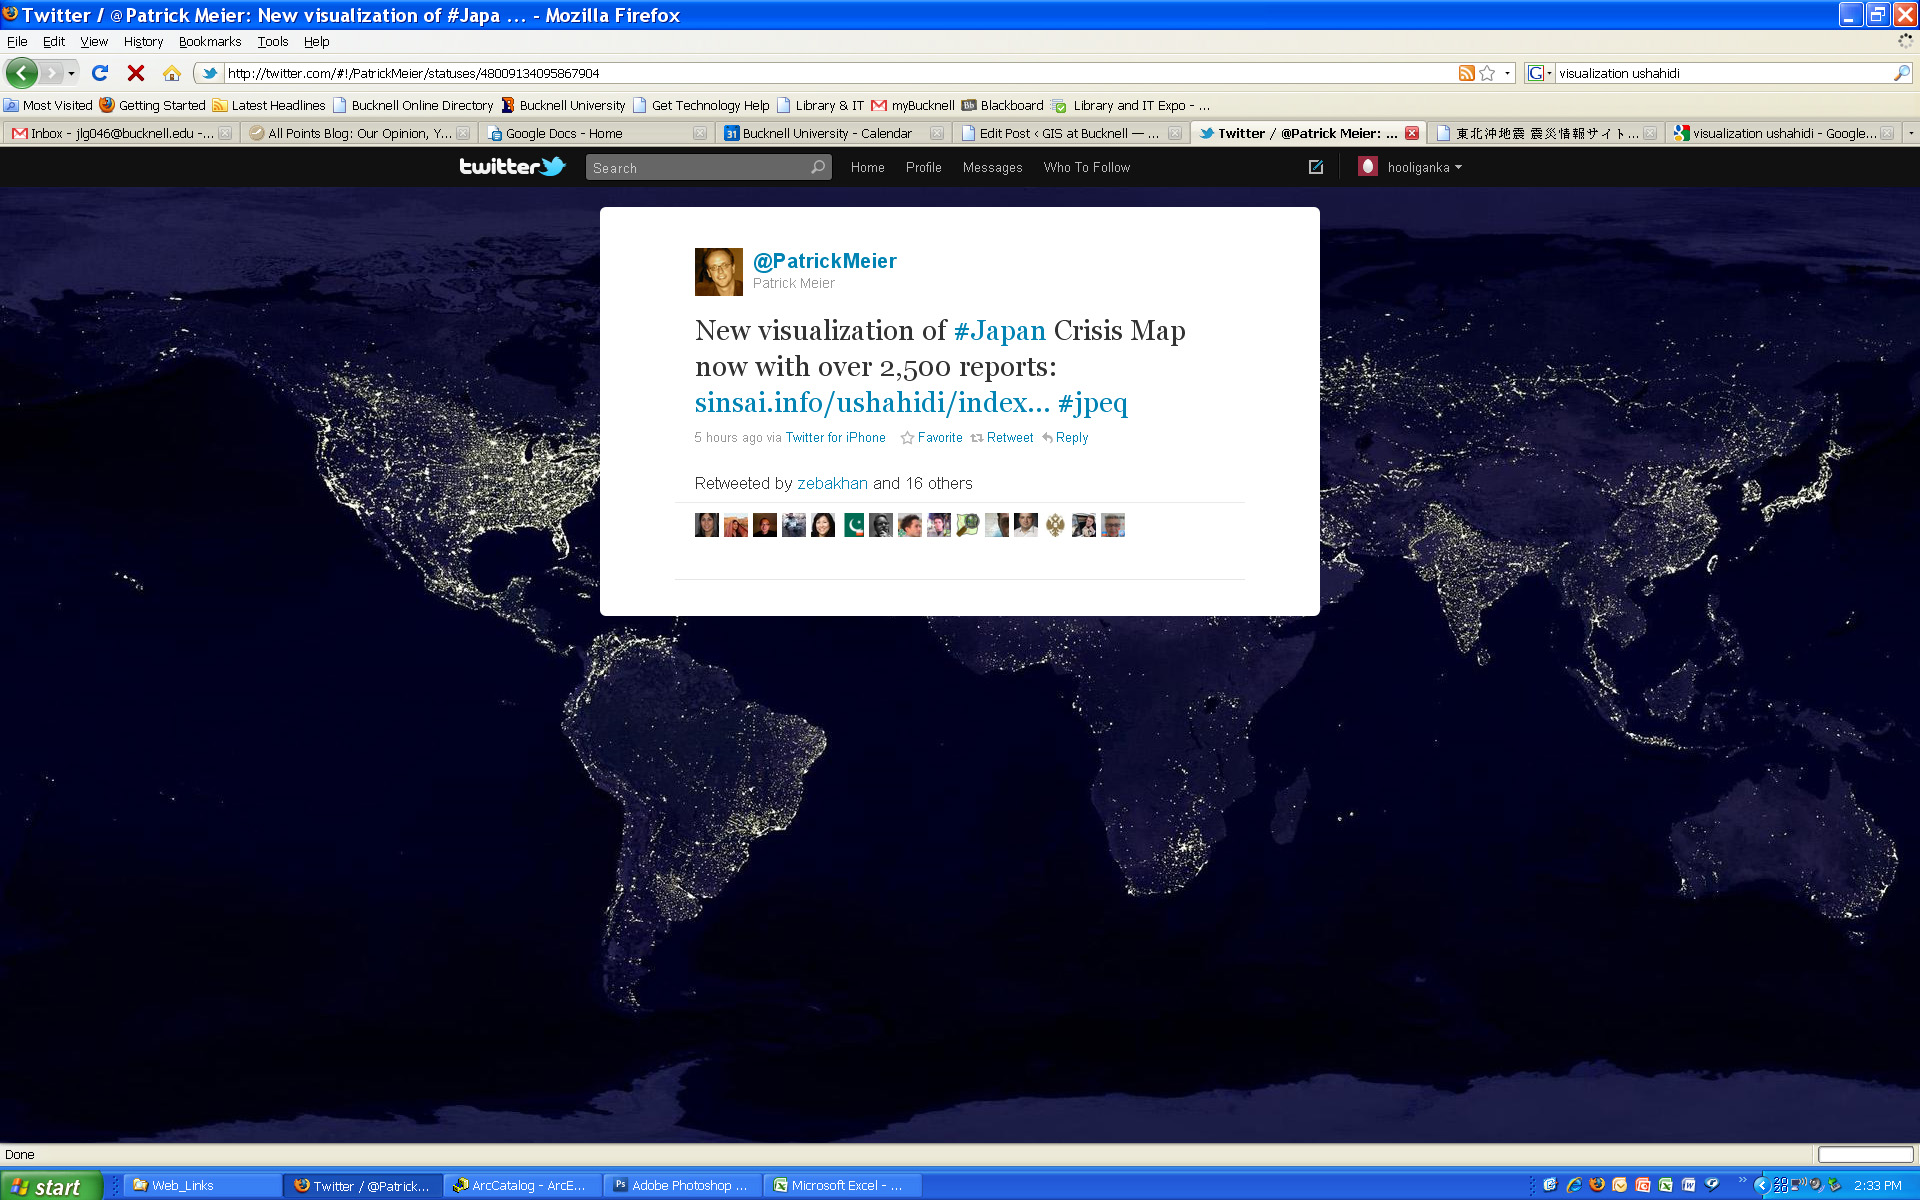
Here’s a new visualization that shows the locations worldwide that are submitting reports to the Ushahidi Japan Crisis Map. Click on the map to see full size image.


Categories
Crisis-Mapping General GIS GIS in Political Science Slideshow

Japanese earthquake – disaster/response maps

Here are some links to maps and map apps related to the Japanese earthquake and tsunami.  I’ll add more as they are released.

  • JapanQuakeMap, an animated, time-lapse visualization of the earthquake and its aftershocks created by Paul Nicholls, developer of the Christchurch Quake Map website.  From the website:
    The Japan Quake Map on this website pesents a time-lapse visualisation of the Sendai earthquake and its aftershocks, primarily to help those outside the affected area understand what the people of Japan are experiencing. It plots earthquake data from USGS on a map using the Google Maps API, with the size of the circle denoting the magnitude (the higher the magnitude, the larger the circle) and the colour showing the focal depth (see the legend below the map).
  • Click here to view the main page for Ushahidi’s Japan crisis mapping tool (in Japanese). Click here to view the Big Map. These pages use the Ushiadi platform to collect and display crowdsourced info (SMS, e-mail, Twitter, Flickr, YouTube, etc.). About the Ushahidi site:

Anyone on the ground can text in the location of a trapped person, and these locations are then collected on a map. You can also text in where to find aid, a pop-up hospital or a precarious building that should be avoided.  Good.is

  • Also from Ushahidi, a Radiation Map that uses the Crowdmap platform.  The radiation map is in both Russian and English and has other language options available.
  • Map of seismic activity in the 7 days leading up to the earthquake – from MapLarge (note: as of Wed. March 16th the MapLarge site is down – too much traffic?)
  • What is crisis mapping and how does it work? Click here to read Patrick Meier’s answer to that. Meier is the Director of Crisis Mapping at Ushahidi and co-founder of the International Network of Crisis Mappers.