Categories
Bucknell/Local Interest Data Environment Events/Calendar General GIS GIS in Engineering GIS in Environmental Studies GIS in Geography GIS in Geology Miller Run Restoration Project Slideshow

Come watch the Flying Bison!

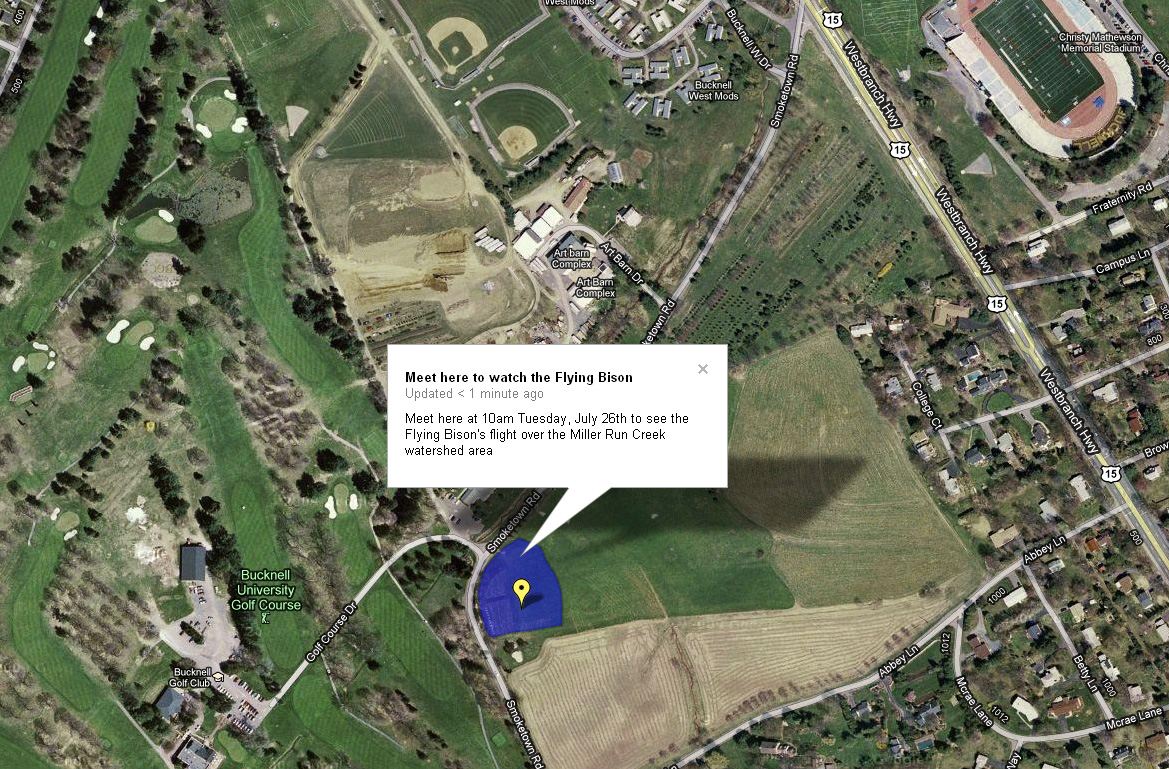
Come watch the Flying Bison capture high resolution aerial imagery of the Miller Run Creek watershed area. The flight is part of the work that the GIS Student assistants are doing this summer in support of the Miller Run Restoration project. Details and map below.

What: Come see the Flying Bison take off. Flight will last roughly 30 minutes. The Flying Bison drone will take off and land at the same location (see below)

When: Tuesday, July 26th at 10am

Where:  Tee box behind the new Bucknell Golf Course driving range building.  See map below (note that it does not show the new driving range building – underscoring the need for updated aerial images!):

Categories
Bucknell/Local Interest Data Environment General GIS GIS in Engineering GIS in Environmental Studies GIS in Geography GIS in Geology Miller Run Restoration Project Slideshow

Miller Run Restoration

In January of 2011, Bucknell received a 178K grant through PA DEP’s Growing Greener program to support the first phase of a project that will restore the Miller Run Creek (that runs through campus and the golf course) and provide flood relief to the surrounding areas.  Bucknell’s GIS Student Assistants are supporting the Miller Run Restoration project by collecting high resolution aerial imagery (using a drone) and elevation data (using an RTK survey system and high accuracy GPS).  We’ll post more about the project in the next few weeks, but for now here are a few pictures of Team Survey.

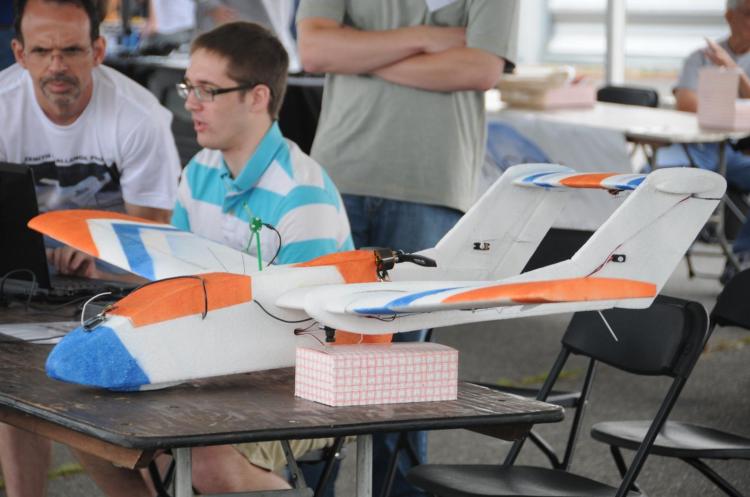
Nick Urban, Computer Science ’12 – designing, building and flying an aerial drone to capture high resolution imagery of the campus area

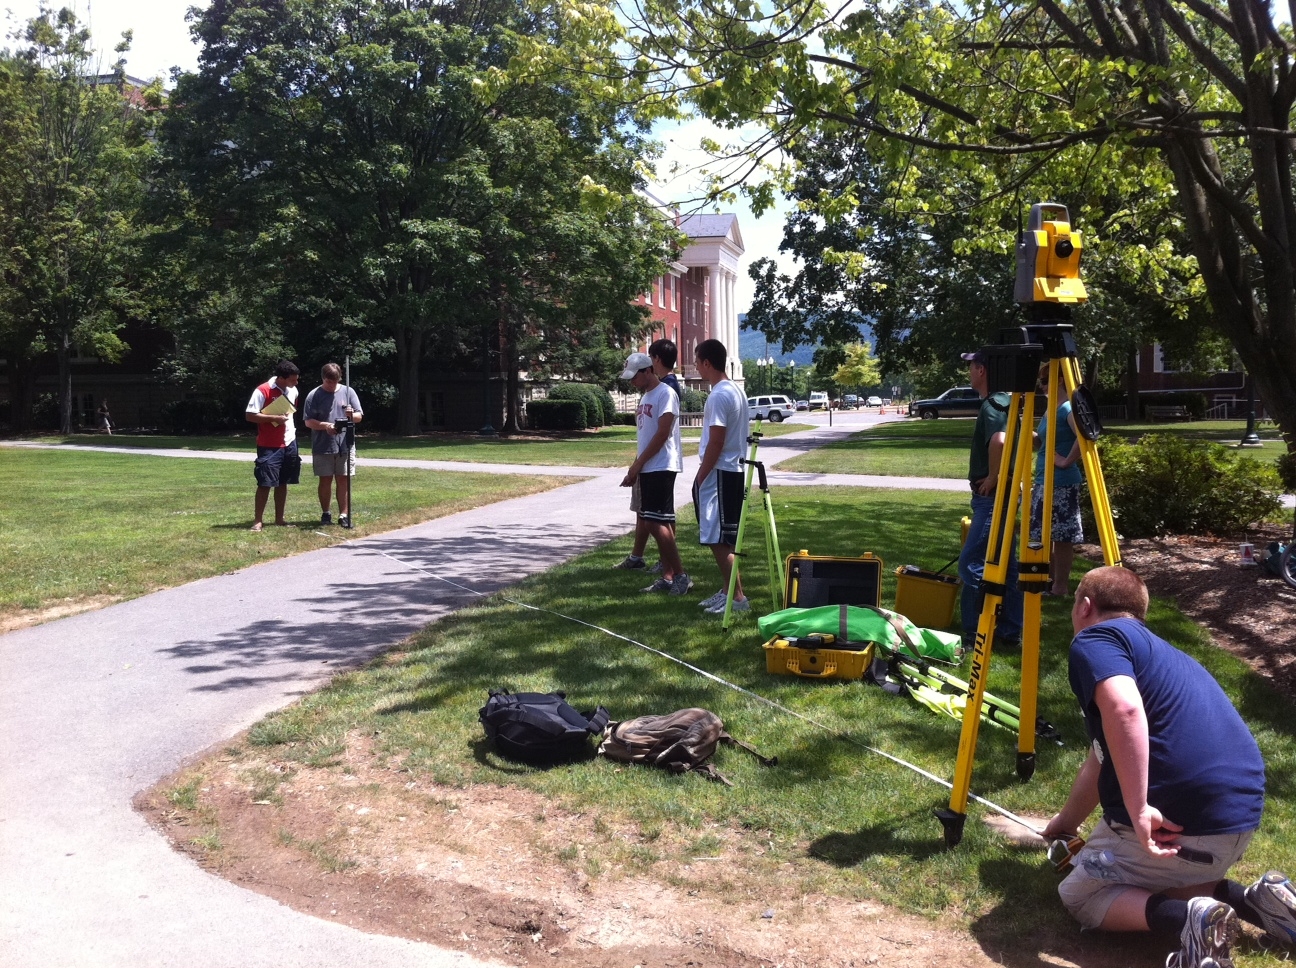
Max Stiss, Geography/Anthropology ’12 – collecting GPS data near Abbey Lane for the Miller Run Restoration Project

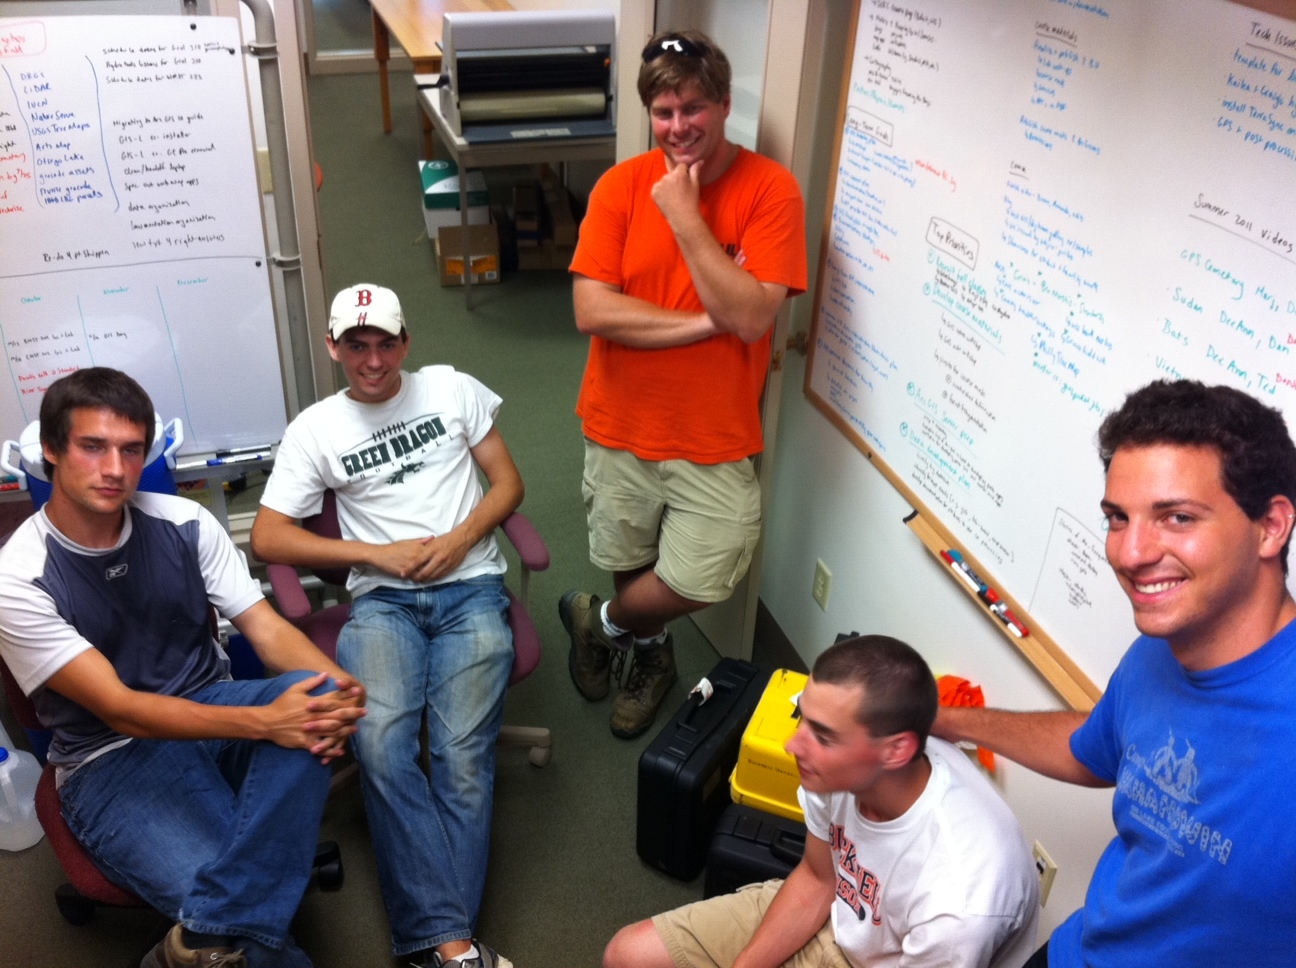
From L to R, clockwise: Mike Grasso, Environmental Studies ’13; Dan Dougherty, Geography/History ’12; Prof. Rob Jacob, Geology; Dan Dougherty, Geography/History ’12; Max Stiss,
Geography/Anthropology ’12 uploading GPS data after a day in the field

Training on the RTK System before heading out in the field:

Categories
Data General GIS GIS in Art GIS in Computer Science Slideshow Videos

Phone-call cartography

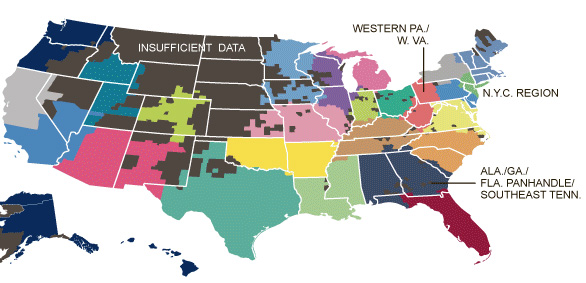
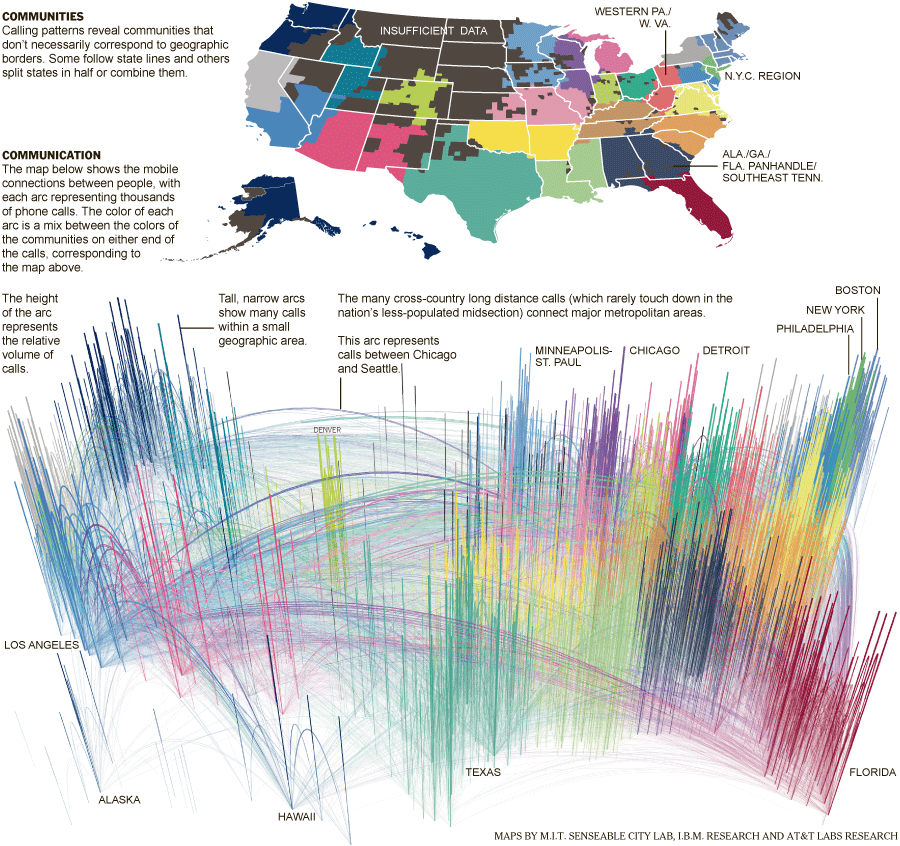
Here’s a link to an interesting NYT story, “Phone-call cartography,”  on mapping connectedness via data points from mobile phone calls.  The accompanying map was produced by M.I.T.’s SENSEable City Lab using the origin and end point locations for cellphone traffic within the U.S. in July of last year.

Phone-call cartography video:

httpv://www.youtube.com/watch?v=eFKZnbIAboI

Phone-call cartography map:


The “Phone-call cartography” map project is just the latest in a long series of projects the SENSEable City Lab has done using cellphone data to explore the idea of connectedness.  In 2008, the group produced a map installation called “New York Time Exchange” for the NYC MoMA’s ‘Design and the Elastic Mind’ exhibition. The installation featured wall-sized maps displaying nearly real-time data on cellphone calls with origins and/or destinations in the New York City area. See this Newsweek article or this NYT article for more information about the “New York Time Exchange” exhibit and how SENSEable’s research is informing our understanding of globalization, the digital divide and other measures of connectedness.

Click here to read an article about SENSEable’s use of real-time cell phone data to analyze the economic impact of New York City’s 2008 ‘Waterfalls’ exhibit in New York Harbor.

Categories
Bucknell/Local Interest Data Digital Humanities Environment General GIS GIS in Biology GIS in Computer Science GIS in Engineering GIS in Environmental Studies GIS in Geography GIS in Geology GIS in History GIS in Humanities GIS in Psychology GIS in Sociology Map Apps Marcellus Shale Miller Run Restoration Project Slideshow

What we’re up to this summer (and why we’re not posting)

Thanks to the Mellon grant and a huge number of faculty teaching and research projects it’s been a very busy summer of GIS work at Bucknell.  Over the coming weeks I’ll write detailed posts about the work we’re doing on each of the projects.  If I’m really ambitious I might try to post some interviews with faculty and students – and some footage of the aerial drone flights that Nick Urban ’12 is doing. But for now here’s a short overview of who’s doing GIS work at Bucknell this summer and what we’re doing:

GIS Student Assistants:

  • Chad Lawlis, Environmental Studies ’11
  • Dan Dougherty, Geography/History ’12
  • Max Stiss, Geography/Anthropology ’12
  • Nick Urban, Computer Science ’12
  • Mike Grasso, Environmental Studies ’13
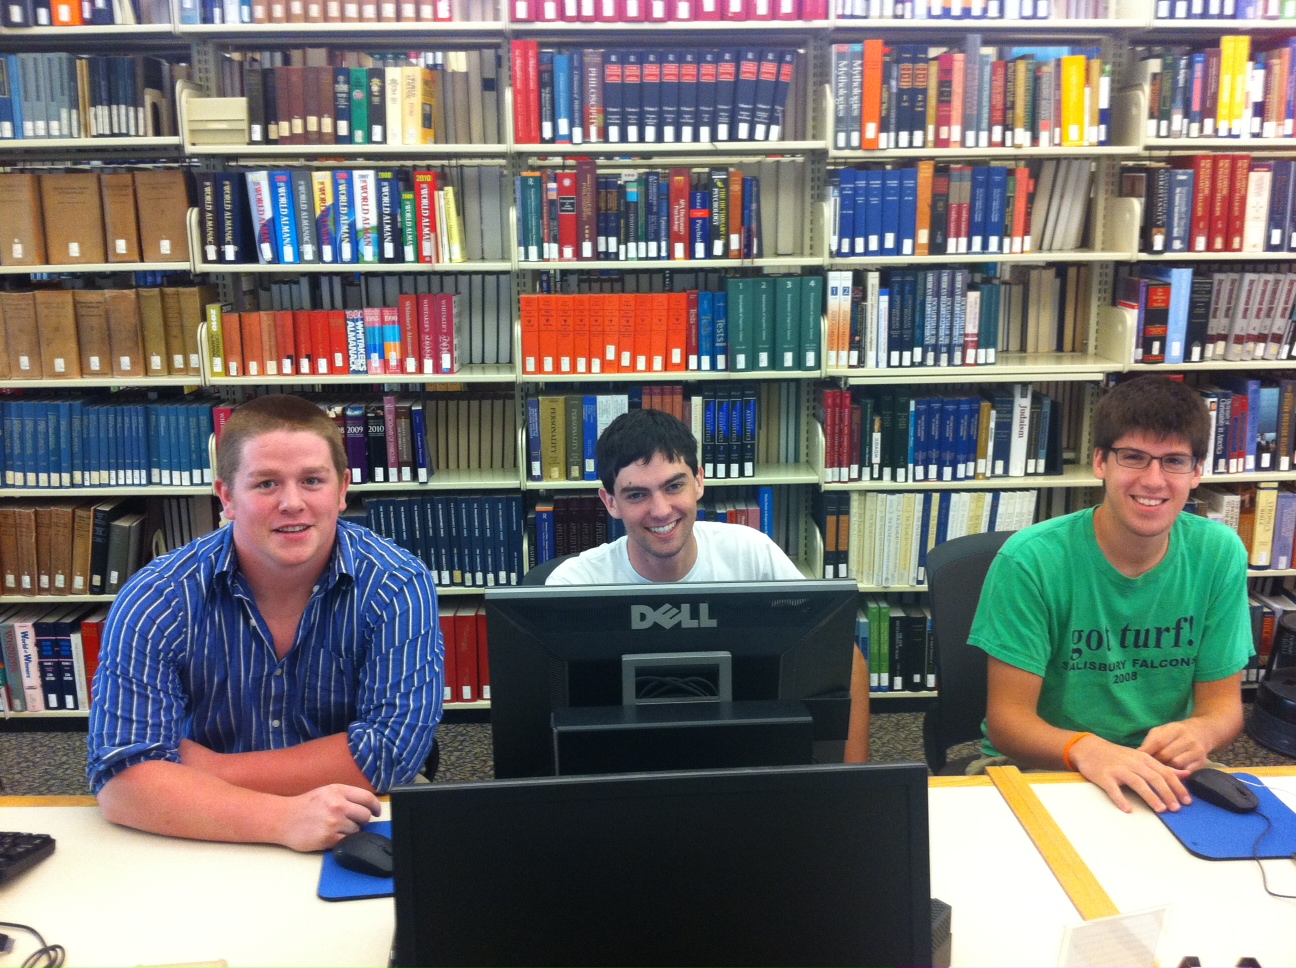
  • Robby Holler, Geography/International Relations ’13 (pictured below)
  • Darin Rockwell, Geography/Geology ’13 (pictured below)
  • Dan Ladd, Middlebury College ’14 (pictured below)

Key Projects:

  • Maps for Sudan field guide atlas to mammals
  • GPS data collection for Lewisburg Cemetary
  • GPS data collection for Miller Run restoration project
  • Aerial drone data collection for Miller Run restoration project
  • Lycoming County/Williamsport community asset mapping
  • Mapping toxic contamination from Marcellus Shale natural gas wells
  • Mapping locations of Marcellus Shale water withdrawl permits
  • Georeferencing & vectorizing 19th century economic maps of Vietnam
  • Georeferencing & vectorizing maps of environmental hazards and resources in Kyrgyzstan
  • Georeferencing & vectorizing 1868 Historic Atlas of Union & Snyder Counties
  • Data development for Stories of the Susquehanna project
  • Support for student research projects – including GPS’ing dumpster locations on campus for an analysis of campus waste and recycling, and updating Arboretum tree dataset with location info for newly planted and felled trees
  • Develop pilot web map apps for showcasing faculty research
  • Develop pilot web map apps for use in teaching
  • Implement backend IT infrastructure to support ArcGIS server
  • Maps for Bucknell admin purposes, including: analysis of parking shortages on campus; maps for task force report on campus climate; maps for SBDC report on services by county; arts festival map.


Categories
Bucknell/Local Interest Environment Events/Calendar General GIS GIS in Biology Slideshow

Do turtles with more powerful predators have stronger shells?

Do turtles with more powerful predators have stronger shells?

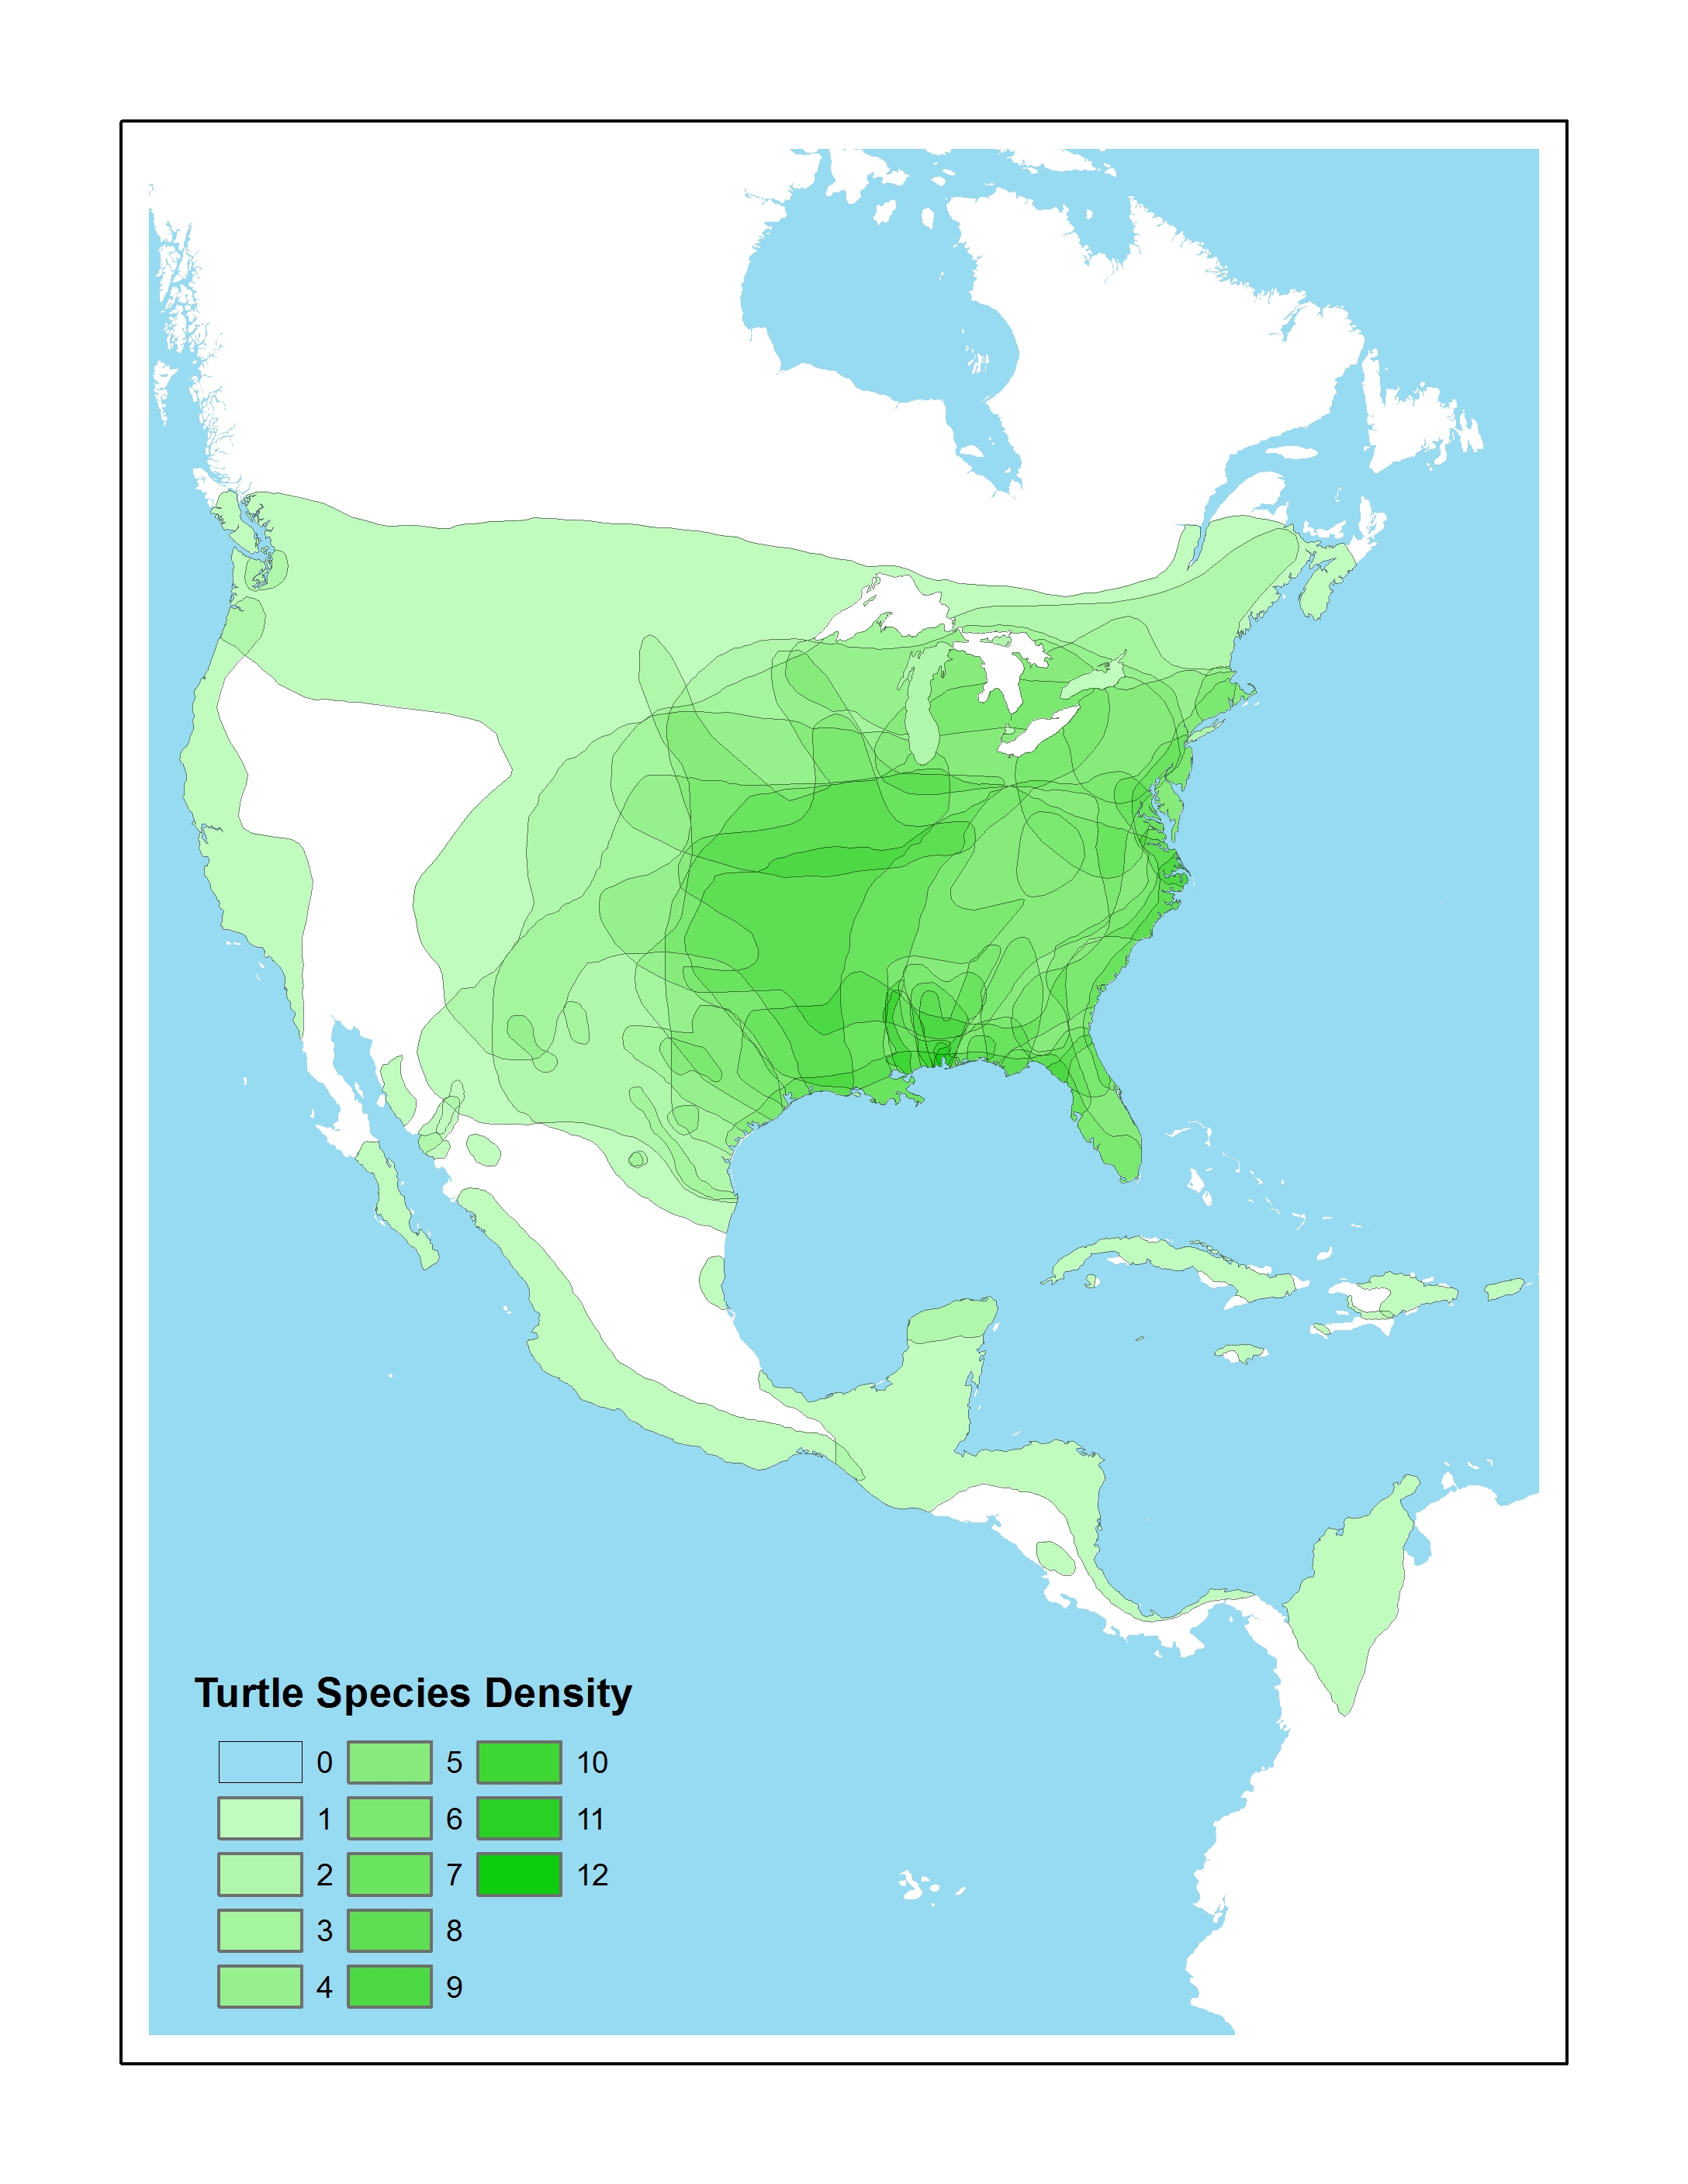
Over the last year, Biology professor Tristan Stayton used GIS and finite element analysis methods to explore this question. During Summer 2010, Prof. Stayton participated in a Library & IT workshop designed to give faculty hands-on experience using GIS for academic research and teaching.  Over the course of the summer, Prof. Stayton and his student researchers used ArcGIS to georeference and digitize turtle species ranges to convert them from image files into GIS data that could be used as input in Prof. Stayton’s analysis.  The same techniques were also used to digitize the ranges of 25 known turtle predators.

During the 2010-11 academic year, Prof. Stayton used the GIS datasets created during summer 2010 to calculate range sizes and range overlaps of turtles and their predators – and then to derive measures of turtle predation pressure. Prof. Stayton presented his conclusions last month at the Evolution 11 conference in Norman, Oklahoma and has a paper in the works as well.

The answer to the question? The short answer is that no, turtles with more powerful predators do not have stronger shells – in fact, they appear to have evolved weaker shell shapes.  But be sure to look at the poster below for a full presentation of the methodology, results and possible explanations for the findings.
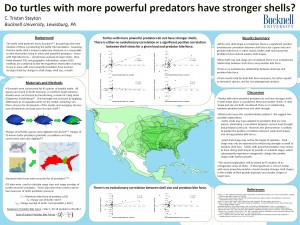
Students involved in this project: Christine Vega ’11, Patrick Caloz ’13 and Joe Budzinski ’11 (georeferencing & vectorizing species ranges); Dan Ladd, GIS Student Assistant, Middlebury College ’14 (created turtle species density map shown in poster)