Categories
Bucknell/Local Interest Data Digital Humanities Environment Events/Calendar General GIS Marcellus Shale Slideshow

GIS Students Showcase Their Summer Work at Two Symposiums

Guest post by Dan Dougherty, Geography/History ’12
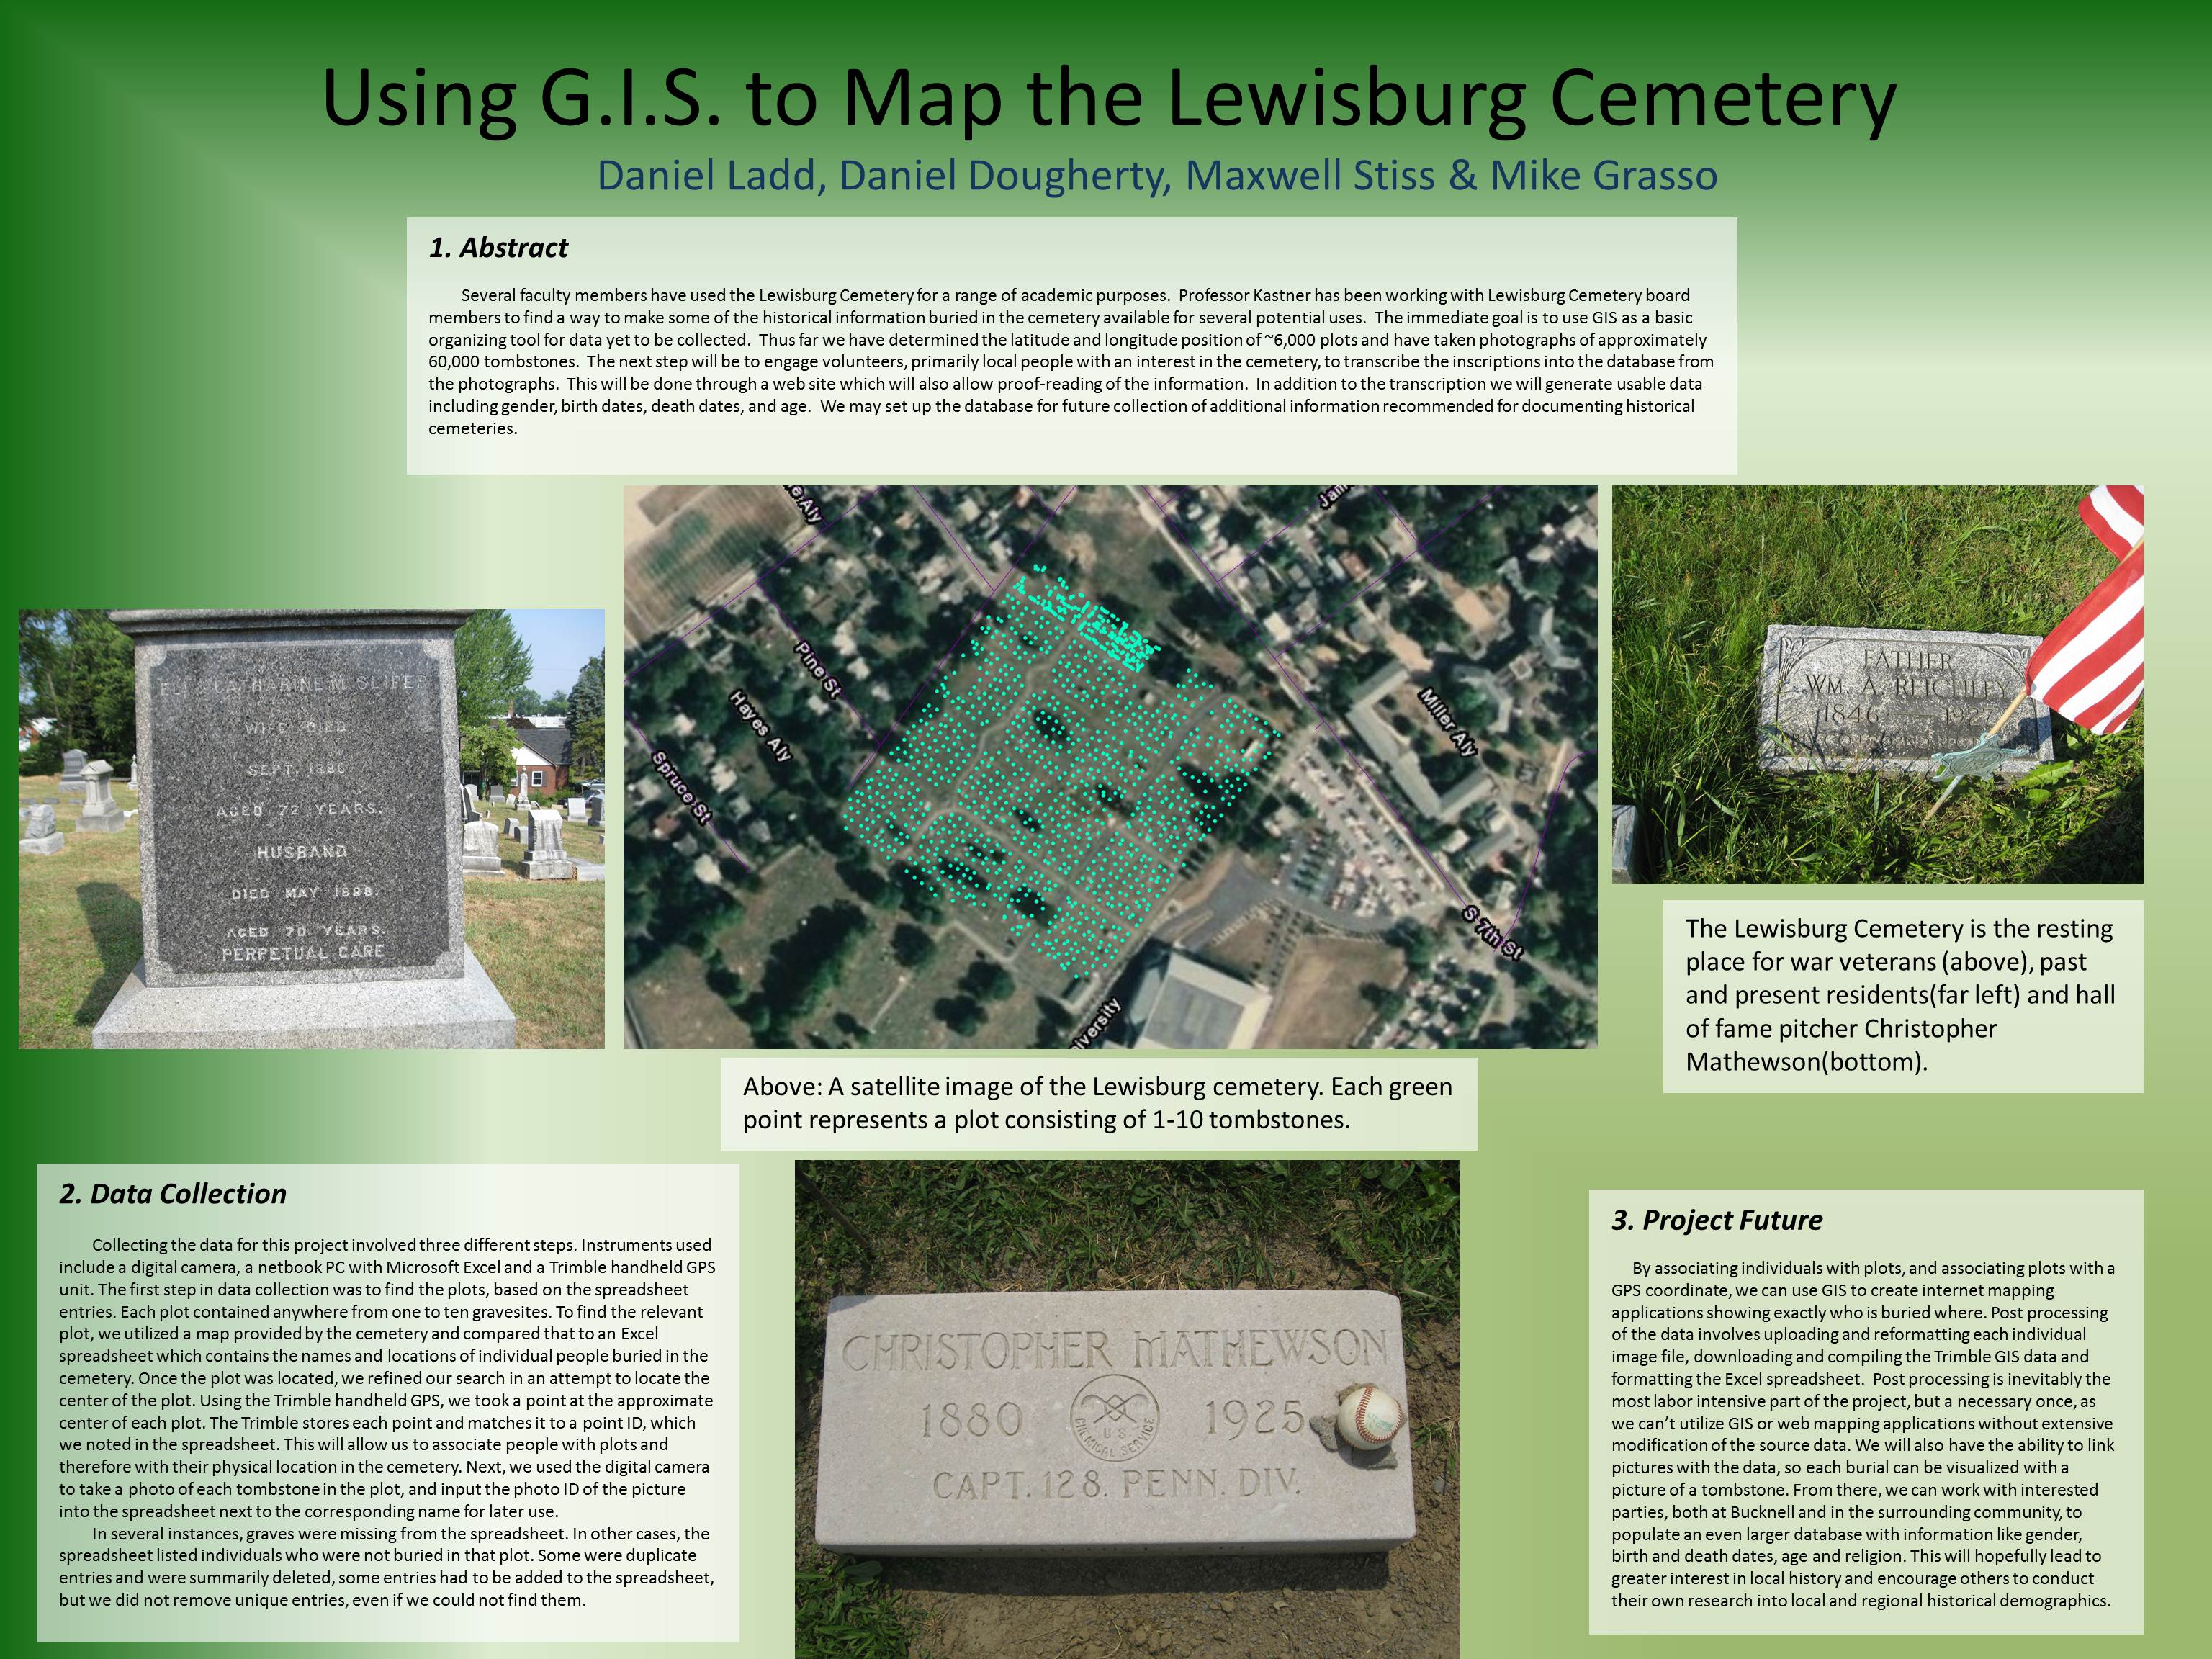
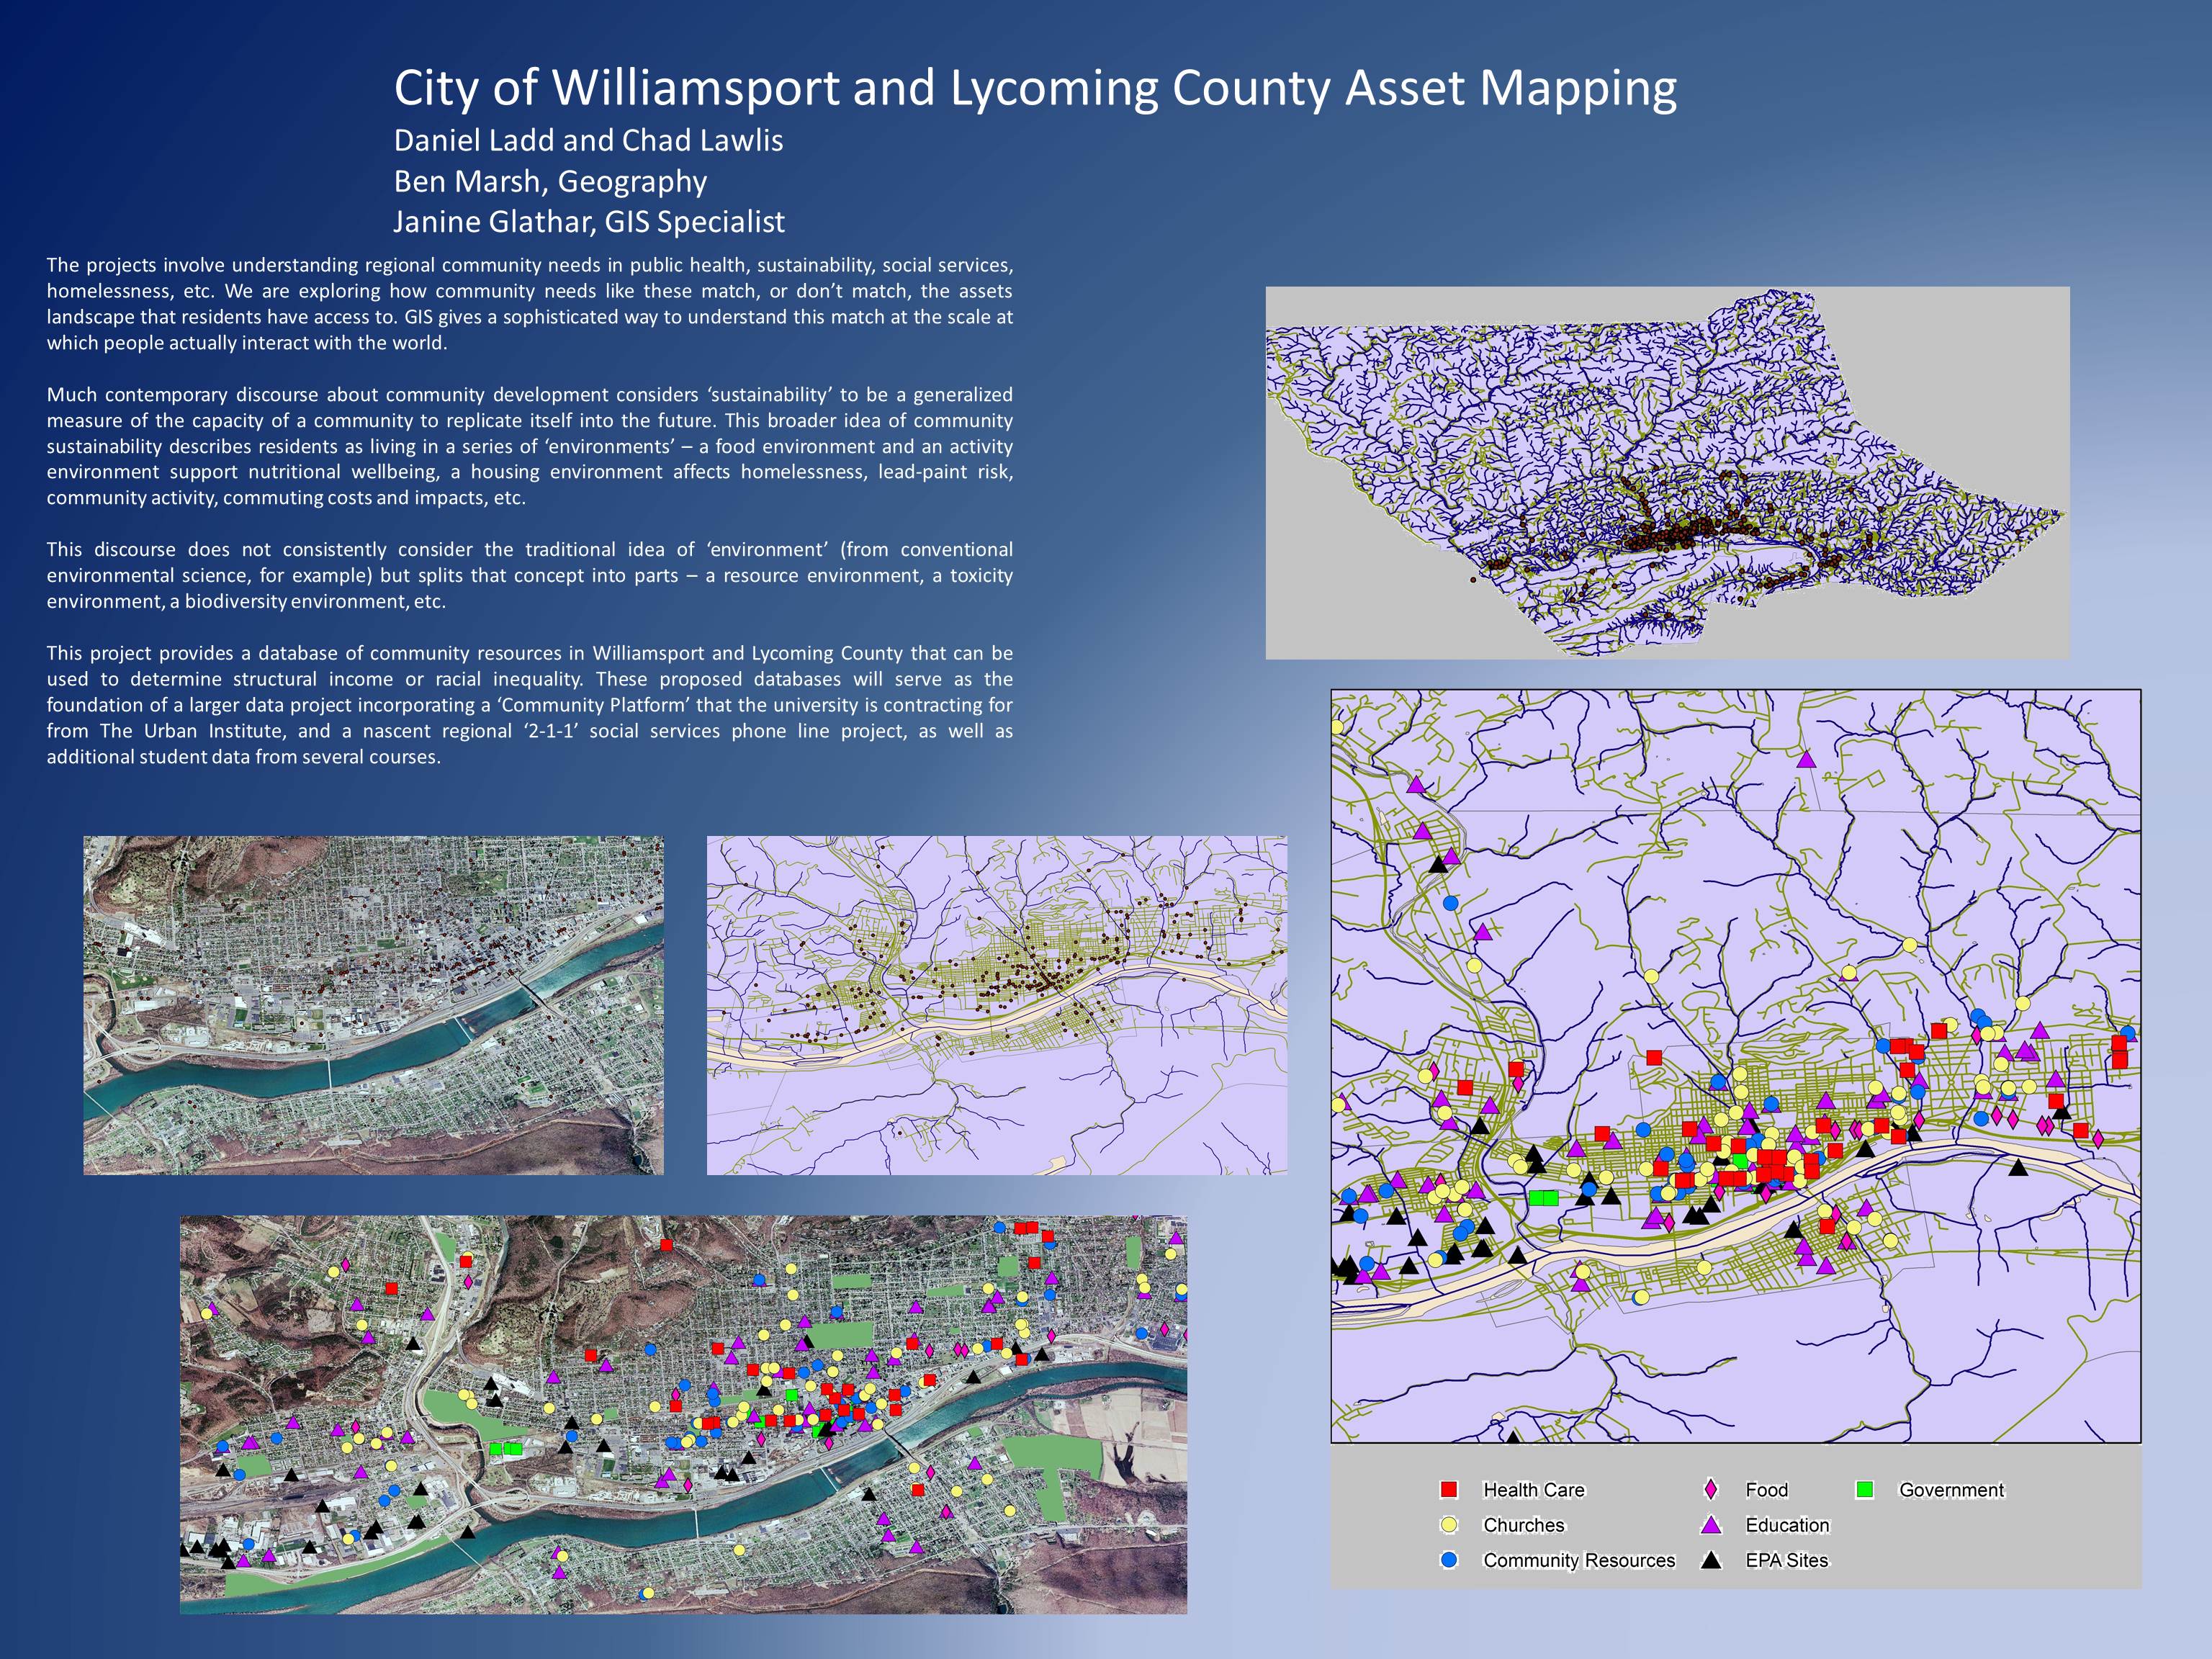
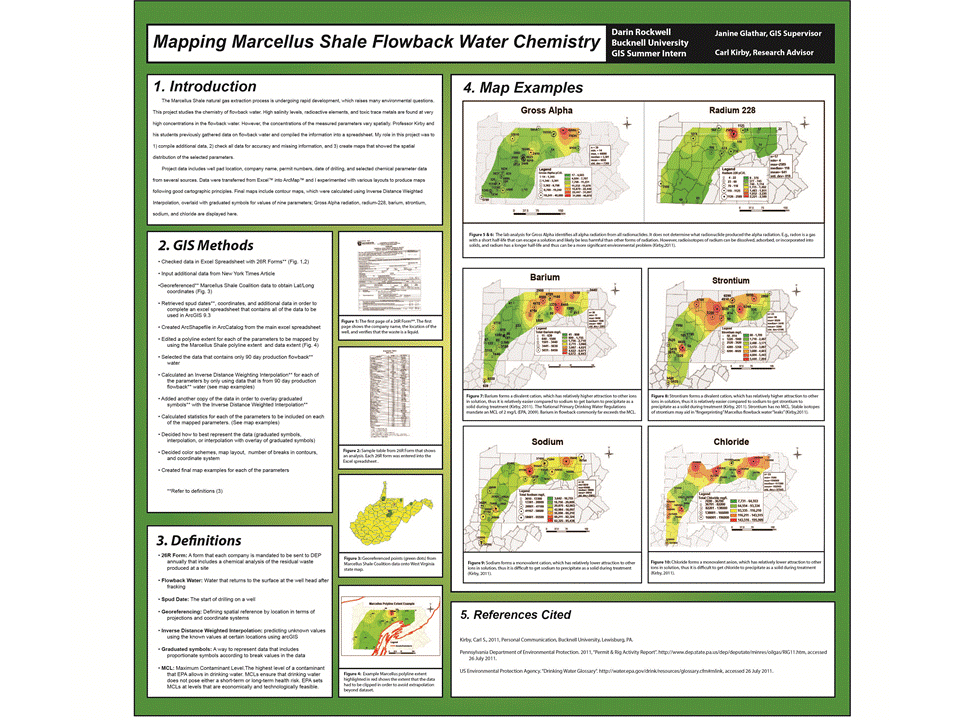
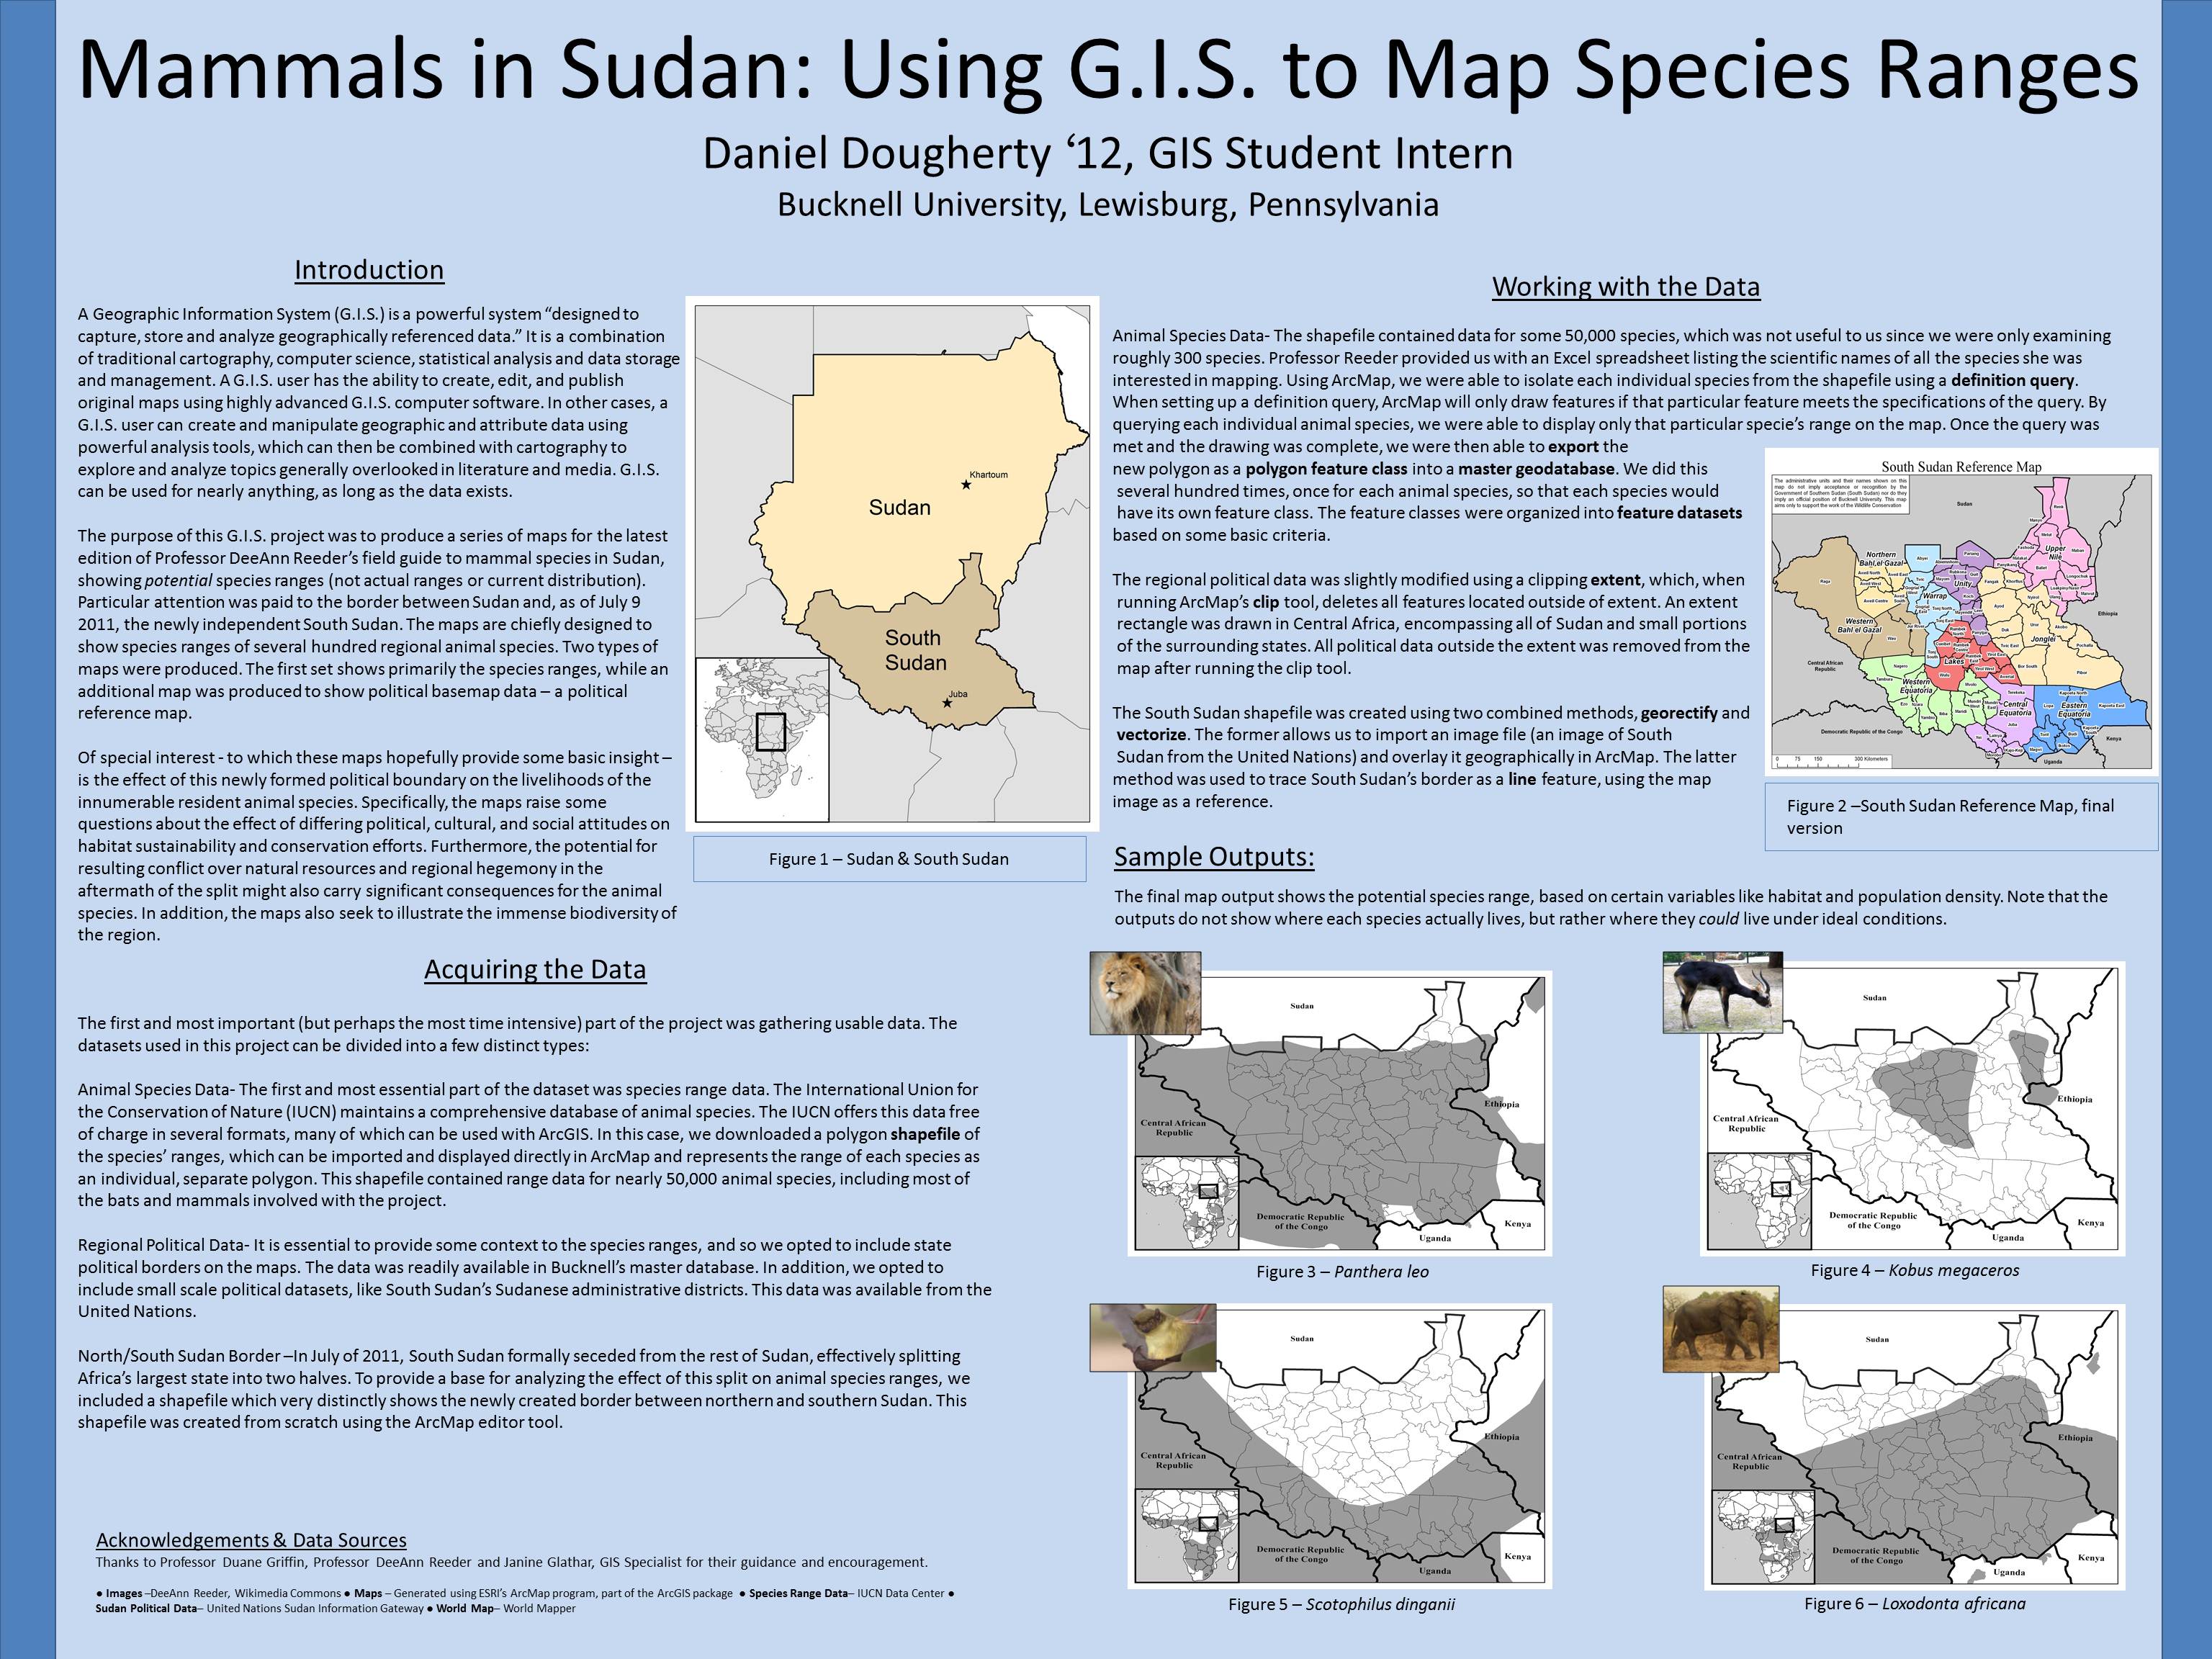
Bucknell’s summer GIS students recently got the opportunity to showcase their work at two separate poster symposiums. It helps to know a little bit about research/poster symposiums, for those who are unfamiliar. They are fairly straightforward. Participants set up their posters in a preassigned display location. Standing close by their posters, students field questions from interested attendees who wander the showcase, viewing posters of interest. The posters generally outline the basics of the research project first, before moving on to explain the more detailed aspects, like methodology and an analysis of the results. Space is limited so not everything can (and should!) be explained on the poster – and the student therefore must be prepared to answer fully any questions an attendee might ask. Many poster sessions are judged, with the winner awarded a prize (usually monetary). However, neither symposium the GIS students attended was judged.

GIS students attended their first symposium on Wednesday, July 27, 2011. The Sigma Xi Poster Session was held in Bucknell’s Terrace Room, located in the Elaine Langone Center. Approximately 50 students presented their work; six GIS students with eight separate posters were among them. Dozens of people turned out to view the posters, including Bucknell faculty, administrators, and members of the local community. Provost Mick Smeyer was among the attendees, and was so impressed with the quality and consistency of the work that he asked all attendees to repeat the session again in September for Bucknell’s President, John Bravman, and the Board of Trustees.

Students attended a second symposium on August 9, 2011 from 10am to 3pm. The First Annual Susquehanna Valley Undergraduate Research Symposium was held at the Geisinger Center for Health Research in Danville, Pennsylvania, about 30 minutes from Bucknell’s campus. Students from both Bucknell University and Bloomburg University were in attendance to showcase their summer research projects to their peers, interested academics, and Geisinger staff members. Bucknell’s GIS students contributed seven posters to the symposium, all of which received substantial praise and recognition.
Categories
Bucknell/Local Interest Environment Events/Calendar General GIS Slideshow

GIS posters at Sigma Xi summer research symposium

Come to the Sigma Xi summer research symposium on Wednesday, July 27th from 2-4pm at the Langone Center’s Terrace room to check out posters by student researchers.  There will be a variety of posters that feature GIS as a research methodology and/or visualization tool – including posters about the Flying Bison drone, community asset mapping, georeferencing historic maps, Marcellus Shale research, recycling & waste at Bucknell and other topics.

Categories
Bucknell/Local Interest Data Environment Events/Calendar General GIS GIS in Engineering GIS in Environmental Studies GIS in Geography GIS in Geology Miller Run Restoration Project Slideshow

Come watch the Flying Bison!

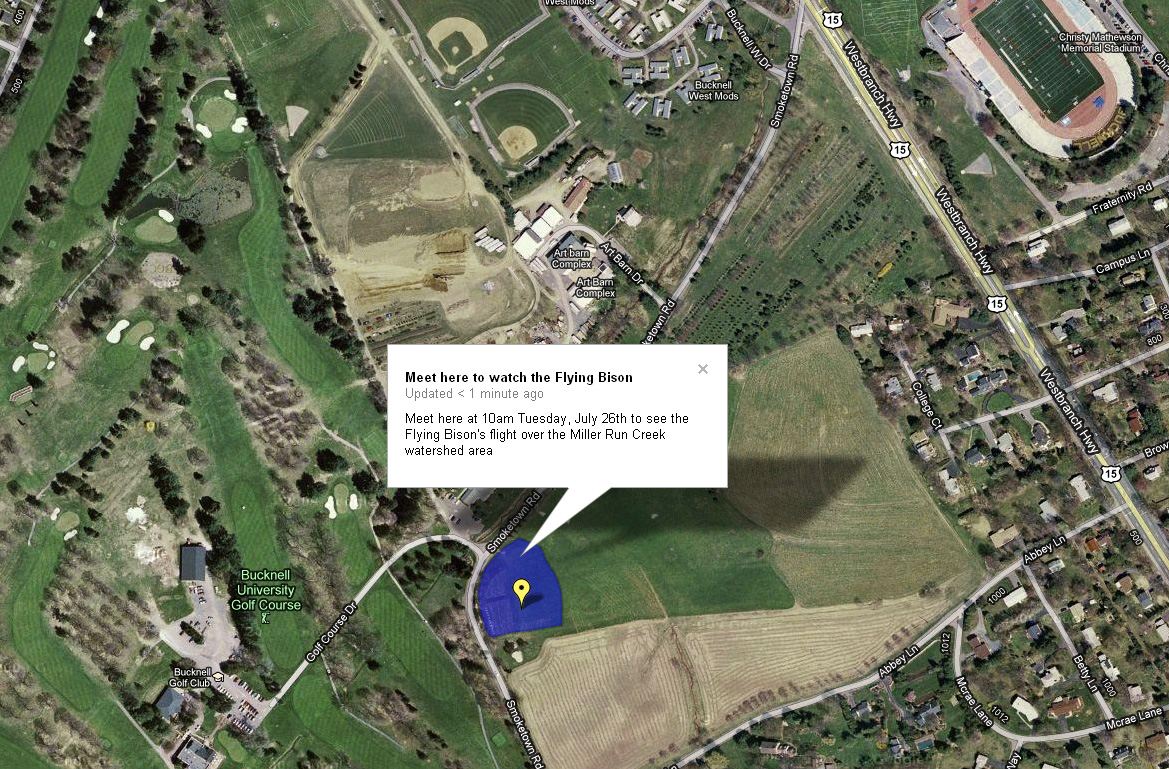
Come watch the Flying Bison capture high resolution aerial imagery of the Miller Run Creek watershed area. The flight is part of the work that the GIS Student assistants are doing this summer in support of the Miller Run Restoration project. Details and map below.

What: Come see the Flying Bison take off. Flight will last roughly 30 minutes. The Flying Bison drone will take off and land at the same location (see below)

When: Tuesday, July 26th at 10am

Where:  Tee box behind the new Bucknell Golf Course driving range building.  See map below (note that it does not show the new driving range building – underscoring the need for updated aerial images!):

Categories
Bucknell/Local Interest Environment Events/Calendar General GIS GIS in Biology Slideshow

Do turtles with more powerful predators have stronger shells?

Do turtles with more powerful predators have stronger shells?

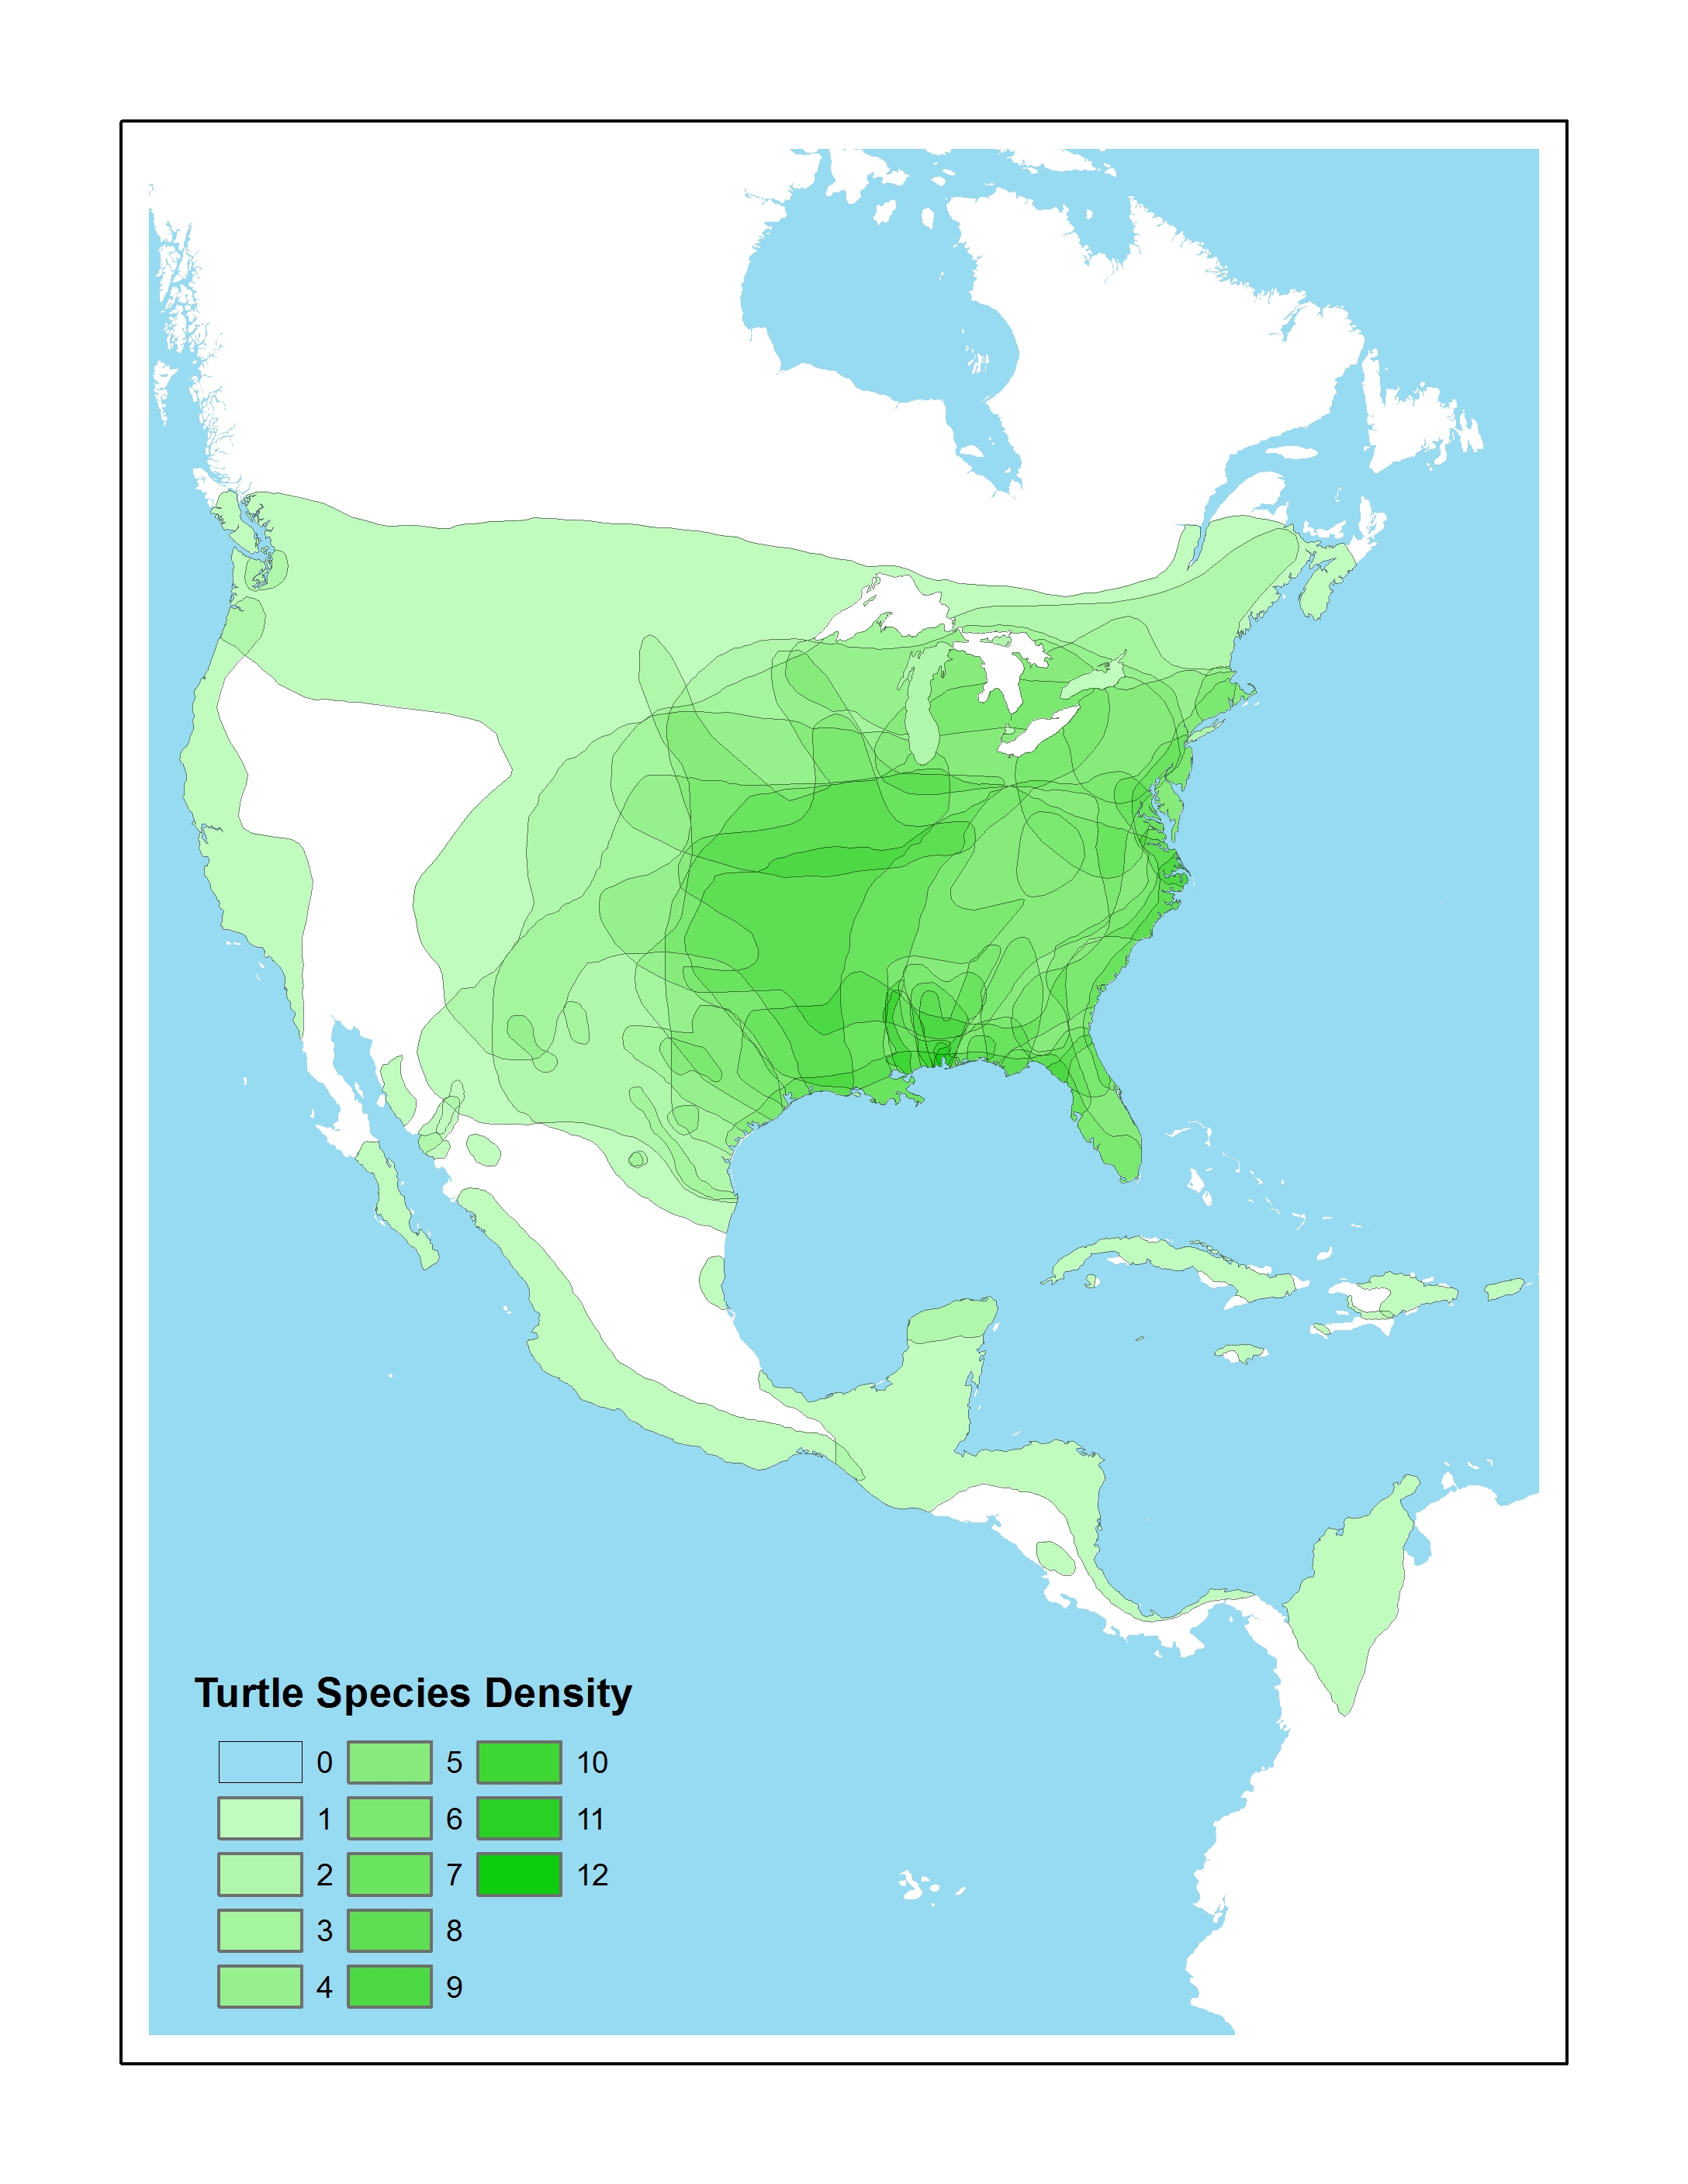
Over the last year, Biology professor Tristan Stayton used GIS and finite element analysis methods to explore this question. During Summer 2010, Prof. Stayton participated in a Library & IT workshop designed to give faculty hands-on experience using GIS for academic research and teaching.  Over the course of the summer, Prof. Stayton and his student researchers used ArcGIS to georeference and digitize turtle species ranges to convert them from image files into GIS data that could be used as input in Prof. Stayton’s analysis.  The same techniques were also used to digitize the ranges of 25 known turtle predators.

During the 2010-11 academic year, Prof. Stayton used the GIS datasets created during summer 2010 to calculate range sizes and range overlaps of turtles and their predators – and then to derive measures of turtle predation pressure. Prof. Stayton presented his conclusions last month at the Evolution 11 conference in Norman, Oklahoma and has a paper in the works as well.

The answer to the question? The short answer is that no, turtles with more powerful predators do not have stronger shells – in fact, they appear to have evolved weaker shell shapes.  But be sure to look at the poster below for a full presentation of the methodology, results and possible explanations for the findings.

Students involved in this project: Christine Vega ’11, Patrick Caloz ’13 and Joe Budzinski ’11 (georeferencing & vectorizing species ranges); Dan Ladd, GIS Student Assistant, Middlebury College ’14 (created turtle species density map shown in poster)


Categories
Bucknell/Local Interest Events/Calendar General GIS Map Apps Slideshow

Upcoming map competitions

Students – now that you are finished with your final GIS projects (you are finished, right?) why not submit them to one of these upcoming competitions. Bucknell students have won awards in other map competitions – let’s do it again:

1. 2011 National Council for Geographic Information (NCGE) Conference & Map Gallery:

The 2011 NCGE Map Gallery Committee invites you to submit a map for display during the 2011 Conference.  All GIS maps are welcome.  The maps will be judged by a panel of peers, with the exception of the People’s Choice Award, which will be voted on by the Conference attendees.  The Map Contest will feature two award categories and the winners will be announced at the closing session on Saturday, August 6, 2011.  Please review the minimum requirements and categories carefully when designing the content of your map entry.

Awards
Best Cartographic Design (Higher Ed., K-12 & People’s Choice) – Awarded to the map that artistically employs the elements of cartography without compromising use and functionality. Maps will be judged on fundamental cartographic principles including figure ground representations, visual hierarchy, color selection, typography, symbology, overall aesthetic appearance, etc.

Best Analysis (Higher Ed., K-12 & People’s Choice) – Awarded to the map that is best designed to display the results of spatial data analysis and presents the information in an unbiased way, allowing the viewer to extract their own conclusions, utilizing the map as a tool.

For guidelines & to submit maps, click here.

2. ESRI’s ‘Storytelling with Maps’ Competition.

Every map tells a story. Share your most interesting web map or mobile app in our Storytelling with Maps Contest. Entries will be judged on how well they make the subject matter interesting, understandable, and engaging. Web map and mobile app entries can be submitted April 29 – June 10, 2011. Prizes will be awarded for first, second, and third place in each category. Winners will be announced in July at the 2011 Esri International User Conference (Esri UC) in San Diego, California.

For guidelines and to submit web map or mobile apps, click here.