Categories
Bucknell/Local Interest Environment Events/Calendar General GIS GIS Jobs, Internships, Scholarships & Grad Programs Slideshow

Happy GIS Day, Bucknell!

If the map-lovers and geo-geeks in your life have an extra spring in their step this morning, it’s because GIS day is finally here!!!! No, you probably can’t get out of class or work on this holiday but there’s still a lot to get excited about, including:

1. Jobs – developing GIS and spatial literacy skills can help you get a job.

The geospatial industry and market for it continue to expand at a phenomenal rate. The latest Dept. of Labor statistics show more than 850,000 current geospatial workers with an additional 350,000 needed by 2018 (from GeoTechCenter.org)

Because the uses for geospatial technology are so widespread and diverse, the market is growing at an annual rate of almost 35 percent, with the commercial subsection of the market expanding at the rate of 100 percent each year. (from U.S. Department of Labor’s Employment & Training Administration website)

2. Cake – GIS day means…. cake! Last year was an orthophoto cake. This year the cake has gone inter-galactic. Want to eat a slice of the globe cake? It’ll be served up at noon near the central staircase in the library.

3. Geo-geek humor – That’s right, GIS Day is also a celebration of the collective, colossal geekiness of the people all over the world who do GIS. Last year’s GIS Day brought us a GIS-inspired cover version of Jay-Z and Alicia Keys’ ‘Empire State of Mind.’

httpv://www.youtube.com/watch?v=4mCDUf08YLg

This year is a cartoon on what your favorite map projection says about you.


Categories
Bucknell/Local Interest General GIS Slideshow

Trick or Track & the Zombie Apocalypse

Last Halloween  I shared an ESRI map that visualized Halloween spending across the U.S.  Interesting, but nothing of any real practical value. But this year I’ve got links to a couple of maps and apps that could really come in handy on Monday night:

1. First up, a link to an article in the Montreal Gazette with info about four different GPS-enabled mobile apps to help you keep track of your kids while they’re out trick-or-treating. Two of my favorites are highlighted below in an excerpt from the article:

Although it might seem spooky for kids, a handful of applications will allow parents to receive timely data on where their children are, and possibly deter the youngsters from wandering too far away.

GOOGLE LATITUDE: Offered as both a separate app and as an opt-in feature that’s part of the free Google Maps app, Latitude enables users to share their location with friends or family members. After downloading the Maps app, you can choose to “Join Latitude” and invite your children, who must also enable that feature on their own phone, to share their location with you. Once someone accepts, they appear as an icon on Google Maps. But inviting someone means they will be able to view your location. Anyone who has received what is called a “sharing request” can also accept it but choose to hide their own location. That means if you’re not careful, your children will end up tracking you instead of the other way around (possibly leading to lots of awkward inquisitions).

TRICK OR TRACKER: A Halloween-themed app, the Trick or Tracker will send text messages with location data to a preset phone number. To use, a parent must download the app onto both their own phone and their child’s phone, choose one password to sync up the two devices and pick a time interval to get regular text updates (say, every 15 minutes). The app also lets parents create a digital fence to encourage their children to stay within a certain area. If he or she strays outside that “geofence,” the parent’s phone will be notified by text message. There’s also the option to give children a peep at your own location, via the “where’s my parent?” button.

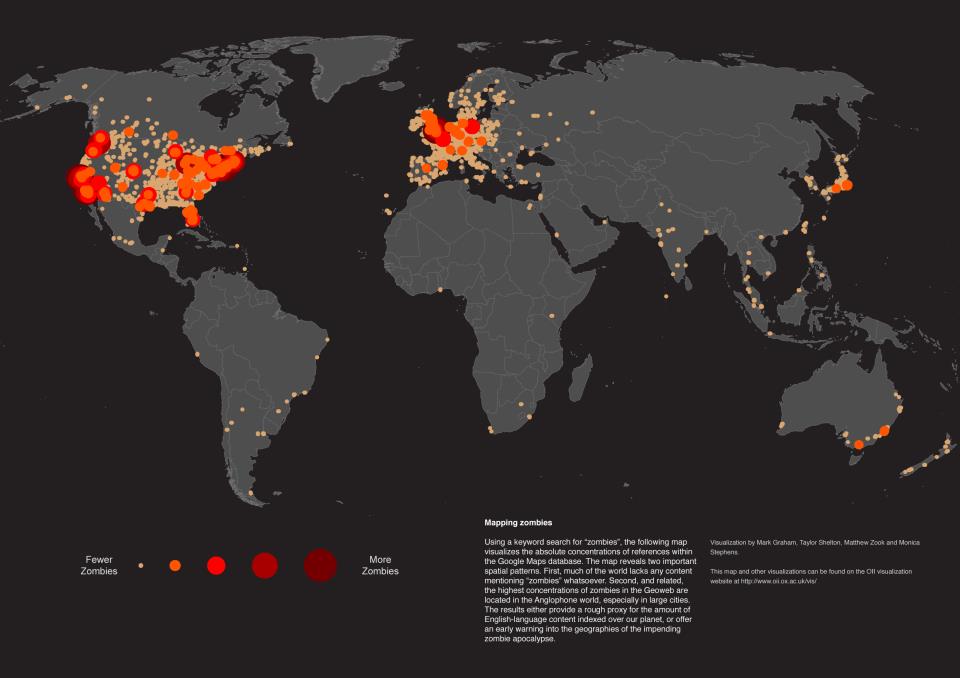
2. Next up, the ever important Zombie hot spot map, courtesy of the Oxford Internet Institute.

Using a keyword search for “zombies”, the following map visualizes the absolute concentrations of references within the Google Maps database.

Data – In order to measure the amount of content about zombies indexed by Google, a dataset was created based on a 0.25 x 0.25 degree grid of all the land mass in the world (roughly 250,000 points). A buffer was then constructed for each point using a sliding variable size based on the great circle distance to neighbouring points in the grid pattern. It was important to adjust this value in order to compensate for decreasing distance between longitudes as the software moves from the equator to the poles. For each point and buffer combination a search was run in Google Maps to measure the total number of hits for user-generated content at each location (as defined by Google)

Findings – the  map reveals two important spatial patterns. First, much of the world lacks any content mentioning “zombies” whatsoever. Second, and related, the highest concentrations of zombies in the Geoweb are located in the Anglophone world, especially in large. The results either provide a rough proxy for the amount of English-language content indexed over our planet, or offer an early warning into the geographies of the impending zombie apocalypse.

Now if they’d just stream the Zombie location info into the Trick or Tracker app you’d have everything you’d need to either stay safe or scare up some trouble this Halloween.


Categories
Bucknell/Local Interest Digital Humanities Environment General GIS GIS in Computer Science GIS in Environmental Studies GIS in Geography GIS in Geology GIS in Public Health GIS in Sociology Slideshow

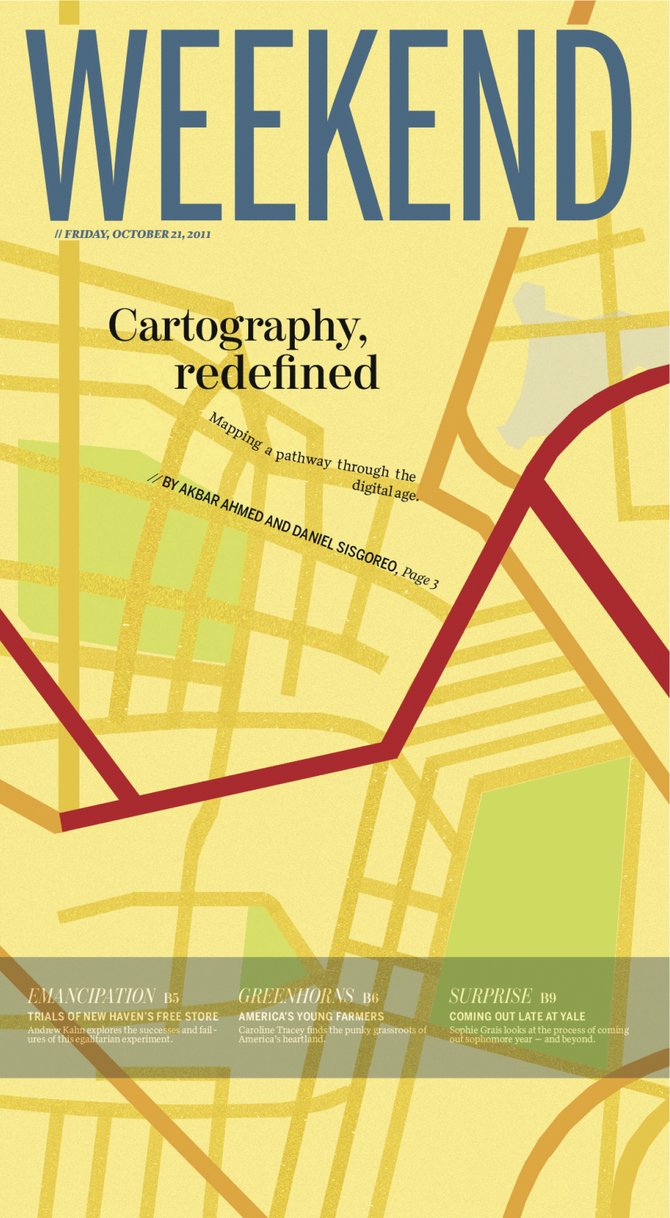
From the Yale Daily News… “Map on, Maples!”

The Yale Daily News has a great article about the role that the GIS Specialist, Stace Maples, plays on campus. Maples, a fellow ESRI T3G Institute alum from summer 2010, works with faculty and students on integrating GIS into teaching and research at Yale and…

… he is in high demand. Working in the three-person Map Department, a department within the Yale University Library, he trains students and faculty in the use of the arcane computer program. He helps professors in areas from history to public health, in such projects as diverse as mapping correspondence networks and placing photographic collections in a geological context. He is adamant that geographical data is relevant to all academic endeavors.

“Everything is somewhere, and that somewhere matters,” Maples declared.

Although I take issue with the reporter’s use of the word ‘arcane’ to describe GIS software, I’ll second Stace’s assessment that location matters (or, as the Geospatial Revolution team at Penn State put it, “the location of anything is becoming everything“).  In a statement that is sure to resonate with faculty, Peter Bol, the director of the Center for Geographic Analysis at Harvard University, is quoted in the article as saying that:

 “If you want to publish competitive research today, you have to have GIS.”

That might be a bit of an overstatement (for the moment, at least), but there’s no doubt that incorporating GIS and spatial analysis is increasingly becoming an expectation in academic research, much in the same way as it has become part of the fabric of our everyday lives.  Dana Tomlin – who is… a visiting faculty member in the Yale School of Forestry, co-director of the Cartographic Modeling Laboratory at the University of Pennsylvania, a GIS Hall of Fame-r, the creator of map algebra, and, incidentally, the grad school professor who got me hooked on GIS (thanks, Dana!), sums it up this way:

“With the advent of web mapping services like Google Earth and Bing, the ability to sense geographical position in real time via the Global Positioning System (GPS), and the opportunity to place this sort of magic quite literally into the hands of anyone with a smart phone, there is no question that the world at large is already well beyond the point of no return in terms of making routine use of geographical data in digital form.”

GIS has existed as a computing technology since the 1960’s, but until the mid to late 1990’s it was largely the domain of highly-trained specialists working from high-powered servers. GIS software and web-based map apps have become increasingly faster, more powerful and more user-friendly over the last 20 years. If those trends continue, and if we do our jobs well, Stace and I might very well work ourselves out of a job:

It is conceivable that GIS might one day become as ubiquitous within academia as Google Maps is within the broader population. If departments integrate GIS into their own teaching, the role that Maples and other specialists play is likely to diminish. Graduate students in fields employing GIS are expected to understand the program and its functionalities… Meanwhile, academics who only rarely use GIS might consult specialists if and when necessary, while remaining blissfully oblivious of the program’s nitty-gritty.

Today’s graduate students are tomorrow’s professors. And, if the trends hold true, at least a significant proportion of them will soon be using GIS technology to gain deeper insight into diverse fields of study for decades to come. So map on, Maples.

Click here to read the full story and learn more about how Yale faculty and students are using GIS to study history, archaeology, linguistics, environmental studies, forestry, public health and other topics.


Categories
Bucknell/Local Interest General GIS GIS in Film Studies Slideshow Videos

Mapping wheel-chair access at Bucknell

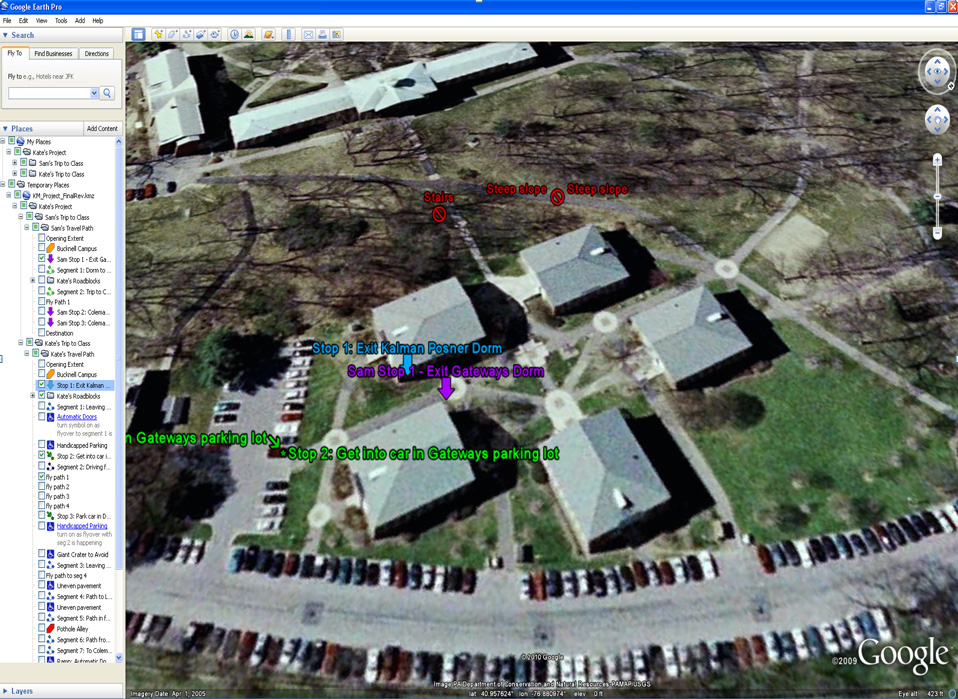
In spring 2010, Bucknell student Kate Matelan, ’10  worked with film professor Eric Faden to produce a documentary film focused on her experiences as a disabled student on campus.  To illustrate the differences between navigating the Bucknell campus in a wheelchair vs. on foot, Kate and I developed a GoogleEarth project with placemarks and travel paths to mark and annotate both her route and an able-bodied student’s route to a class held in Coleman 221.

In the film a 4-panel split screen (aka ’24’ style) approach was used to simultaneously present a GoogleEarth fly-over of each student’s travel path synced to video footage of the students describing the course of their daily trip to Coleman 221. See video excerpt and screenshot from GoogleEarth project below. I’ll make the KML file available as soon as I can figure how to to do that on WordPress.


Video Platform Video Management Video Solutions Video Player

Note: video footage was shot using several cameras including the GoPro Hero and Kodak Zi8. Editing was done in Final Cut Pro.

Categories
Environment Events/Calendar General GIS

Reminder – Flying Bison & free pizza today at noon

Reminder – the Flying Bison coffee talk will be in Olin 268 at noon today.  Here’s the message center listing for the event:

Dan Farrell ’12 and Nick Urban ’12 will be giving the coffee talk on Monday, September 26 at Noon in the Olin auditorium (Olin 268). The title of their talk is “The Flying Bison: A Student UAV Project.”

ABSTRACT: UAVs (Unmanned Aerial Vehicles) are becoming increasingly prominent in various fields of study and work. To better understand and explore these applications, we constructed a UAV to compete in the 9th Annual AUVSI Student Unmanned Air Systems Competition. Following the competition, we adapted our system to fill an experimental role in aerial photography, land surveying, and environmental restoration. We will discuss the design of our automated system and present video footage that displays the performance and potential for future operations of our UAV.

Pizza and drinks will be provided.