Categories
Bucknell/Local Interest Data Environment GIS in Engineering GIS in Environmental Studies GIS in Geography GIS in Geology Miller Run Restoration Project Slideshow Videos

Flying Bison

Nick Urban ’12, a GIS student assistant and Computer Science major, recently competed in  the 9th annual student Unmanned Air Systems (UAS) competition held at Webster Field in St. Inigoes, MD.  Hosted by the Association for Unmanned Vehicle Systems International (AUVSI), the competition challenged students to “design, fabricate, and demonstrate a system capable of completing a specific and independent aerial operation.” In other words, the teams had to design, build and fly an aerial drone and compete against each other to incorporate specialized features like automated take-off and landing, auto-pilot flight, in-flight transmission of still and/or video imagery, etc. into their drone flights.  Although Bucknell had the smallest team by far (Nick Urban ’12, Computer Science and Dan Farrell ’12, Physics) and one of the smallest teams in the history of the competition – just two students as compared to upwards of 15 or 20 from other schools – the Flying Bison finished 15th out of 26 teams and earned a $1,000 award.

Earlier this spring, we joked about doing a fly-over (or blimp-over) of campus to collect high resolution imagery, but here we are a few months later doing exactly that thanks to Nick’s project.  During July and August,  Nick will be using the Flying Bison to collect aerial imagery and in-flight video footage of campus and surrounding areas. The data will be used for exploring the possible applications of a UAV (Unmanned Aerial Vehicle) as a tool for monitoring environmental change.  The data will also be used in developing a restoration plan for the Miller Run creek that runs through campus.

Click here for more information on the UAS competition and Bucknell’s Flying Bison drone.
Categories
Data General GIS GIS in Art GIS in Computer Science Slideshow Videos

Phone-call cartography

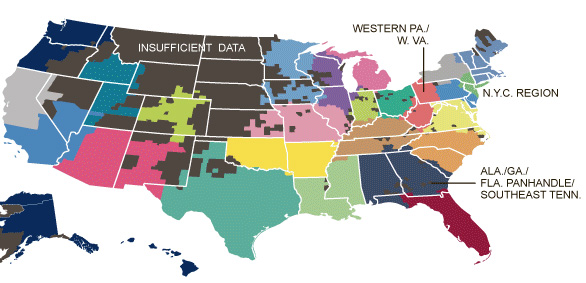
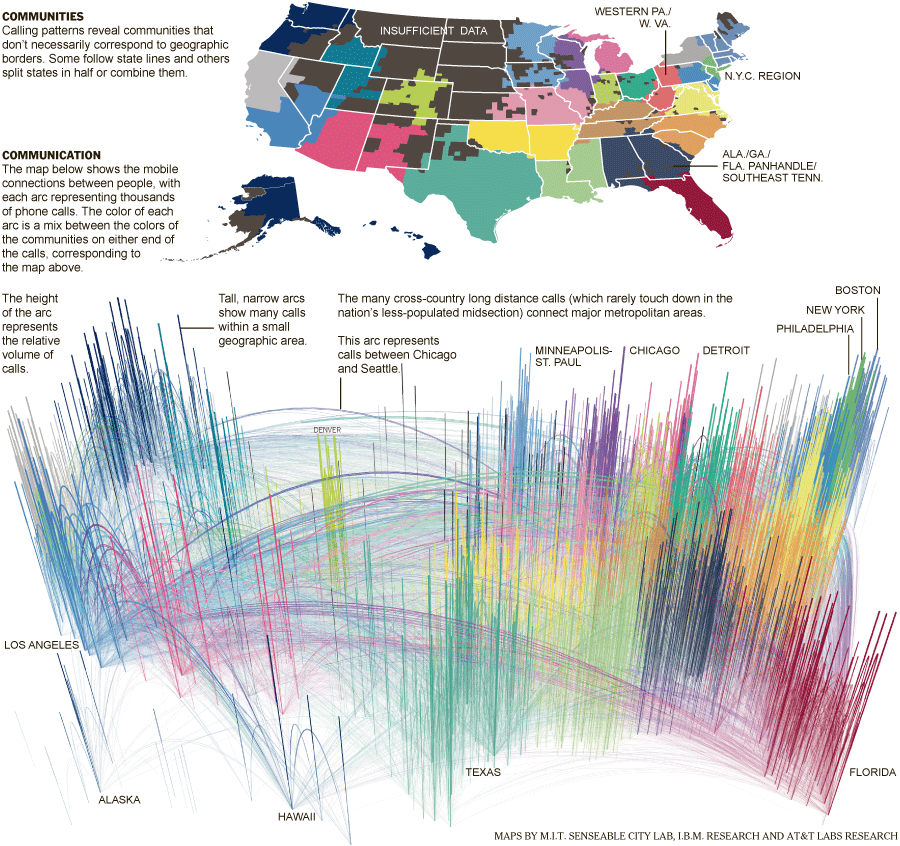
Here’s a link to an interesting NYT story, “Phone-call cartography,”  on mapping connectedness via data points from mobile phone calls.  The accompanying map was produced by M.I.T.’s SENSEable City Lab using the origin and end point locations for cellphone traffic within the U.S. in July of last year.

Phone-call cartography video:

httpv://www.youtube.com/watch?v=eFKZnbIAboI

Phone-call cartography map:


The “Phone-call cartography” map project is just the latest in a long series of projects the SENSEable City Lab has done using cellphone data to explore the idea of connectedness.  In 2008, the group produced a map installation called “New York Time Exchange” for the NYC MoMA’s ‘Design and the Elastic Mind’ exhibition. The installation featured wall-sized maps displaying nearly real-time data on cellphone calls with origins and/or destinations in the New York City area. See this Newsweek article or this NYT article for more information about the “New York Time Exchange” exhibit and how SENSEable’s research is informing our understanding of globalization, the digital divide and other measures of connectedness.

Click here to read an article about SENSEable’s use of real-time cell phone data to analyze the economic impact of New York City’s 2008 ‘Waterfalls’ exhibit in New York Harbor.

Categories
Bucknell/Local Interest Digital Humanities General GIS GIS in Environmental Studies GIS in Geography GIS in History GIS in Humanities Map Apps Marcellus Shale Slideshow Videos

Uncovering the ‘Stories of the Susquehanna’ using GIS

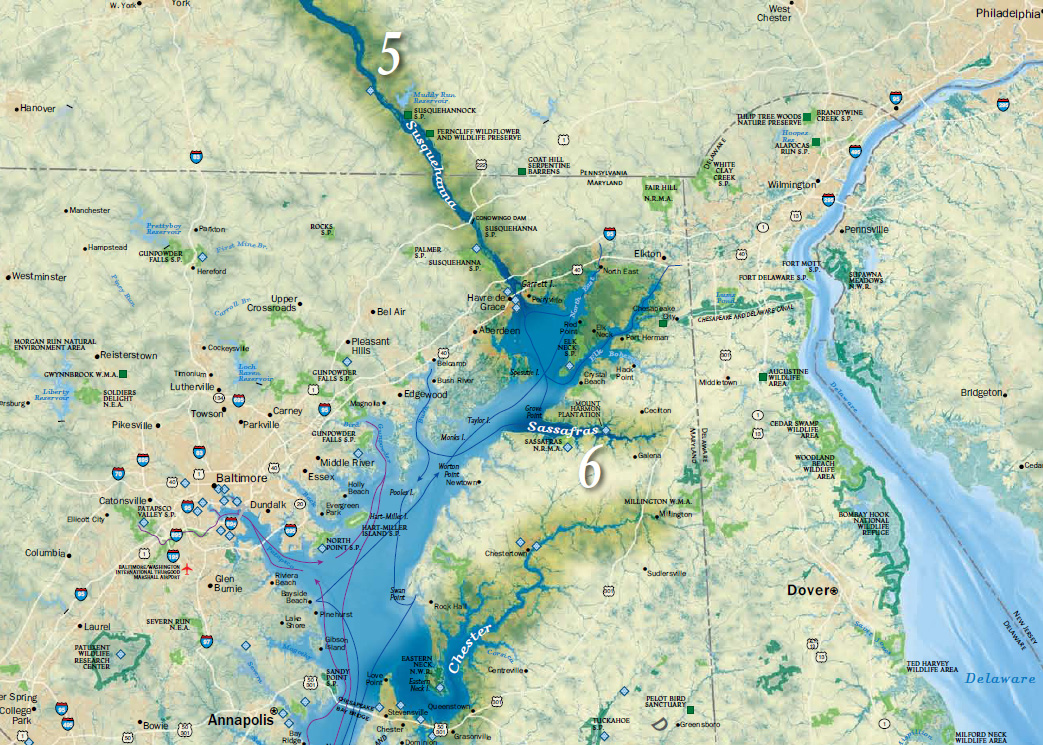
Bucknell faculty have long had an interest in grounding their research efforts locally – using the physical, cultural, historical and sociological landscapes of the Susquehanna Valley region as a living laboratory. The two videos below feature Prof. Katherine Faull and student Emily Bitely ’11 talking about the role of GIS in two such projects – the Stories of the Susquehanna, and the John Smith Trail Extension project (both multi-year, inter-disciplinary projects involving faculty from across the campus).

Katie Faull discussing her use of GIS for the John Smith Trail Extension and Stories of the Susquehanna project:
httpv://www.youtube.com/watch?v=j2eG2v8FnOA

Emily Bitely ’11 discussing her use of GIS for the same projects:
httpv://www.youtube.com/watch?v=1uPcaaqSzII

More about the John Smith Trail:

  • To learn more about the John Smith Trail, click here or here.
  • To view a National Geographic map detailing Captain John Smith’s voyage, click here.
  • To view a map of interpretive ‘smart’ buoys located in the river, click here.

More about the Stories of the Susquehanna project:

  • A pilot web mapping application featuring two of the ‘Stories of the Susquehanna’ is scheduled to launch this fall.  Stay tuned for more details.
  • Click here to read about the 2010 Susquehanna Valley Summer Writer’s Institute (SVSWI).  The SVSWI project is related to the Stories of the Susquehanna both in the type of local stories it explores and in its use of maps, audio, video, images and text to reflect on those stories in an interactive digital story-telling environment.
  • Click here to view the SVSWI’s interactive mapping application featuring students’ reflections on the impact of the Marcellus Shale gas boom on different populations in the Susquehanna Valley region.
Categories
Bucknell/Local Interest General GIS Slideshow Videos

Penn State releases final episode of “Geospatial Revolution” series

The final installment of Penn State’s “Geospatial Revolution” project was released today.  Click here to learn more about the project and see full-length videos for Episodes 1-3. See below for the full-length video of Episode 4.

Episode 4:

httpv://www.youtube.com/watch?v=9F7z9LLYxf8


Categories
General GIS GIS in Computer Science Map Apps Slideshow Videos

Your iPhone is Tracking You

O’Reilly Media published a story yesterday (on the penultimate day of its Where2.0 conference no less…)  describing Alasdair Allan and Pete Warden’s discovery of a hidden file on your iPhone and 3G iPad that keeps a running record of your device’s whereabouts. The file, part of the iOS4 release, records both latitude/longitude and timestamps – making it possible to create a detailed map of any and all movements you’ve made while having the iPhone or 3G iPad on your person.

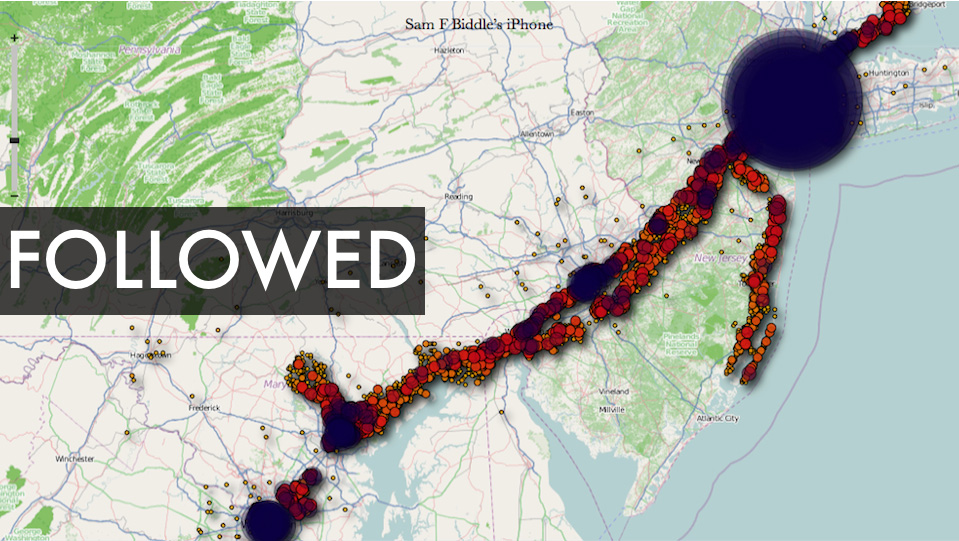
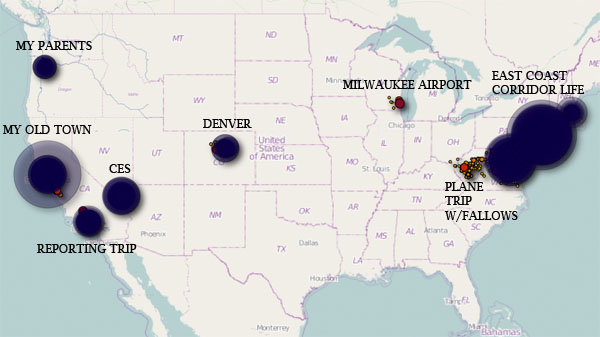
There is a debate underway about both the significance of this finding as well as how new a ”discovery’ it is  (see links below). But I’m kinda on the same page as Alexis Madrigal from the Atlantic – as much as I’m a little disturbed by the idea of a secret log of my whereabouts, I’m also fascinated by the idea of playing around with the data my iPhone has recorded and I’m curious to see what kinds of visualizations could be created out of it. If you’re curious about this too, you can visit Pete Warden’s website to download a free, open source app that will map the data from your iPhone or iPad tracking file.  See below for some sample ‘heat maps’ that were created using the tracking data from various user’s iPhones. Click here to see a video from Pete Warden’s website showing animation of tracking data from Warden’s iphone mapped by location and timestamp.

Story from O’Reilly Media:
Got an iPhone or 3G iPad? Apple is recording your moves

Story from Alex Levinson’s Blog:
Three Major Issues with the Latest iPhone ‘Discovery’

Story from The Atlantic:
My Life According To The iPhone’s Secret Tracking Log

Story from Gizmodo:
iSpy Conspiracy: Your iPhone is Secretly Tracking Everywhere You’ve Been, All the Time

Story from zdnet.com
Your iPhone is Tracking You (And Has Been for Awhile)

Two O’Reilly media researchers, Alasdair Allan and Pete Warden, caused quite a stir yesterday when they published an article about a hidden file in iOS 4 that regularly records the position of your device. All iPhones running iOS 4.0 or later log your location to a file called “consolidated.db” (a plain SQL file) which contains latitude-longitude coordinates and a timestamp.

Story from The Guardian:
iPhone Tracking Prompts Privacy Fears

Security researchers have discovered that Apple‘s iPhone keeps track of where you go – and saves every detail of it to a secret file on the device which is then copied to the owner’s computer when the two are synchronised. The file contains the latitude and longitude of the phone’s recorded coordinates along with a timestamp, meaning that anyone who stole the phone or the computer could discover details about the owner’s movements using a simple program.For some phones, there could be almost a year’s worth of data stored, as the recording of data seems to have started with Apple’s iOS 4 update to the phone’s operating system, released in June 2010.

YouTube Video of Pete Warden and Alastair Allan discussing the iPhone tracker at Where2.0:

httpv://www.youtube.com/watch?v=GynEFV4hsA0&p=0B2FEB8AACD826BE

Sample ‘heat map’ of Alexis Madrigal’s movements (created from data in the iPhone tracker file):


Sample ‘heat map’ from Sam Biddle’s iPhone: