Categories
Bucknell/Local Interest Data Environment General GIS GIS in Engineering GIS in Environmental Studies GIS in Geography GIS in Geology Miller Run Restoration Project Slideshow

Miller Run Restoration

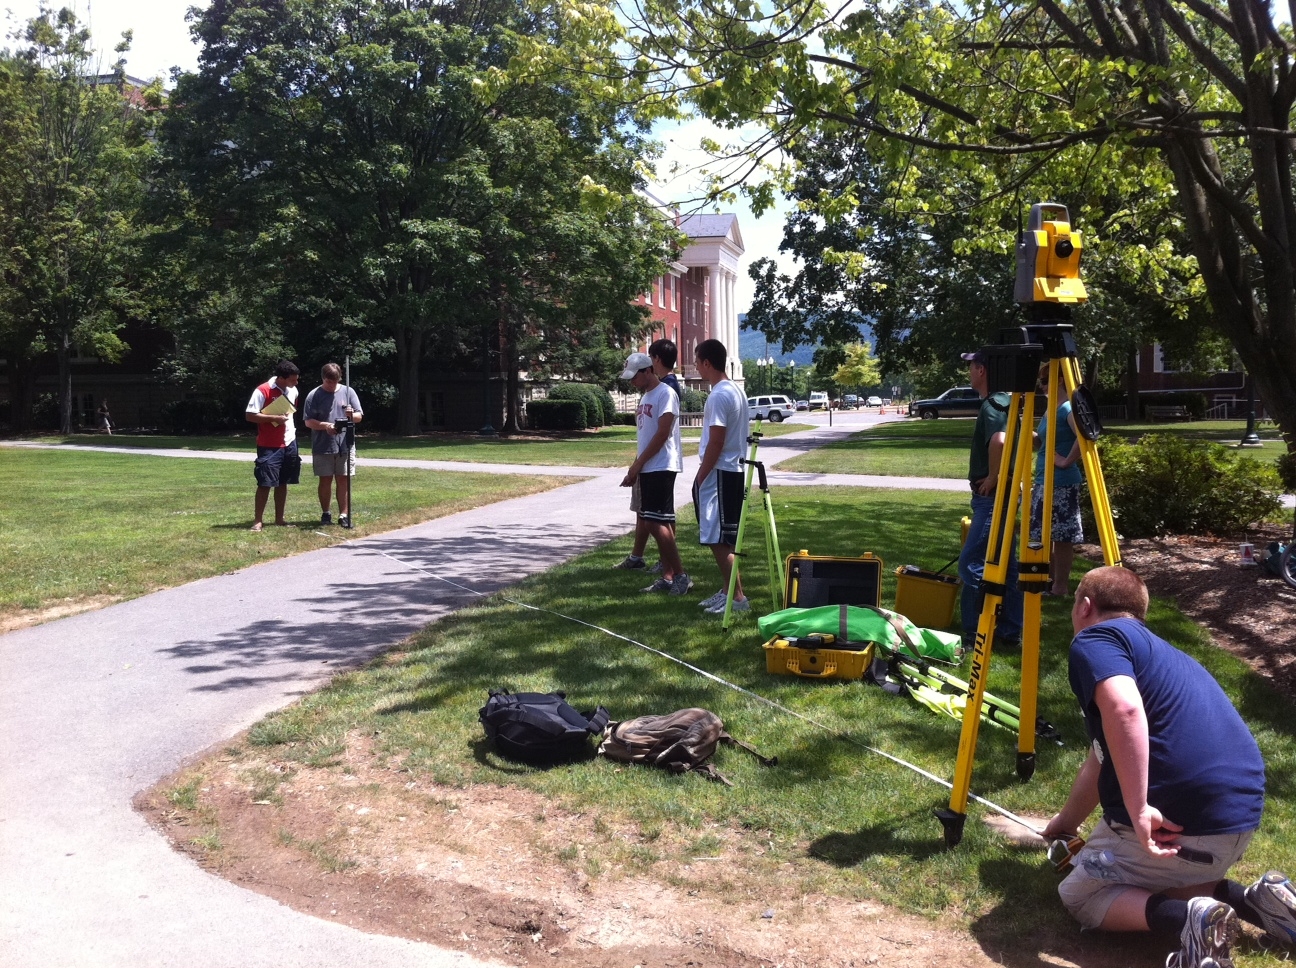
In January of 2011, Bucknell received a 178K grant through PA DEP’s Growing Greener program to support the first phase of a project that will restore the Miller Run Creek (that runs through campus and the golf course) and provide flood relief to the surrounding areas.  Bucknell’s GIS Student Assistants are supporting the Miller Run Restoration project by collecting high resolution aerial imagery (using a drone) and elevation data (using an RTK survey system and high accuracy GPS).  We’ll post more about the project in the next few weeks, but for now here are a few pictures of Team Survey.

Nick Urban, Computer Science ’12 – designing, building and flying an aerial drone to capture high resolution imagery of the campus area

Max Stiss, Geography/Anthropology ’12 – collecting GPS data near Abbey Lane for the Miller Run Restoration Project

From L to R, clockwise: Mike Grasso, Environmental Studies ’13; Dan Dougherty, Geography/History ’12; Prof. Rob Jacob, Geology; Dan Dougherty, Geography/History ’12; Max Stiss,
Geography/Anthropology ’12 uploading GPS data after a day in the field
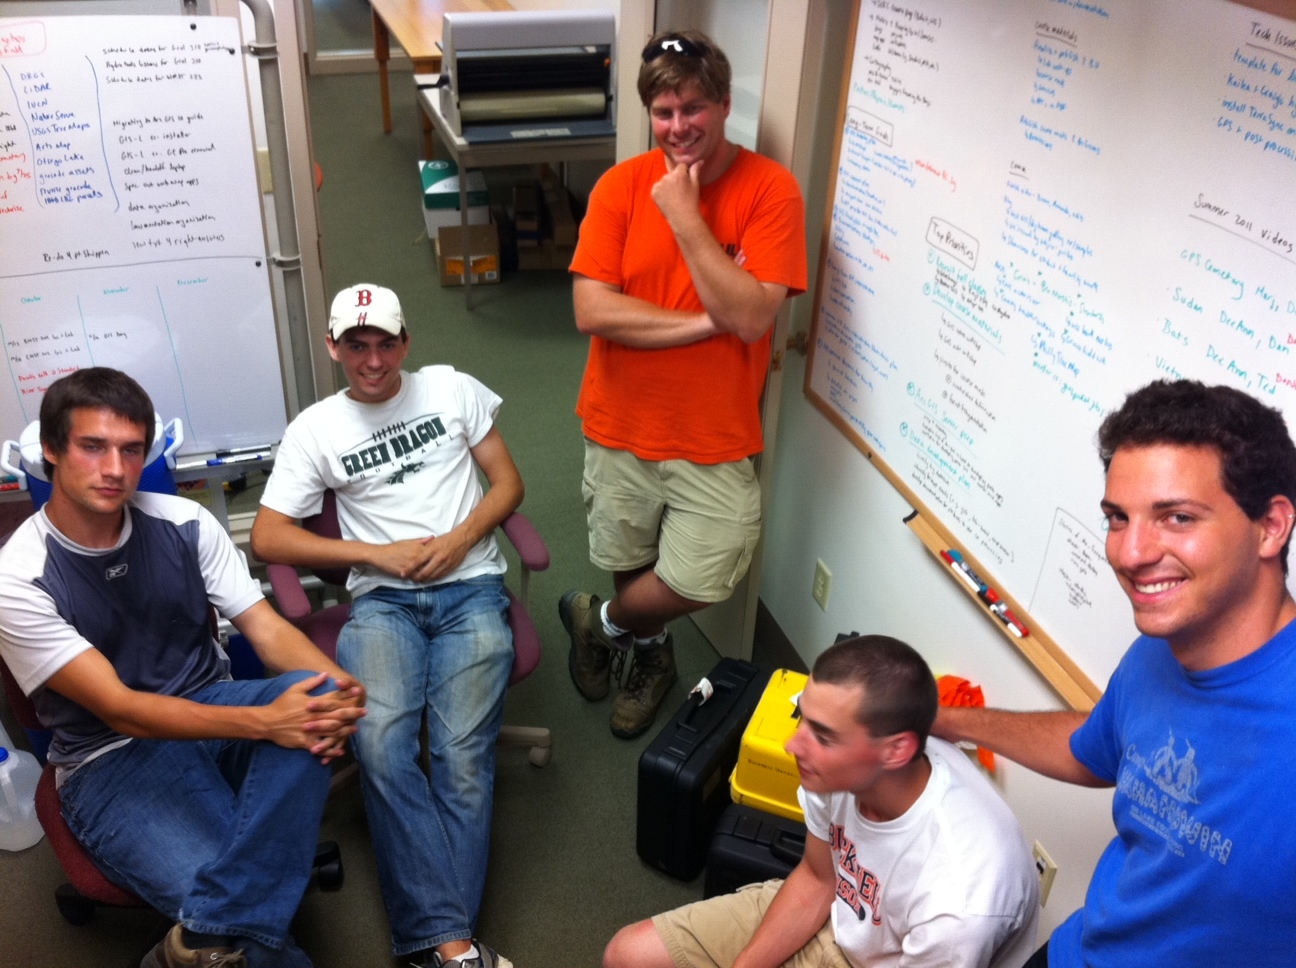
Training on the RTK System before heading out in the field:

Categories
Bucknell/Local Interest Data Environment GIS in Engineering GIS in Environmental Studies GIS in Geography GIS in Geology Miller Run Restoration Project Slideshow Videos

Flying Bison

Nick Urban ’12, a GIS student assistant and Computer Science major, recently competed in  the 9th annual student Unmanned Air Systems (UAS) competition held at Webster Field in St. Inigoes, MD.  Hosted by the Association for Unmanned Vehicle Systems International (AUVSI), the competition challenged students to “design, fabricate, and demonstrate a system capable of completing a specific and independent aerial operation.” In other words, the teams had to design, build and fly an aerial drone and compete against each other to incorporate specialized features like automated take-off and landing, auto-pilot flight, in-flight transmission of still and/or video imagery, etc. into their drone flights.  Although Bucknell had the smallest team by far (Nick Urban ’12, Computer Science and Dan Farrell ’12, Physics) and one of the smallest teams in the history of the competition – just two students as compared to upwards of 15 or 20 from other schools – the Flying Bison finished 15th out of 26 teams and earned a $1,000 award.

Earlier this spring, we joked about doing a fly-over (or blimp-over) of campus to collect high resolution imagery, but here we are a few months later doing exactly that thanks to Nick’s project.  During July and August,  Nick will be using the Flying Bison to collect aerial imagery and in-flight video footage of campus and surrounding areas. The data will be used for exploring the possible applications of a UAV (Unmanned Aerial Vehicle) as a tool for monitoring environmental change.  The data will also be used in developing a restoration plan for the Miller Run creek that runs through campus.

Click here for more information on the UAS competition and Bucknell’s Flying Bison drone.

Categories
Bucknell/Local Interest Data Digital Humanities Environment General GIS GIS in Biology GIS in Computer Science GIS in Engineering GIS in Environmental Studies GIS in Geography GIS in Geology GIS in History GIS in Humanities GIS in Psychology GIS in Sociology Map Apps Marcellus Shale Miller Run Restoration Project Slideshow

What we’re up to this summer (and why we’re not posting)

Thanks to the Mellon grant and a huge number of faculty teaching and research projects it’s been a very busy summer of GIS work at Bucknell.  Over the coming weeks I’ll write detailed posts about the work we’re doing on each of the projects.  If I’m really ambitious I might try to post some interviews with faculty and students – and some footage of the aerial drone flights that Nick Urban ’12 is doing. But for now here’s a short overview of who’s doing GIS work at Bucknell this summer and what we’re doing:

GIS Student Assistants:

  • Chad Lawlis, Environmental Studies ’11
  • Dan Dougherty, Geography/History ’12
  • Max Stiss, Geography/Anthropology ’12
  • Nick Urban, Computer Science ’12
  • Mike Grasso, Environmental Studies ’13
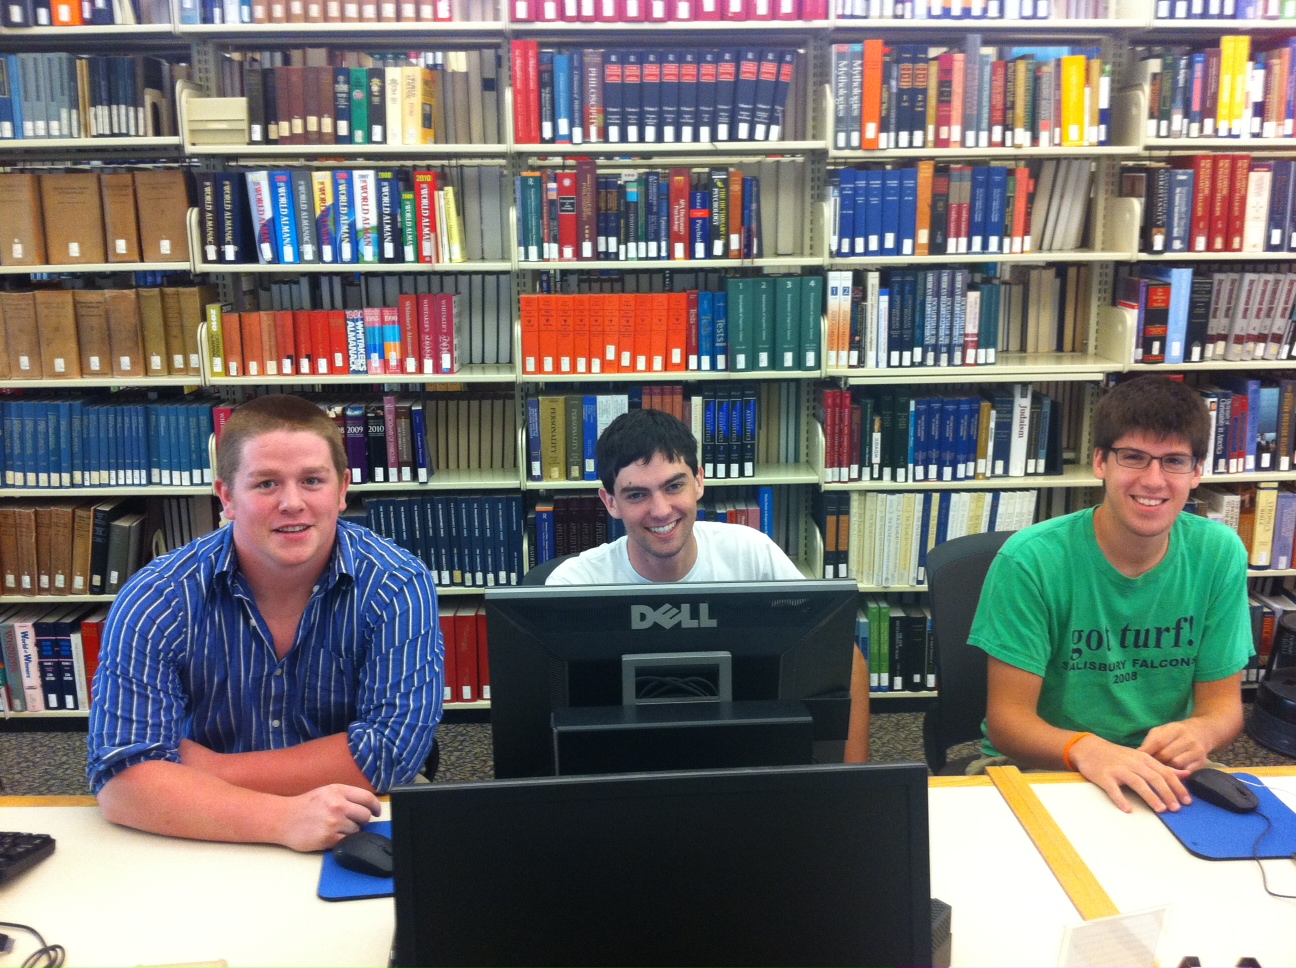
  • Robby Holler, Geography/International Relations ’13 (pictured below)
  • Darin Rockwell, Geography/Geology ’13 (pictured below)
  • Dan Ladd, Middlebury College ’14 (pictured below)

Key Projects:

  • Maps for Sudan field guide atlas to mammals
  • GPS data collection for Lewisburg Cemetary
  • GPS data collection for Miller Run restoration project
  • Aerial drone data collection for Miller Run restoration project
  • Lycoming County/Williamsport community asset mapping
  • Mapping toxic contamination from Marcellus Shale natural gas wells
  • Mapping locations of Marcellus Shale water withdrawl permits
  • Georeferencing & vectorizing 19th century economic maps of Vietnam
  • Georeferencing & vectorizing maps of environmental hazards and resources in Kyrgyzstan
  • Georeferencing & vectorizing 1868 Historic Atlas of Union & Snyder Counties
  • Data development for Stories of the Susquehanna project
  • Support for student research projects – including GPS’ing dumpster locations on campus for an analysis of campus waste and recycling, and updating Arboretum tree dataset with location info for newly planted and felled trees
  • Develop pilot web map apps for showcasing faculty research
  • Develop pilot web map apps for use in teaching
  • Implement backend IT infrastructure to support ArcGIS server
  • Maps for Bucknell admin purposes, including: analysis of parking shortages on campus; maps for task force report on campus climate; maps for SBDC report on services by county; arts festival map.


Categories
Bucknell/Local Interest Digital Humanities General GIS GIS in Environmental Studies GIS in Geography GIS in History GIS in Humanities Map Apps Marcellus Shale Slideshow Videos

Uncovering the ‘Stories of the Susquehanna’ using GIS

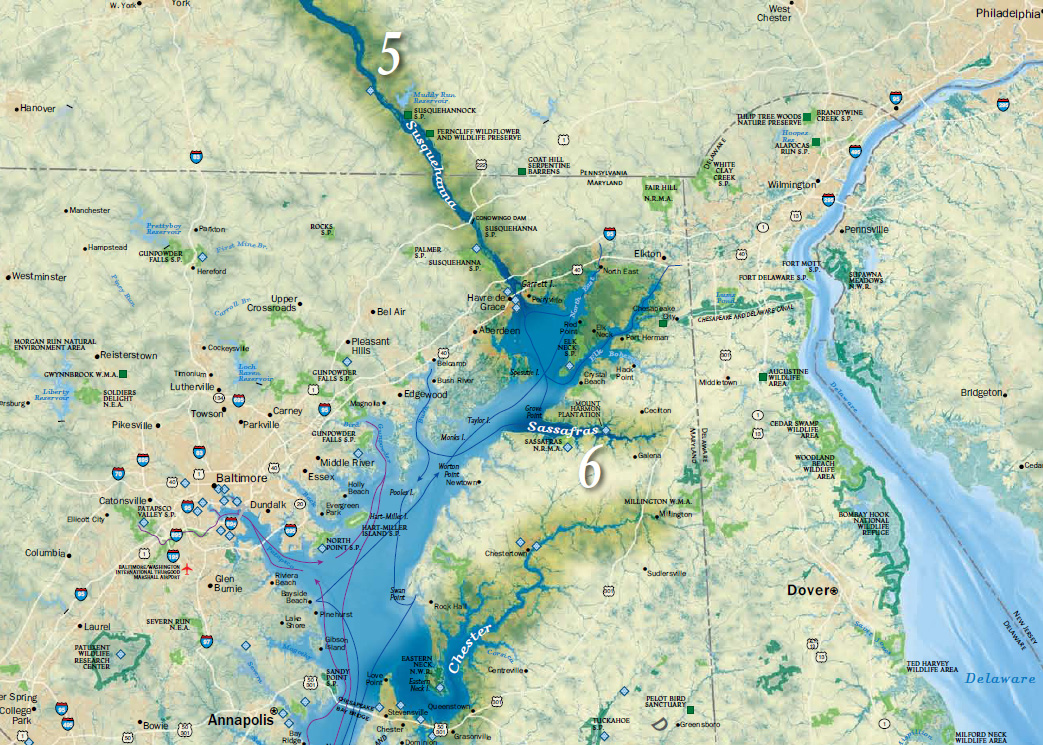
Bucknell faculty have long had an interest in grounding their research efforts locally – using the physical, cultural, historical and sociological landscapes of the Susquehanna Valley region as a living laboratory. The two videos below feature Prof. Katherine Faull and student Emily Bitely ’11 talking about the role of GIS in two such projects – the Stories of the Susquehanna, and the John Smith Trail Extension project (both multi-year, inter-disciplinary projects involving faculty from across the campus).

Katie Faull discussing her use of GIS for the John Smith Trail Extension and Stories of the Susquehanna project:
httpv://www.youtube.com/watch?v=j2eG2v8FnOA

Emily Bitely ’11 discussing her use of GIS for the same projects:
httpv://www.youtube.com/watch?v=1uPcaaqSzII

More about the John Smith Trail:

  • To learn more about the John Smith Trail, click here or here.
  • To view a National Geographic map detailing Captain John Smith’s voyage, click here.
  • To view a map of interpretive ‘smart’ buoys located in the river, click here.

More about the Stories of the Susquehanna project:

  • A pilot web mapping application featuring two of the ‘Stories of the Susquehanna’ is scheduled to launch this fall.  Stay tuned for more details.
  • Click here to read about the 2010 Susquehanna Valley Summer Writer’s Institute (SVSWI).  The SVSWI project is related to the Stories of the Susquehanna both in the type of local stories it explores and in its use of maps, audio, video, images and text to reflect on those stories in an interactive digital story-telling environment.
  • Click here to view the SVSWI’s interactive mapping application featuring students’ reflections on the impact of the Marcellus Shale gas boom on different populations in the Susquehanna Valley region.
Categories
General GIS GIS in Geography GIS in Sociology Map Apps Slideshow

The 12 States of America

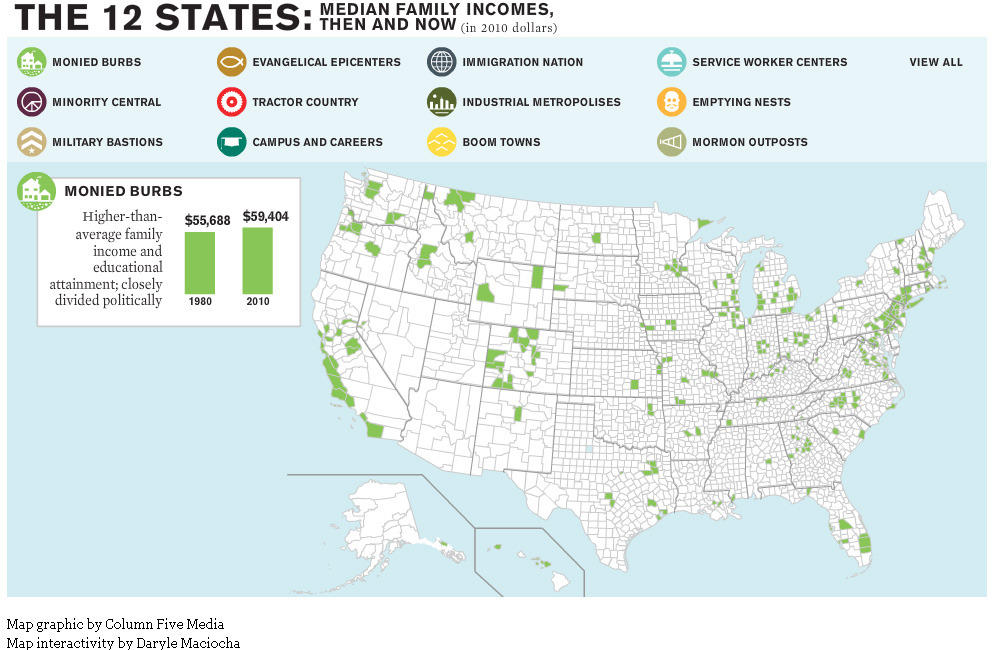
The website for The Atlantic magazine has an interesting new map graphic visualizing the ways in which income inequality has fractured the nation over the past 30 years.  The graphic breaks the nation into 12 different ‘states’ – monied burbs, minority central, military bastions, evangelical epicenters, tractor country, campuses and careers, immigration nation, industrial metropolises, boom towns, service worker centers, emptying nests and mormon outposts – based on a variety of different demographic characteristics.

For example, the Boom Town state is defined as relatively wealthy U.S. counties that saw rapid growth and increasing minority populations prior to the last recession. Whereas Monied Burbs have higher than average family income and educational attainment and are closely divided politically.

See map samples for the Boom Town and Monied Burb states below. Click here to see the interactive map graphic on The Atlantic’s website. Thanks to Ben Marsh for the heads up about this graphic!