Categories
Bucknell/Local Interest Environment Events/Calendar General GIS GIS in Biology Slideshow

Do turtles with more powerful predators have stronger shells?

Do turtles with more powerful predators have stronger shells?

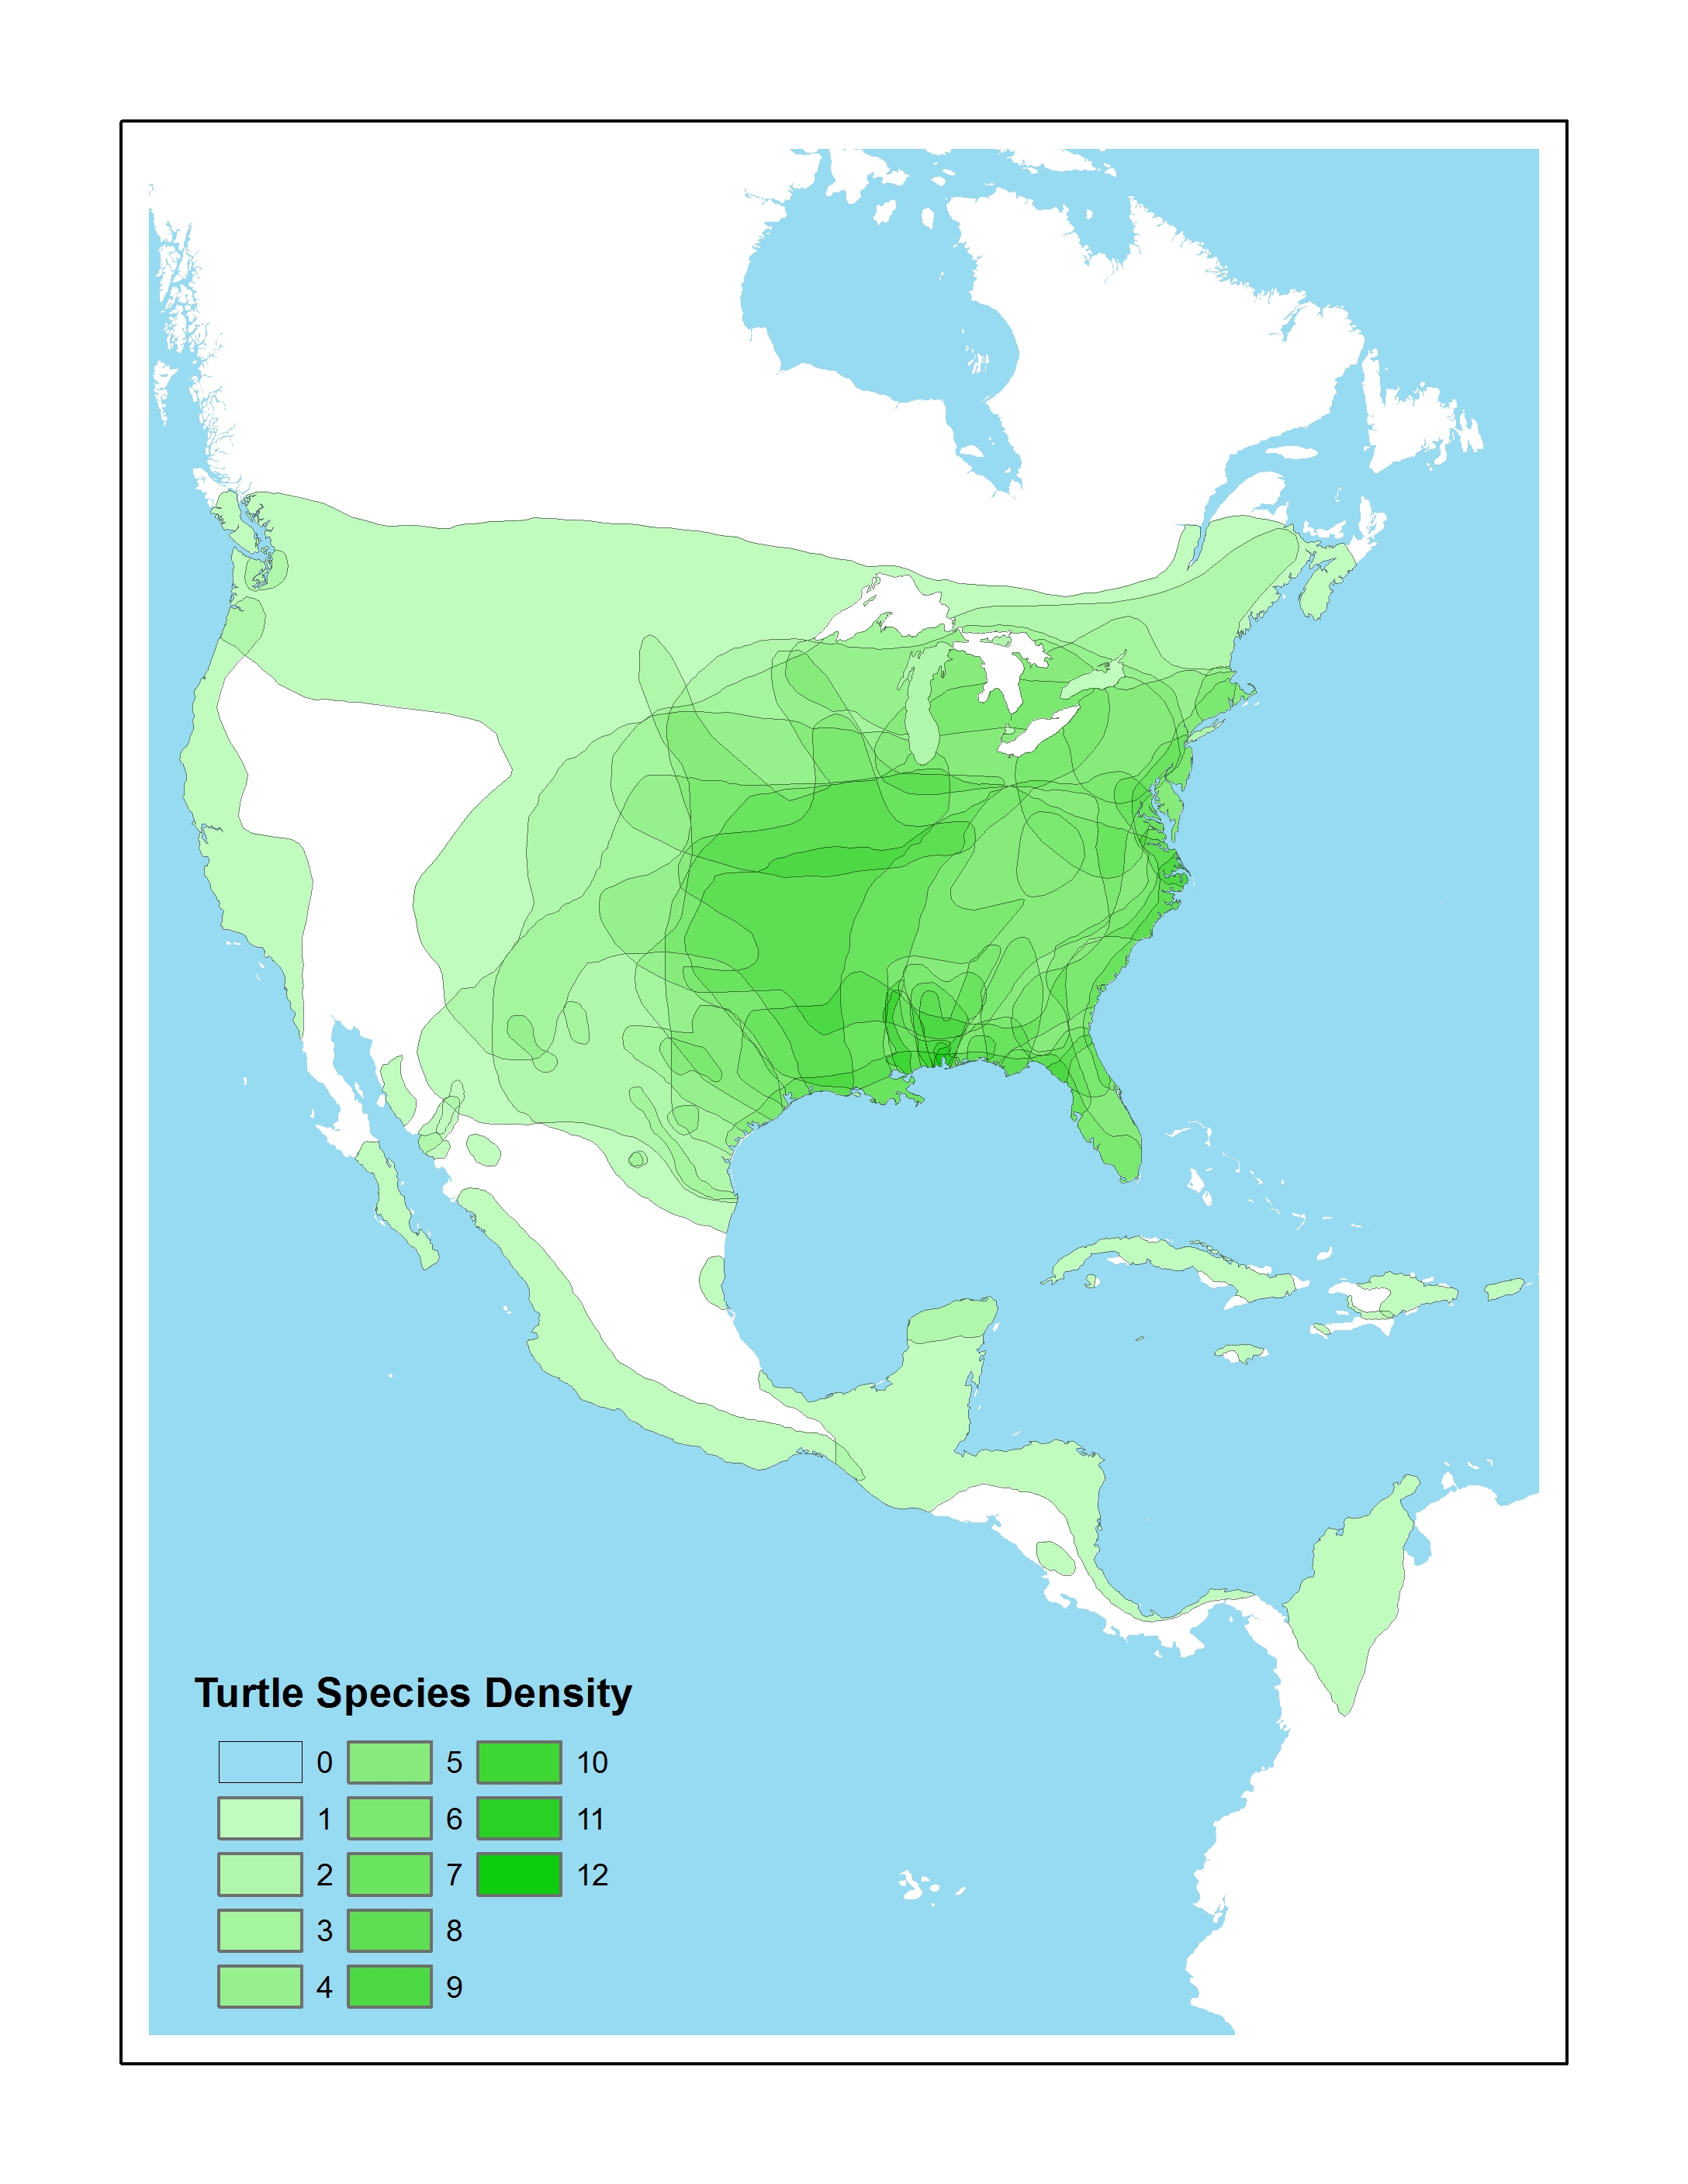
Over the last year, Biology professor Tristan Stayton used GIS and finite element analysis methods to explore this question. During Summer 2010, Prof. Stayton participated in a Library & IT workshop designed to give faculty hands-on experience using GIS for academic research and teaching.  Over the course of the summer, Prof. Stayton and his student researchers used ArcGIS to georeference and digitize turtle species ranges to convert them from image files into GIS data that could be used as input in Prof. Stayton’s analysis.  The same techniques were also used to digitize the ranges of 25 known turtle predators.

During the 2010-11 academic year, Prof. Stayton used the GIS datasets created during summer 2010 to calculate range sizes and range overlaps of turtles and their predators – and then to derive measures of turtle predation pressure. Prof. Stayton presented his conclusions last month at the Evolution 11 conference in Norman, Oklahoma and has a paper in the works as well.

The answer to the question? The short answer is that no, turtles with more powerful predators do not have stronger shells – in fact, they appear to have evolved weaker shell shapes.  But be sure to look at the poster below for a full presentation of the methodology, results and possible explanations for the findings.

Students involved in this project: Christine Vega ’11, Patrick Caloz ’13 and Joe Budzinski ’11 (georeferencing & vectorizing species ranges); Dan Ladd, GIS Student Assistant, Middlebury College ’14 (created turtle species density map shown in poster)



Categories
Bucknell/Local Interest Events/Calendar General GIS Map Apps Slideshow

Upcoming map competitions

Students – now that you are finished with your final GIS projects (you are finished, right?) why not submit them to one of these upcoming competitions. Bucknell students have won awards in other map competitions – let’s do it again:

1. 2011 National Council for Geographic Information (NCGE) Conference & Map Gallery:

The 2011 NCGE Map Gallery Committee invites you to submit a map for display during the 2011 Conference.  All GIS maps are welcome.  The maps will be judged by a panel of peers, with the exception of the People’s Choice Award, which will be voted on by the Conference attendees.  The Map Contest will feature two award categories and the winners will be announced at the closing session on Saturday, August 6, 2011.  Please review the minimum requirements and categories carefully when designing the content of your map entry.

Awards
Best Cartographic Design (Higher Ed., K-12 & People’s Choice) – Awarded to the map that artistically employs the elements of cartography without compromising use and functionality. Maps will be judged on fundamental cartographic principles including figure ground representations, visual hierarchy, color selection, typography, symbology, overall aesthetic appearance, etc.

Best Analysis (Higher Ed., K-12 & People’s Choice) – Awarded to the map that is best designed to display the results of spatial data analysis and presents the information in an unbiased way, allowing the viewer to extract their own conclusions, utilizing the map as a tool.

For guidelines & to submit maps, click here.

2. ESRI’s ‘Storytelling with Maps’ Competition.

Every map tells a story. Share your most interesting web map or mobile app in our Storytelling with Maps Contest. Entries will be judged on how well they make the subject matter interesting, understandable, and engaging. Web map and mobile app entries can be submitted April 29 – June 10, 2011. Prizes will be awarded for first, second, and third place in each category. Winners will be announced in July at the 2011 Esri International User Conference (Esri UC) in San Diego, California.

For guidelines and to submit web map or mobile apps, click here.

Categories
Bucknell/Local Interest Environment General GIS GIS in Biology Map Apps Slideshow

Stink bug mapping tool

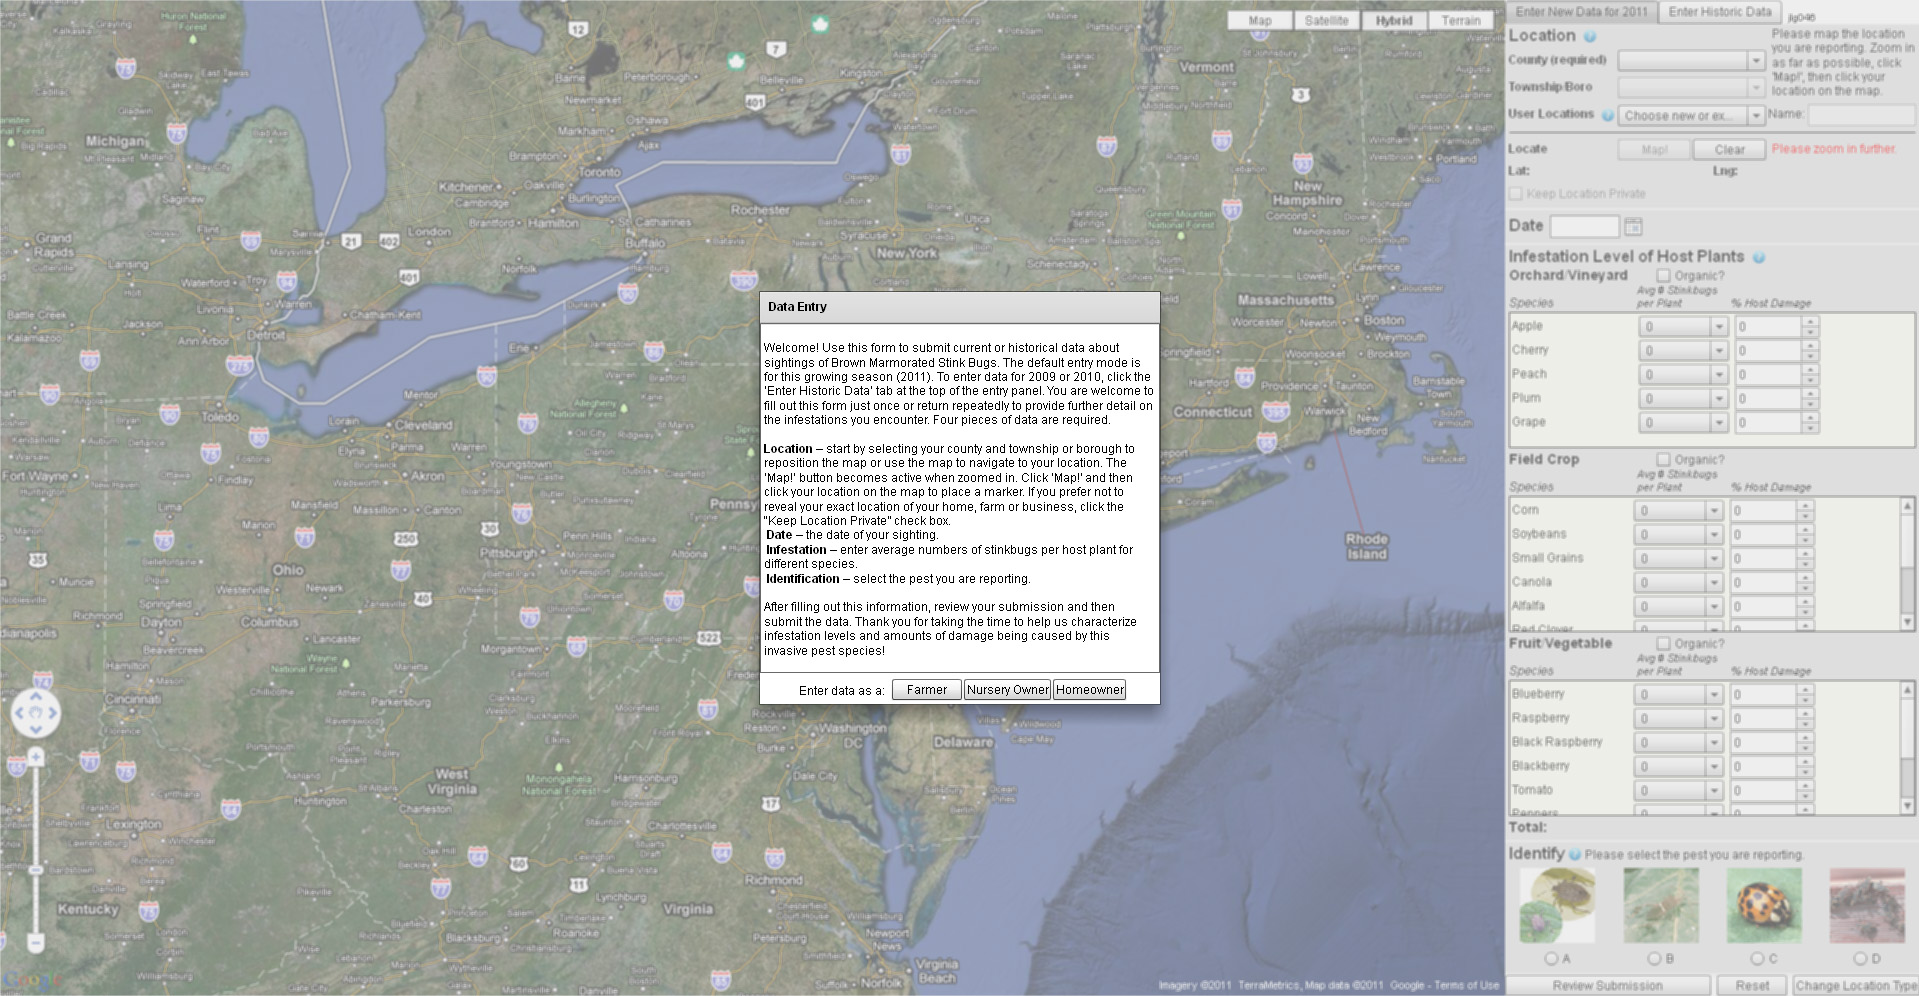
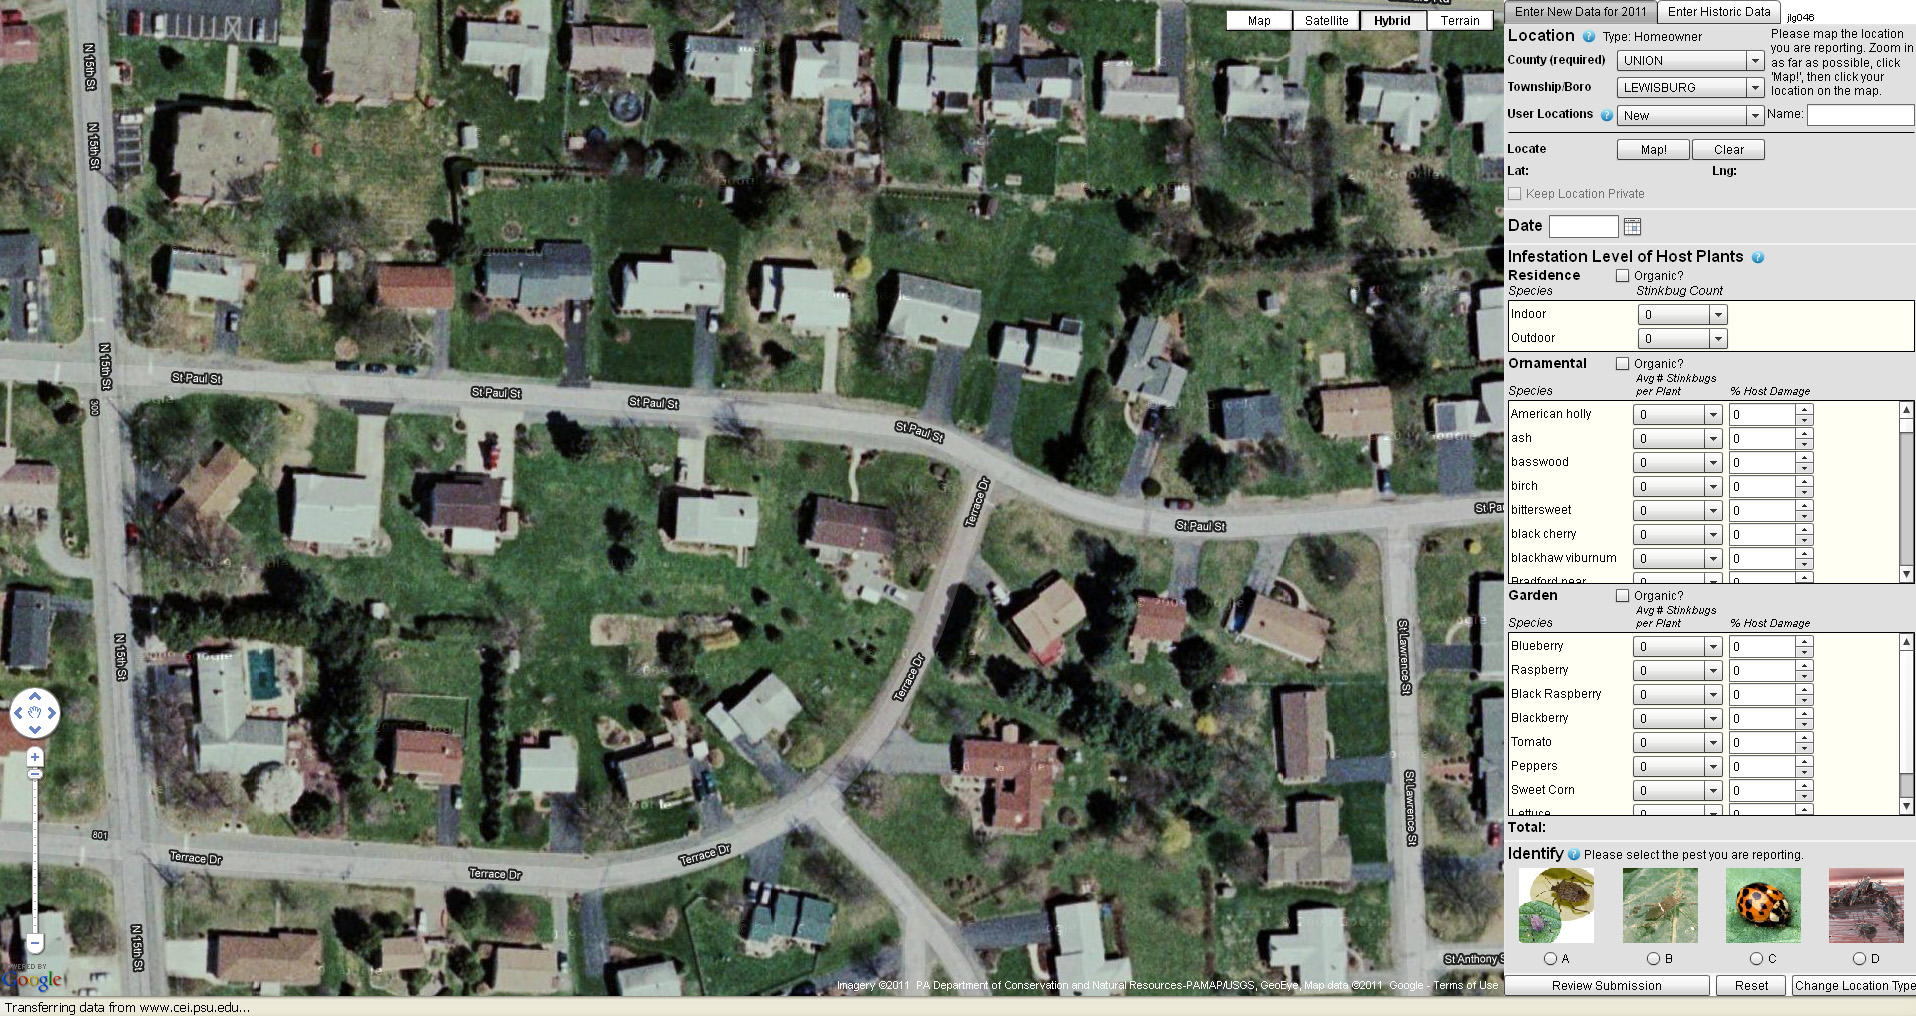
Penn State and the PA Department of Agriculture have just released a new web-based tool for mapping infestations of stink bugs across the state. The mapping tool collects and displays user-submitted data on stink bug sightings. After creating a login ID and passwords, users specify whether they are a farmer, nursery owner or homeowner and then identify their reporting location using either a Google Maps interface and/or a form to specify their county and municipality. Next, the user provides information on the level and type of infestation – including the number of stink bugs per type of tree, plant, and/or crop.

Read a story about the new website here. Click here to visit the Stink Bug website and map app. See below for some screenshots of the website and stink bug reporting interface.


Categories
Bucknell/Local Interest Digital Humanities General GIS GIS in Environmental Studies GIS in Geography GIS in History GIS in Humanities Map Apps Marcellus Shale Slideshow Videos

Uncovering the ‘Stories of the Susquehanna’ using GIS

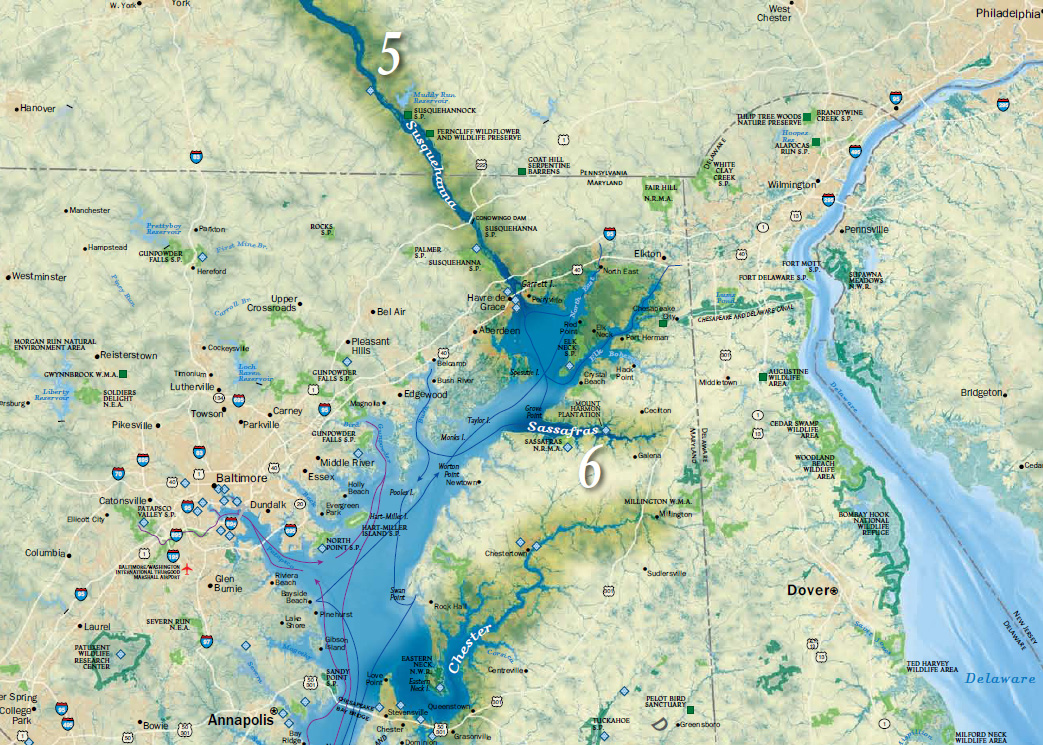
Bucknell faculty have long had an interest in grounding their research efforts locally – using the physical, cultural, historical and sociological landscapes of the Susquehanna Valley region as a living laboratory. The two videos below feature Prof. Katherine Faull and student Emily Bitely ’11 talking about the role of GIS in two such projects – the Stories of the Susquehanna, and the John Smith Trail Extension project (both multi-year, inter-disciplinary projects involving faculty from across the campus).

Katie Faull discussing her use of GIS for the John Smith Trail Extension and Stories of the Susquehanna project:
httpv://www.youtube.com/watch?v=j2eG2v8FnOA

Emily Bitely ’11 discussing her use of GIS for the same projects:
httpv://www.youtube.com/watch?v=1uPcaaqSzII

More about the John Smith Trail:

  • To learn more about the John Smith Trail, click here or here.
  • To view a National Geographic map detailing Captain John Smith’s voyage, click here.
  • To view a map of interpretive ‘smart’ buoys located in the river, click here.

More about the Stories of the Susquehanna project:

  • A pilot web mapping application featuring two of the ‘Stories of the Susquehanna’ is scheduled to launch this fall.  Stay tuned for more details.
  • Click here to read about the 2010 Susquehanna Valley Summer Writer’s Institute (SVSWI).  The SVSWI project is related to the Stories of the Susquehanna both in the type of local stories it explores and in its use of maps, audio, video, images and text to reflect on those stories in an interactive digital story-telling environment.
  • Click here to view the SVSWI’s interactive mapping application featuring students’ reflections on the impact of the Marcellus Shale gas boom on different populations in the Susquehanna Valley region.
Categories
General GIS Slideshow

bin Laden Habitat Suitability Model

Amongst all of the Osama bin Laden news from the last few days there was a fascinating article from sciencemag.org about a ‘bin Laden Habitat Suitability Model’ created by geography students at UCLA using GIS and remote sensing data, tools and spatial analytical techniques.

Click here to read the article “Geographers Had Calculated 81% Chance That Osama Was in Abbottabad.” See below for an excerpt. Thanks to UT Austin Geography Professor Jennifer Miller for the heads up on this article!

Could Osama bin Laden have been found faster if the CIA had followed the advice of ecosystem geographers from the University of California, Los Angeles? Probably not, but the predictions of UCLA geographer Thomas Gillespie, who, along with colleague John Agnew and a class of undergraduates, authored a 2009 paper predicting the terrorist’s whereabouts, were none too shabby. According to a probabilistic model they created, there was an 80.9% chance that bin Laden was hiding out in Abbottabad, Pakistan, where he was killed last night.