Yesterday’s NY Times had an opinion piece praising Philadelphia’s efforts in recent years to improve access to healthy food for its most disadvantaged neighborhoods and citizens. In ‘Go Philly!’, Mark Bittman describes the collaborative efforts of Philadelphia municipal government, the Commonwealth of PA and a whole host of local non-profits (including my former employer, the newly renamed Greater Philadelphia Urban Affairs Coalition) in developing programs to bring supermarkets and healthy food options to under-served neighborhoods.
What he doesn’t describe is the critical role that GIS has played in bringing these programs to life. See below for some background information and resources related to using GIS for improving access to healthy food.
1. Watch this short video (Ch. 3 of Episode 2 from Penn State’s Geospatial Revolution video series) to learn more about the role of GIS in Philadelphia’s ‘healthy food’ success story.
httpv://www.youtube.com/watch?v=RYzHcPHRhWQ
2. Read reports from the Food Trust and The Reinvestment Fund (TRF) describing their work in Philadelphia and other communities. Both organizations are Philadelphia-based non-profits that have been at the center of Philadelphia’s efforts to improve access to healthy food.
“The Grocery Gap: Who Has Access to Healthy Food and Why It Matters” – click here
Food Trust/TRF Report on the Fresh Food Financing Initiatives projects – click here
TRF’s resource page on food access – click here
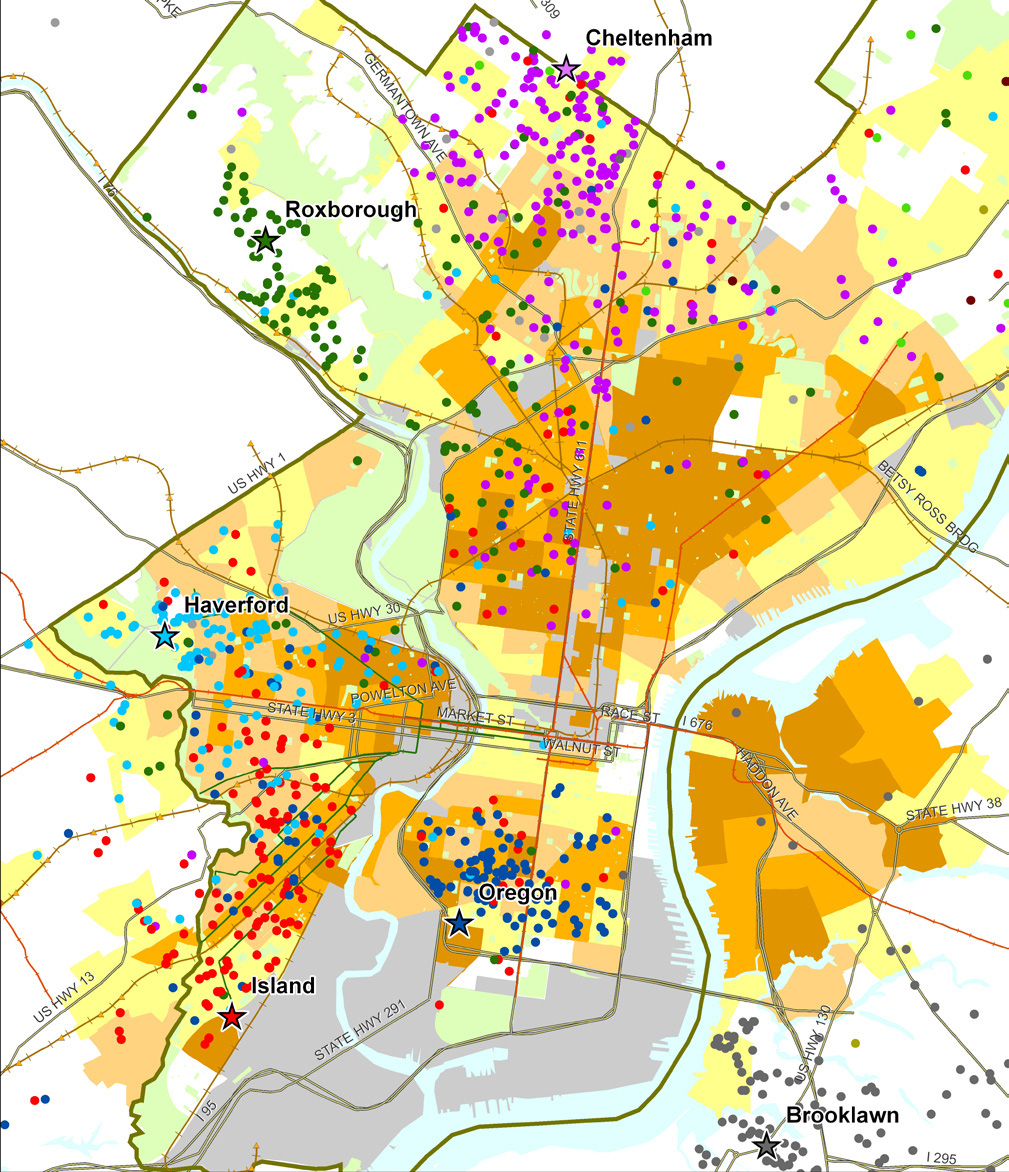
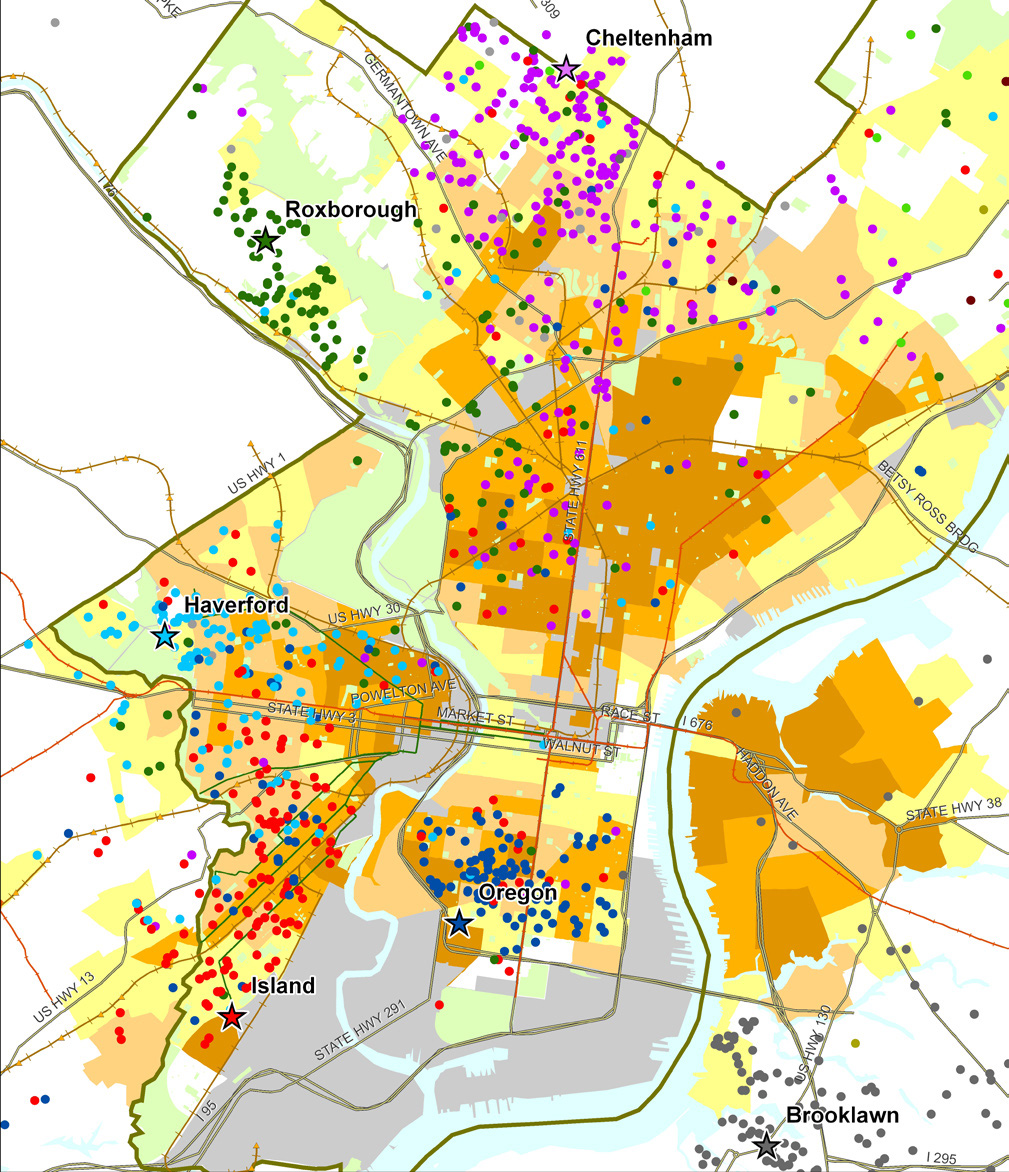
Sample map from Food Trust/TRF report on the Fresh Food Financing Initiative:
“Map 1: Residence of ShopRite Employees by Poverty Rate of Census Tract. Each star on the map represents a Brown’s ShopRite store, with the location of the store’s employees illustrated by correspondingly colored dots.”
3. Watch a video created by TRF in collaboration with the Brookings Foundation to describe their use of GIS and findings in their “Getting to Market” report on healthy foods initiatives across the U.S.
httpv://www.youtube.com/watch?v=Wp1w9s4kkHU
and/or explore the project website for “Getting to Market” – click here . The project site includes profiles of food access in major U.S. metropolitan areas.
4. Explore interactive web mapping applications featuring data on supermarket access:
ESRI’s ArcGIS Online Supermarket Access Map – click here
TRF’s PolicyMap Data on Supermarket Access – click here
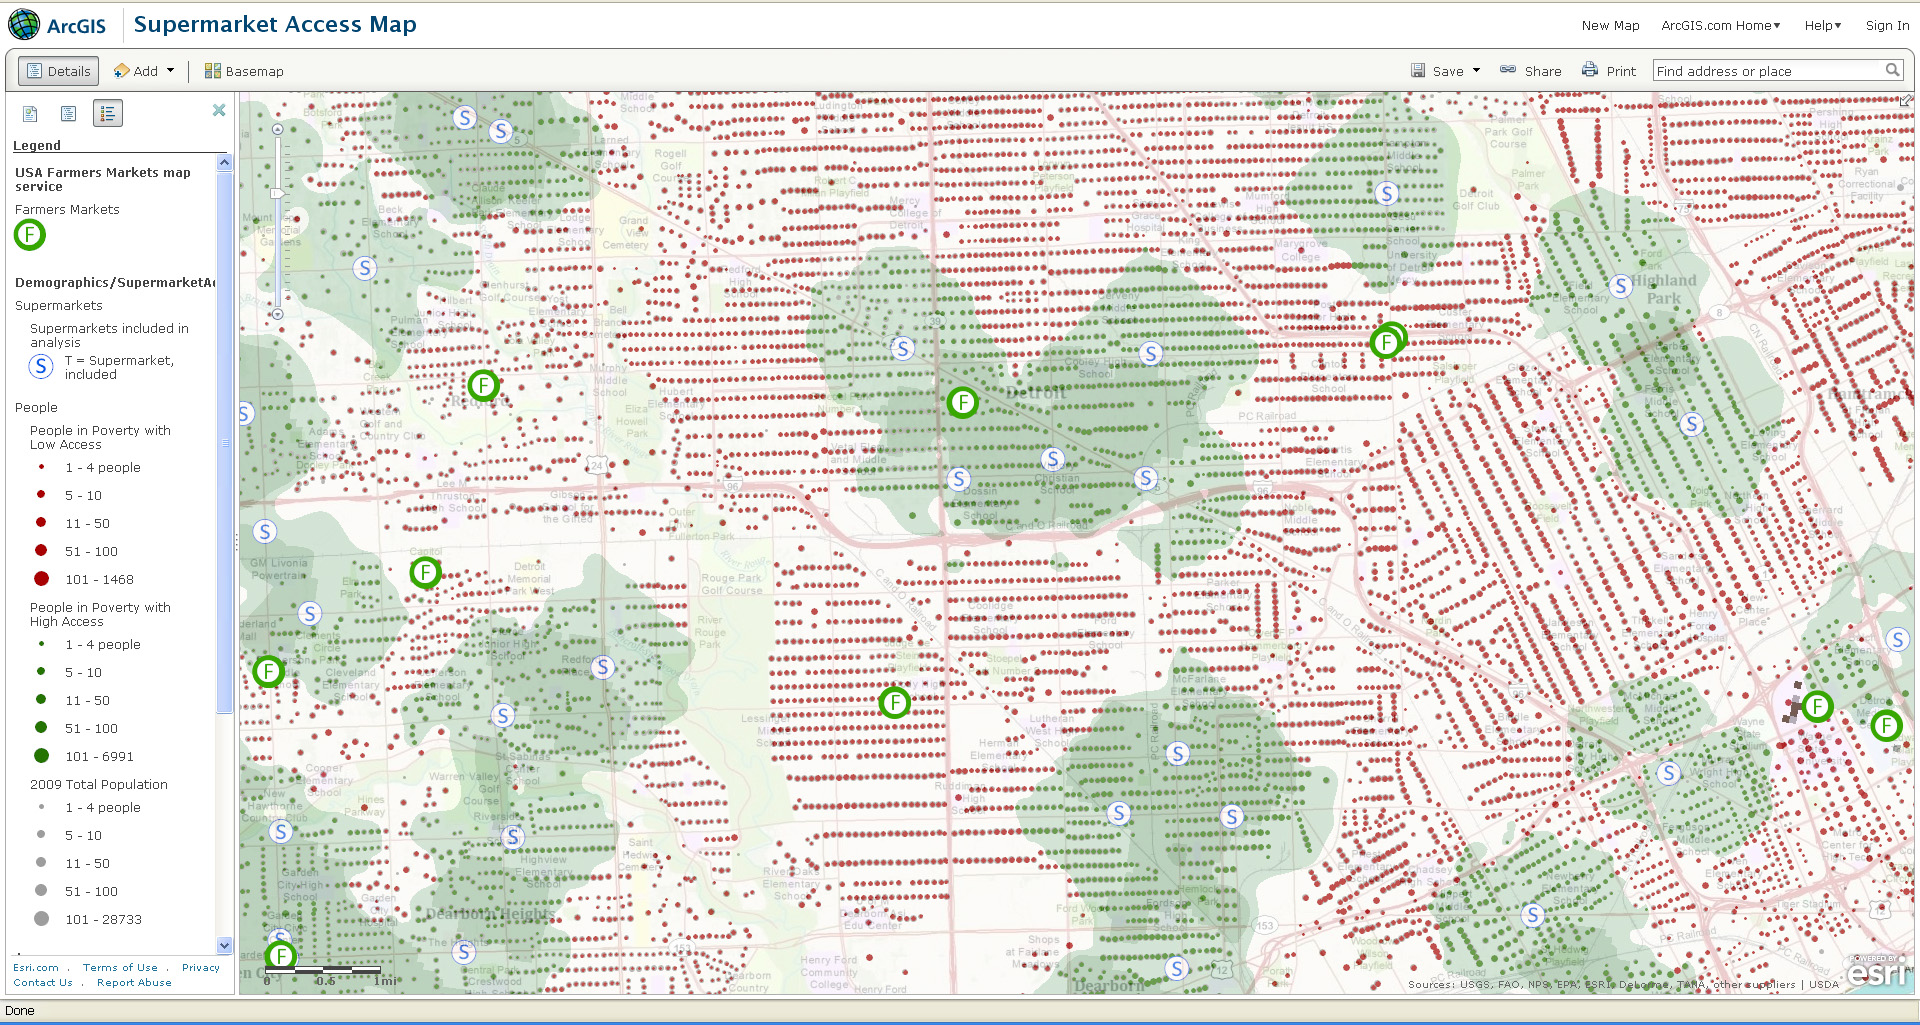
Sample map from ESRI’s Supermarket Access Map:
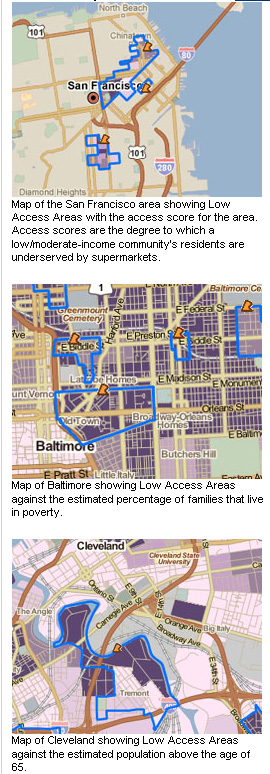
Sample maps from TRF’s PolicyMap application: