Categories
Bucknell/Local Interest Crisis-Mapping Data Environment General GIS GIS Jobs, Internships, Scholarships & Grad Programs Map Apps Slideshow

GIS Job Opportunities – DevelopmentSeed

Back in October I mentioned that developing GIS technical skills can help you land a job after graduation. Well, here’s the proof.  Recent Bucknell grad Chad Lawlis, Environmental Studies ’11, just got hired as the Mapping & Data intern for Development Seed, a Washington D.C.-based consulting/R&D company known for its innovative, open-source solutions for data visualization and mapping.

Chad never had a chance to take either of Bucknell’s intro GIS courses (GEOG204 – Applied GIS, taught by Duane Griffin and GEOL 230 – Environmental GIS, taught by Carl Kirby and Rob Jacob) at Bucknell, although I’m sure he wishes he had as both are phenomenal courses! Instead, he picked up GIS skills by working as a research assistant for Prof. Amanda Wooden, developing GIS datasets for her work on environmental activism in Kyrgyzstan. Chad also served as a GIS Student Assistant during Summer 2011 working on a variety of projects, including asset mapping for Lycoming County.  Chad writes:

“Currently I am working on the Atlas Project… compiling and processing a number of large demographic data sets for all of the US which will soon translate into making election maps using TileMill (DevelopmentSeed’s free, lightweight map design software). I am already learning so much about data cleaning and processing – using OpenOffice, TextMate, Google Refine, SQLite, and Terminal so far – and looking forward to what’s to come with map making in TileMill and hopefully a bit of web design as well. The office atmosphere is a lot of fun too, very much a startup vibe… in a small renovated apartment with foosball, pingpong, and even a bar in the basement and a few dogs running around as well.”

So… if you like your maps served up with foosball, beer and dogs (and would like to get paid for working in that kind of environment), you should definitely consider developing GIS skills during your time at Bucknell.  The Development Seed job and many others can be found on the GIS Jobs Clearinghouse website. Or feel free to schedule an appointment to come talk with me about GIS job options.

Chad Lawlis, Environmental Studies '11


Categories
Bucknell/Local Interest Digital Humanities General GIS GIS in History Slideshow

Bucknell HGIS presentation at Yale

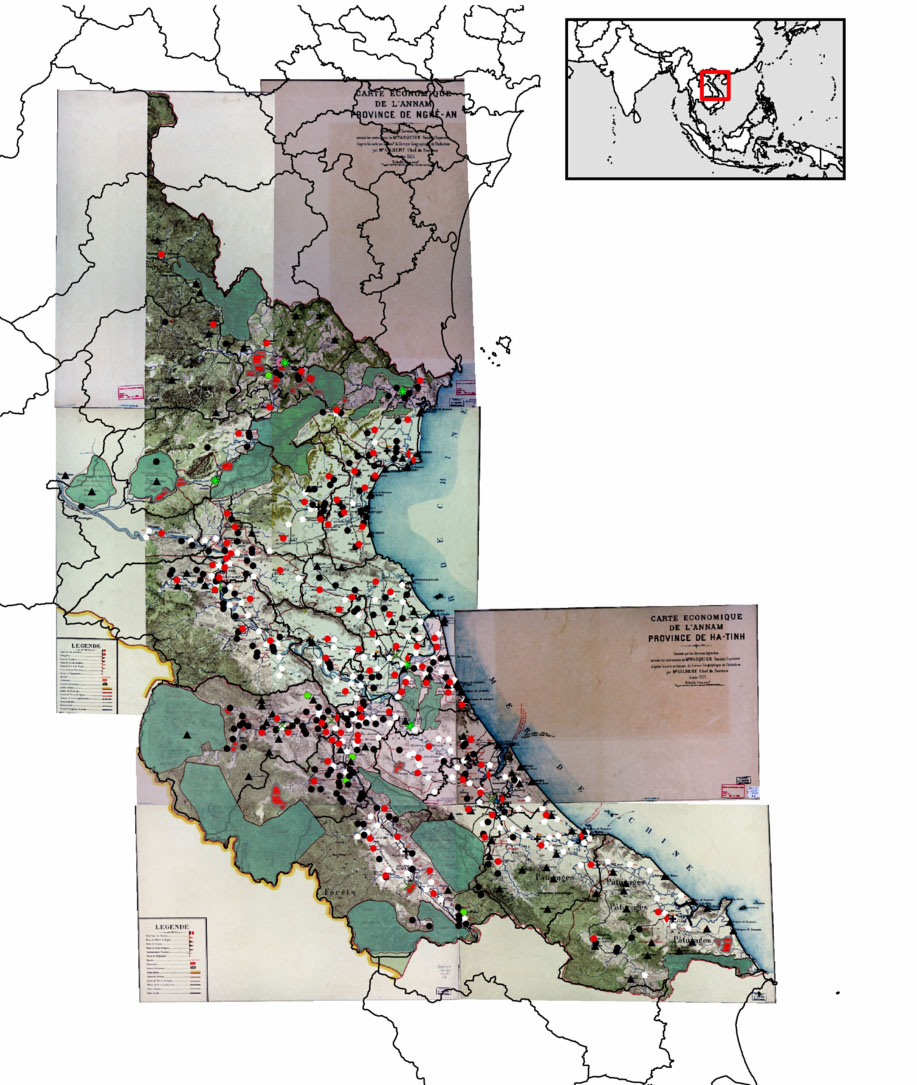
Over the last two and a half years, Bucknell History professor David Del Testa has been working – on his own and in collaboration with me and the GIS Student Assistants – on integrating GIS into his research on historical protest events in Vietnam.  Last October, Prof. Del Testa presented preliminary results from this work at UC Berkeley’s Center for Southeast Asia Studies. Click here to see a video of his presentation and to check out his H-GIS (historical GIS) blog Places, Spaces, Peoples, History.

On Wednesday, February 8th, Prof. Del Testa will be travelling to New Haven, CT to deliver another presentation of his work in progress. The presentation, called ‘Re-Evaluating Vietnam’s Nghe-Tinh Soviets (1930-31) using a Historical GIS,’ will be hosted by the Yale University Council for Southeast Asian Studies and is open to the public (in case you happen to be in the neighborhood… the talk will be held in Room 203, Luce Hall, 34 Hillhouse Avenue).

Here’s a link to the presentation announcement, along with an abstract:

“Reevaluating the Nghe-Tinh Soviets of 1930-1931 using a Historical GIS: Refining Some Preliminary Observations”
David Del Testa, Department of History, Bucknell University

The Nghe-Tinh Soviets of 1930-1931, a rebellion against colonial authority in north-central and central colonial Vietnam, has received extensive analysis by a variety of commentators and scholars, both Vietnamese and not. Most scholars, Vietnam and internationally, settled on some view of immiseration combined with the presence of pro-communist organizers as the motive forces for the rebellion, but a few have favored questions of political dissatisfaction and local empowerment as underlying motivations for revolt. Until recently, examining the rebellion on a gross scale in order to test either theory has proven difficult, with a surfeit of information but no easy way to process it in order to underwrite large-scale analyses. Del Testa is using a historical GIS (geographical information system) analysis, which blends statistics with digitized maps, in order to display correlations between factors, such as wealth, religion, and so on of those who rebelled in order to reexamine the Nghe-Tinh Soviets movement on a grand scale. His presentation will illustrate some initial findings as well as the techniques used.


Categories
Bucknell/Local Interest Data General GIS Slideshow

Mapping Santa vs. Satan – Round 1

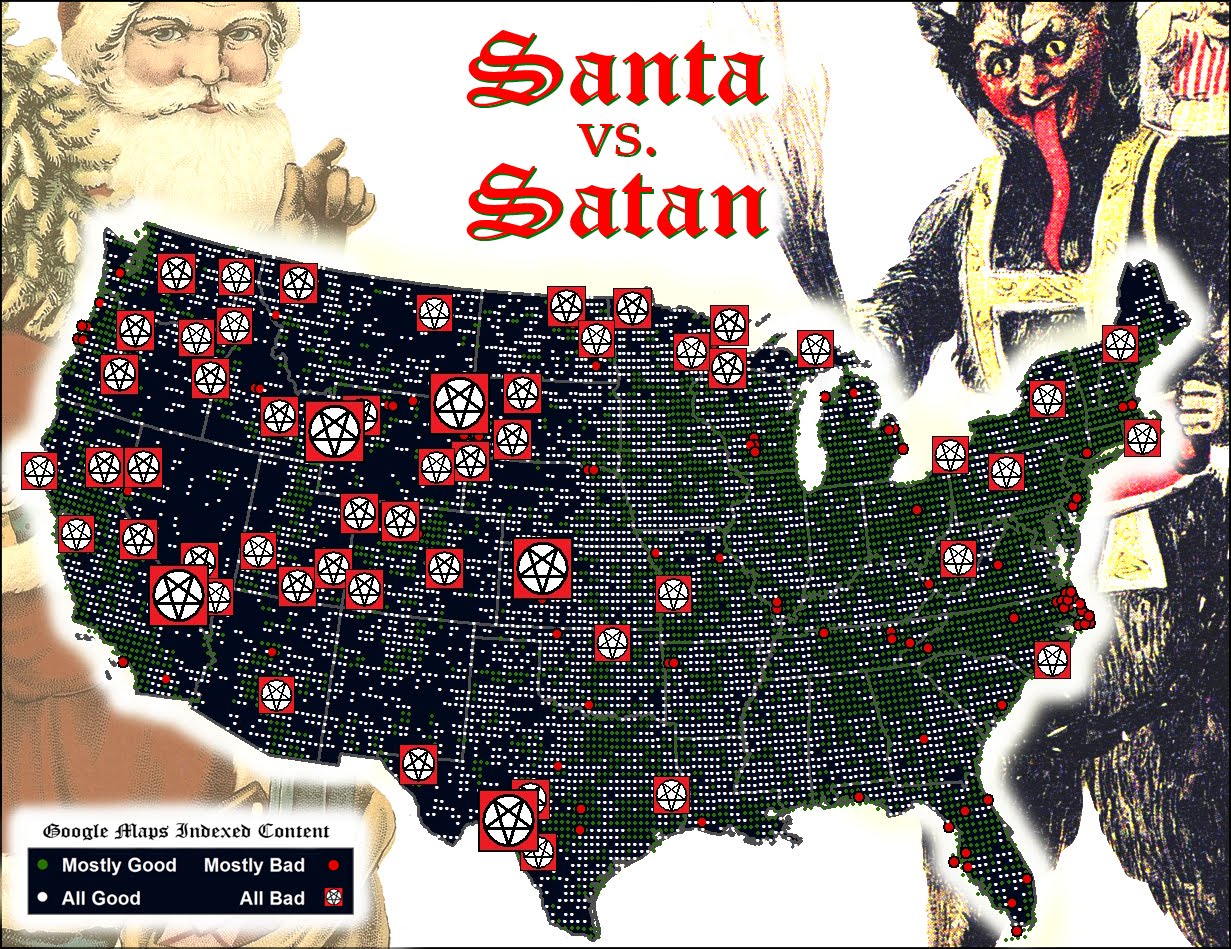
Thanks to Geography Professor Duane Griffin’s spooky ‘Santa vs. Satan’ map submission (deemed one of the ‘all-time greats’ – see below), Bucknell has scored a knock-out in round one of the Floatingsheep blog’s Christmas map contest.

The Floatingsheep blog – a favorite amongst mapping, visualization and social media enthusiasts – was founded two years ago by Dr. Matthew Zook (an Associate Professor at the University of Kentucky, USA) and Dr. Mark Graham (a Research Fellow at the Oxford Internet Institute, UK). The site is dedicated to:

“mapping and analyzing user generated Google Map placemarks… [to] provide a glimpse of what internet users (in the aggregate) think about particular places. Where are people posting placemarks about swine flu? Which places are considered to be “fun” by the collective intelligence of the Internet users?”

FloatingSheep uses a proprietary software program that conducts a worldwide search for Google Maps placemarks containing specific keywords . The software records the number of results generated for each keyword and creates a grid map where each cell indicates the number of hits returned for the Google Maps keyword search in that particular location.

After looking at Santa and reindeer in 2009 and the geography of local names for Santa in 2010, the Floatingsheep team has added a new twist to the Christmastime ‘naughty or nice’ debate by choosing a ‘Santa vs. Satan vs. Zombies’ theme for its 2011 Christmas map contest.  Floatingsheep did a search for 24 keywords related to Santa/Satan/Zombies to see, as Dr. Graham says “whether the places we live in are augmented by more Christmas-related information or more devilish/ghoulish-related information.”

Prof. Griffin downloaded the grid map data from Floatingsheep’s keyword search and then aggregated and visualized it to produce his masterpiece. See below for Floatingsheep’s write-up on Duane’s map.

Our third entry comes from Duane Griffin [1] with a map that we’re quite frankly really creeped out by. I made sure my laptop was closed last night so it couldn’t escape.


Duane outlines his method as, “I aggregated all of the Satan/Lucifer/zombies/etc. as Team Satan, aggregated all the religious and holiday categories and everything else as Team Santa (including fatman and robot santa), and mapped them Fox-style to hype up the threat. The “Mostly” category is based on the team ratio.” The result is a road map of “badness”. While Las Vegas comes as no surprise, who knew that Wyoming was so Satan-ridden? And I’m going to think twice before heading out to the middle of Kansas. Duane simply notes that it “Looks as if the Forces of Evil are winning the West and making inroads into the eastern US.” Others (e.g., my mother) notes with some surprise that Washington D.C. shows up as mostly good which defies all expectations.

Happy holidays! And stay tuned for more posts.

[1] Other identifying information such as his role as a professor at Bucknell University has been withheld so he is not tainted by his admission of being a Floating Sheep reader. [2]

[2] Oops.

Categories
Bucknell/Local Interest General GIS Map Apps Slideshow

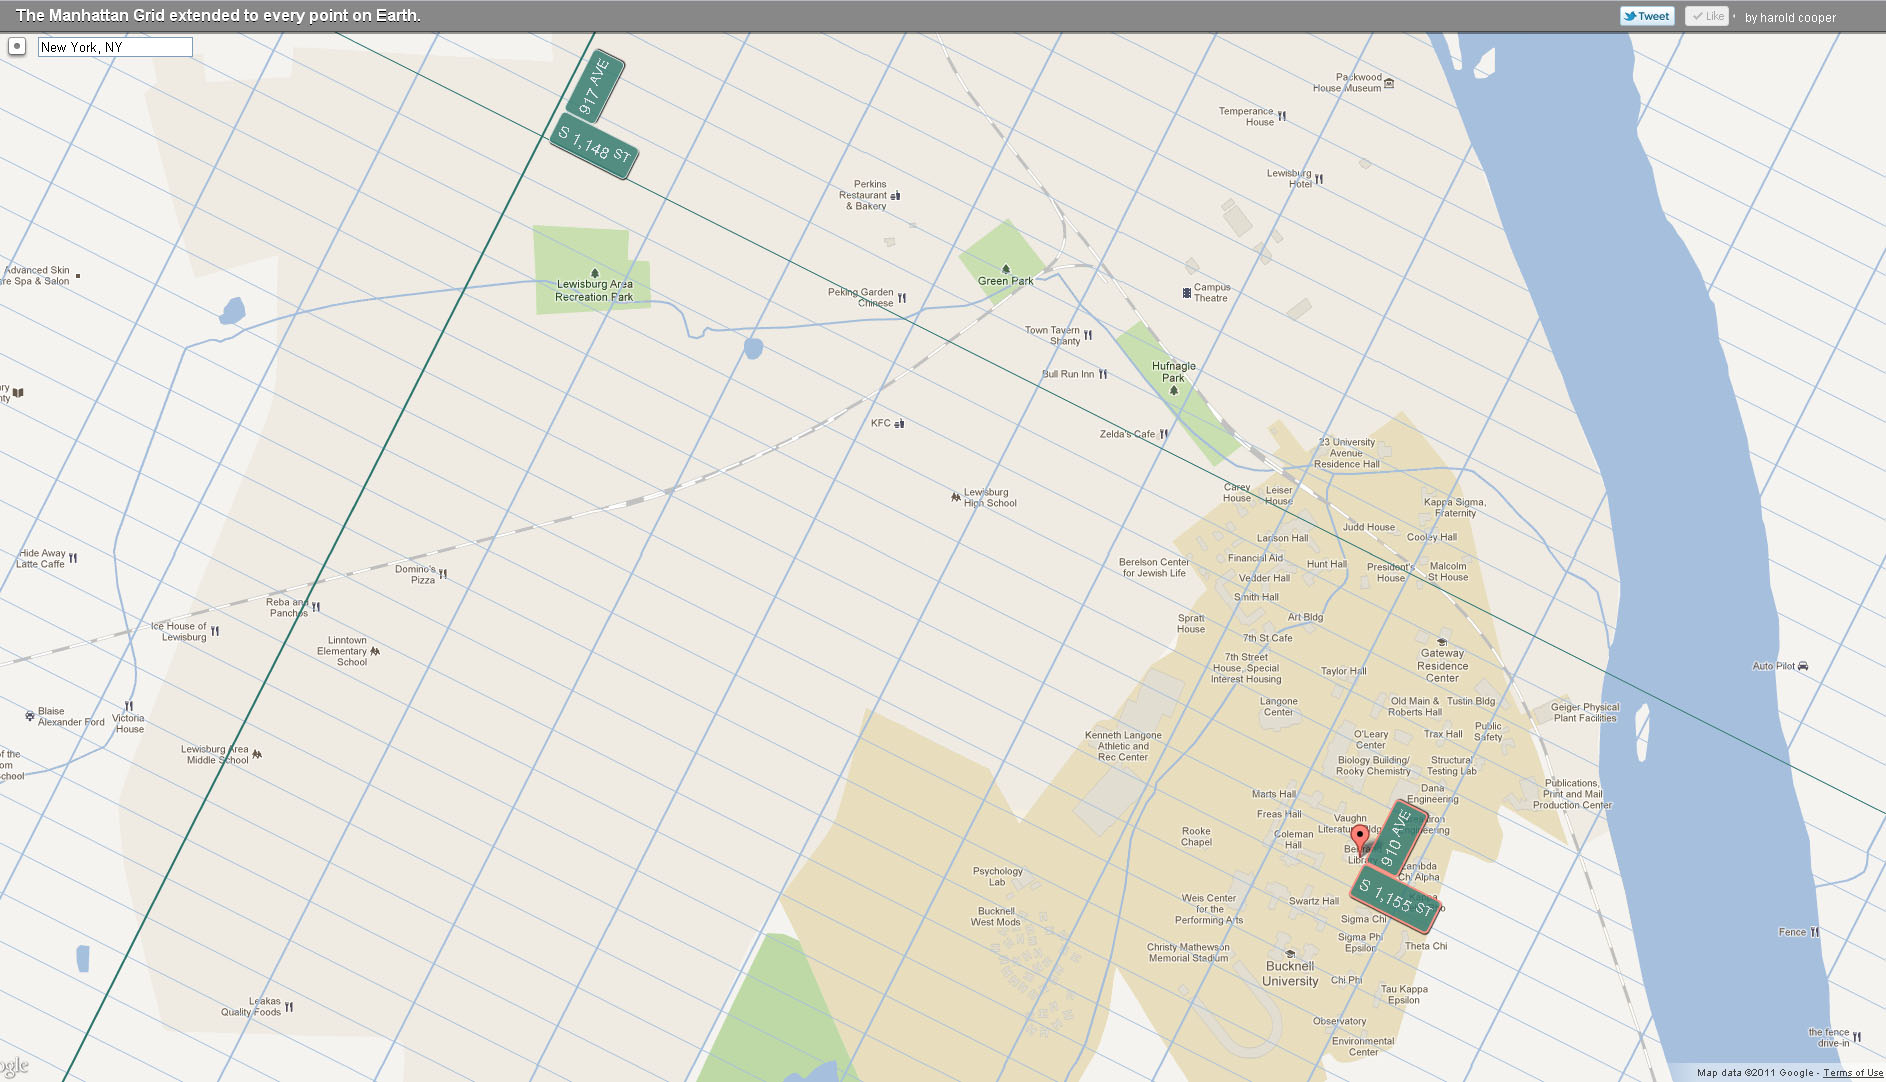
Bucknell’s campus in Central Park (way, way) West

Check out Harold Cooper’s ExtendNY map application to find out what your NYC address is – even if  you live in Topeka, KS or Vladivostok, Russia. More on the project from an article in yesterday’s Huffington Post:

Earlier this summer we marked the 200th anniversary of Manhattan’s grid plan, that easy-to-navigate layout of streets and avenues that gives us Manhattanhenge, drives Speed Levitch crazy, and might just be based off some ancient urban planning.

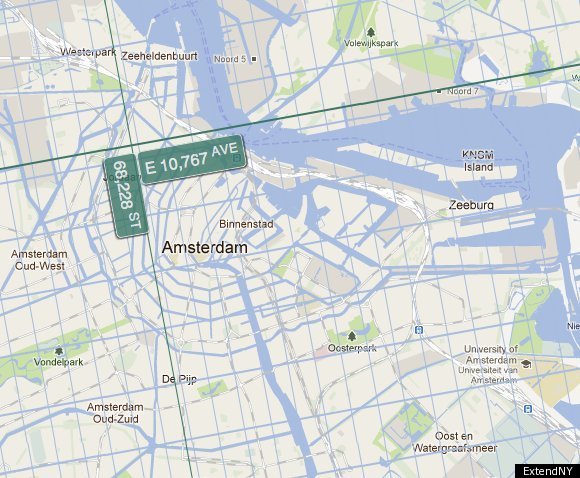
In celebration of that anniversary, Harold Cooper … has made this incredible interactive map that extends New York’s grid system to every single place on planet earth. San Francisco? Just walk West to 15,957th Avenue. London? Easy! Just take a stroll East to 10,896th Avenue on 63,708 Street.

The map allows you to scroll across the world, zooming in on different places to see where a walk way way East on 66,228th Street will take you (see photo below).

Click on the map below to see Bucknell”s NYC address.


Categories
Bucknell/Local Interest Environment Events/Calendar General GIS GIS Jobs, Internships, Scholarships & Grad Programs Slideshow

Happy GIS Day, Bucknell!

If the map-lovers and geo-geeks in your life have an extra spring in their step this morning, it’s because GIS day is finally here!!!! No, you probably can’t get out of class or work on this holiday but there’s still a lot to get excited about, including:

1. Jobs – developing GIS and spatial literacy skills can help you get a job.

The geospatial industry and market for it continue to expand at a phenomenal rate. The latest Dept. of Labor statistics show more than 850,000 current geospatial workers with an additional 350,000 needed by 2018 (from GeoTechCenter.org)

Because the uses for geospatial technology are so widespread and diverse, the market is growing at an annual rate of almost 35 percent, with the commercial subsection of the market expanding at the rate of 100 percent each year. (from U.S. Department of Labor’s Employment & Training Administration website)

2. Cake – GIS day means…. cake! Last year was an orthophoto cake. This year the cake has gone inter-galactic. Want to eat a slice of the globe cake? It’ll be served up at noon near the central staircase in the library.

3. Geo-geek humor – That’s right, GIS Day is also a celebration of the collective, colossal geekiness of the people all over the world who do GIS. Last year’s GIS Day brought us a GIS-inspired cover version of Jay-Z and Alicia Keys’ ‘Empire State of Mind.’

httpv://www.youtube.com/watch?v=4mCDUf08YLg

This year is a cartoon on what your favorite map projection says about you.