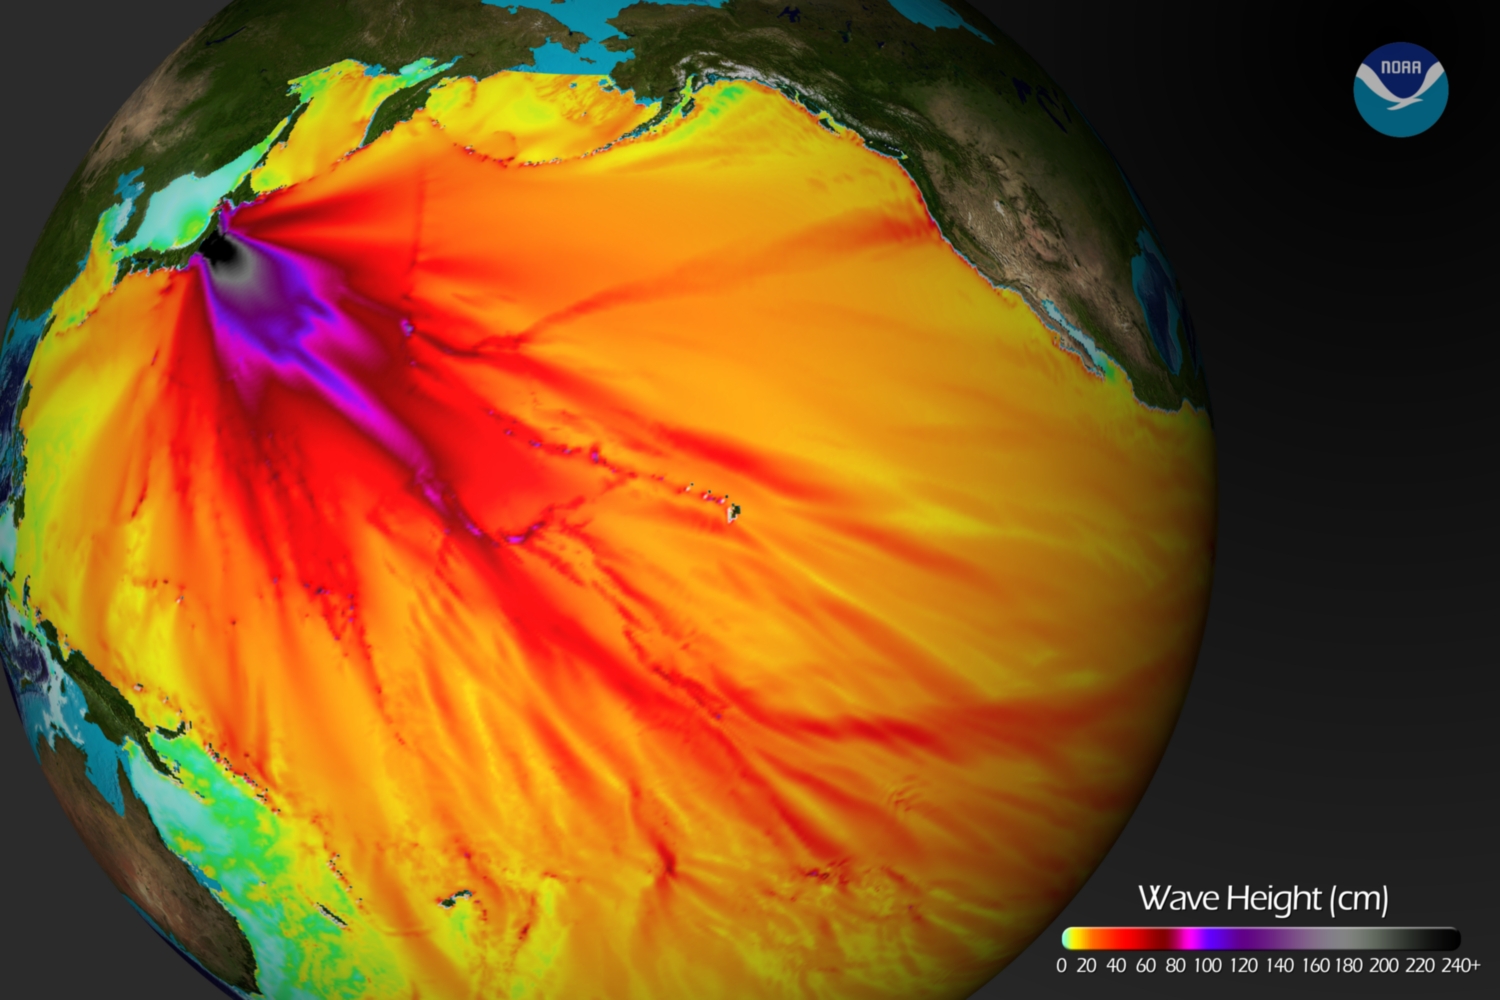
Below is a tsunami wave height model that shows the Pacific-wide impact of the event. The model was created by the NOAA Environmental Visualization Lab:
Description from NOAA:
Model runs from the Center for Tsunami Research at the NOAA Pacific Marine Environmental Laboratory show the expected wave heights of the tsunami as it travels across the Pacific basin. The largest wave heights are expected near the earthquake epicenter, off Japan. The wave will decrease in height as it travels across the deep Pacific but grow taller as it nears coastal areas. In general, as the energy of the wave decreases with distance, the near shore heights will also decrease (e.g., coastal Hawaii will not expect heights of that encountered in coastal Japan).The second image shows the depth of the Pacific Ocean floor. Notice the similarity between areas of low wave height and deeper areas of the ocean.
Below is an image visualizing the maximum amplitude plot for the tsunami wave.
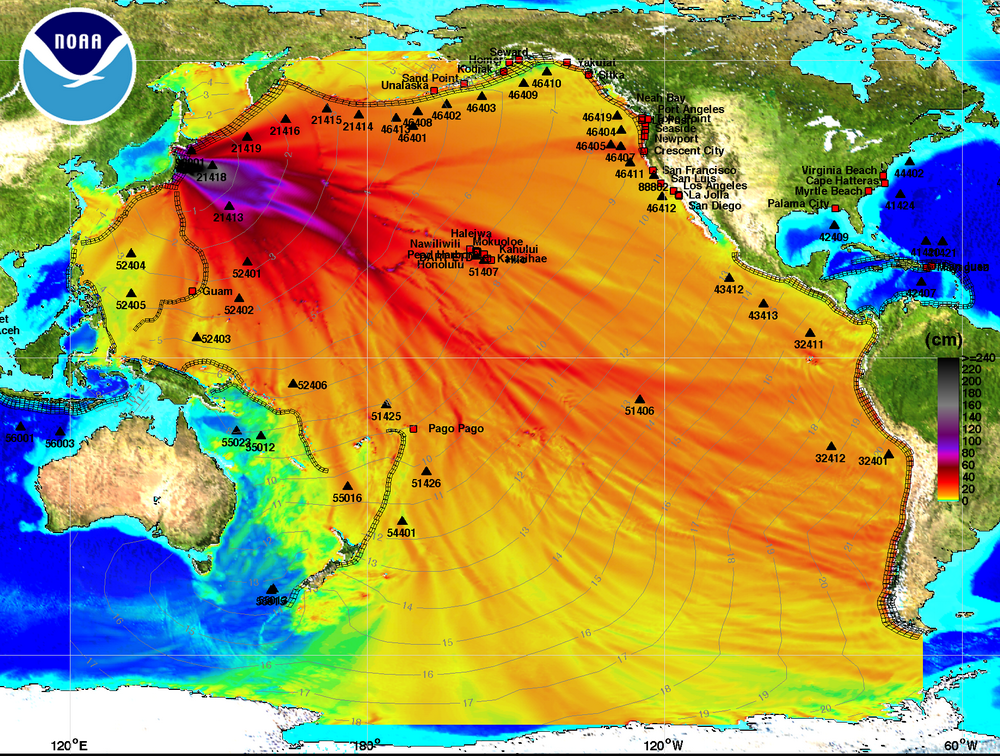
Click here on the NOAA Center for Tsunami Research home page to download a Google Earth KMZ file with the maximum amplitude plot data shown in the visualization above.
And finally, a video showing the propagation of the tsunami wave.
httpv://www.youtube.com/watch?v=PBZGH3yieLc
From the NOAA Center for Tsunami Research:
Propagation of the March 11, 2011 Honshu tsunami was computed with the NOAA forecast method using MOST model with the tsunami source inferred from DART® data. From the NOAA Center for Tsunami Research, located at NOAA PMEL in Seattle, WA. See http://nctr.pmel.noaa.gov/honshu20110311