Categories
Bucknell/Local Interest Digital Humanities General GIS GIS in History Slideshow

Bucknell HGIS presentation at Yale

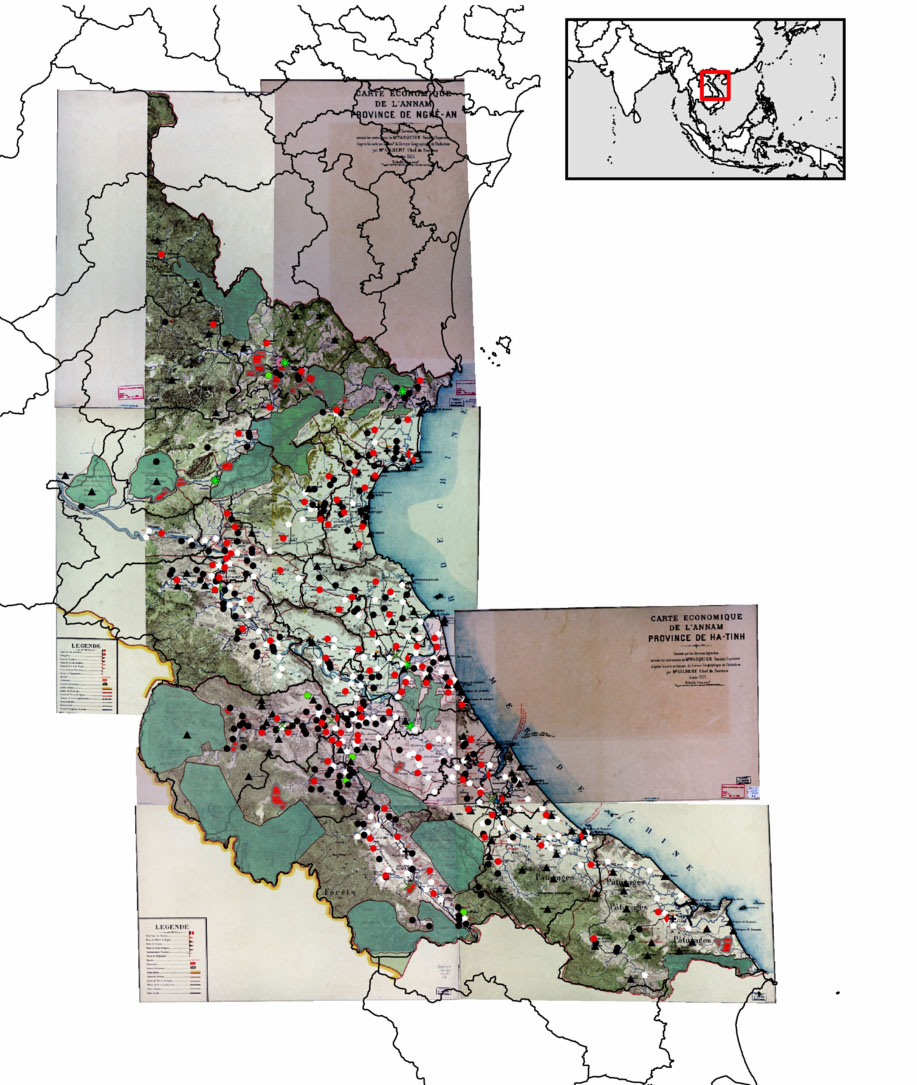
Over the last two and a half years, Bucknell History professor David Del Testa has been working – on his own and in collaboration with me and the GIS Student Assistants – on integrating GIS into his research on historical protest events in Vietnam.  Last October, Prof. Del Testa presented preliminary results from this work at UC Berkeley’s Center for Southeast Asia Studies. Click here to see a video of his presentation and to check out his H-GIS (historical GIS) blog Places, Spaces, Peoples, History.

On Wednesday, February 8th, Prof. Del Testa will be travelling to New Haven, CT to deliver another presentation of his work in progress. The presentation, called ‘Re-Evaluating Vietnam’s Nghe-Tinh Soviets (1930-31) using a Historical GIS,’ will be hosted by the Yale University Council for Southeast Asian Studies and is open to the public (in case you happen to be in the neighborhood… the talk will be held in Room 203, Luce Hall, 34 Hillhouse Avenue).

Here’s a link to the presentation announcement, along with an abstract:

“Reevaluating the Nghe-Tinh Soviets of 1930-1931 using a Historical GIS: Refining Some Preliminary Observations”
David Del Testa, Department of History, Bucknell University

The Nghe-Tinh Soviets of 1930-1931, a rebellion against colonial authority in north-central and central colonial Vietnam, has received extensive analysis by a variety of commentators and scholars, both Vietnamese and not. Most scholars, Vietnam and internationally, settled on some view of immiseration combined with the presence of pro-communist organizers as the motive forces for the rebellion, but a few have favored questions of political dissatisfaction and local empowerment as underlying motivations for revolt. Until recently, examining the rebellion on a gross scale in order to test either theory has proven difficult, with a surfeit of information but no easy way to process it in order to underwrite large-scale analyses. Del Testa is using a historical GIS (geographical information system) analysis, which blends statistics with digitized maps, in order to display correlations between factors, such as wealth, religion, and so on of those who rebelled in order to reexamine the Nghe-Tinh Soviets movement on a grand scale. His presentation will illustrate some initial findings as well as the techniques used.


Categories
Digital Humanities General GIS GIS in History Slideshow

Using G.I.S. to Visualize Historical Landscapes

Guest post by Michael Grasso, Environmental Studes 13′

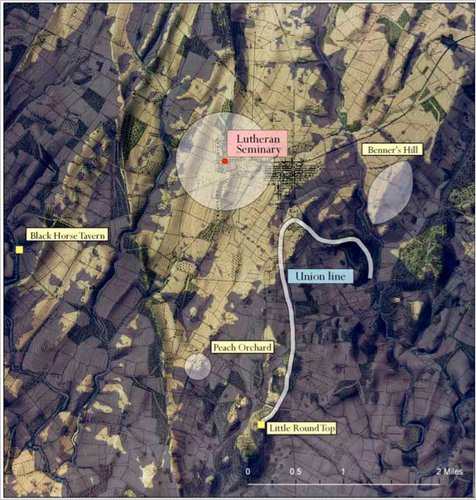
Geographic Information Systems can be used recreate a landscape that no longer exists. Historians can use this technology to help explain confusing, or even previously unexplainable, events that took place in the past. For example, General Robert E. Lee issued a series of orders (Pickett’s Charge) that directly caused the Confederates to lose the battle of Gettysburg and inevitably the Civil War. If anyone stood today where General Lee stood that fateful day they would be able to clearly see the fortified, superior Union force waiting for the charge – and wonder why Gen. Lee made the decision that he did. However, the landscape has dramatically changed in the 150 years since the Civil War.  Using historical maps and other documentation, geographers and historian were able to re-create the landscape that General Lee saw and to determine that – from his position 150 years ago -one could not see the eastern end of the battle field where Union forces were amassing.

This is a link to an article explaining how G.I.S. was used to answer questions be recreating historical landscapes such as the Battle of Gettysburg, the 1930s dust bowl, and the Salem Witchcraft Trials.

Categories
Bucknell/Local Interest Digital Humanities Environment General GIS GIS in History GIS in Humanities Slideshow

Georeferencing Historic Maps of Susquehanna Valley Region

Guest Post by Robby Holler, Geography/International Relations ’13

During the past two months, I’ve spent time working with other GIS interns with many of their projects.  Much of my time, though, has been spent on two projects: georeferencing an 1868 atlas of central Pennsylvania and georeferencing and vectorizing a map of Lake Otsego.  Both of these projects tie in closely to the Susquehanna River Valley and are part of the Stories of the Susquehanna program.

Most of the GIS student assistants pitched in to help with the 1868 atlas.  Together we georeferenced over 30 maps of central Pennsylvania.  To do this, we scanned pages from the atlas, clipped them to include only the maps, and then used stream, state road, and local road shapefiles to georeference them.  Most roads on the county maps correspond to still existing state roads.  The local presence of this project struck me as I drove down 522 a few days after georeferencing Middleburg, Beaver Springs, and Beavertown.  It was interesting to drive down highways I had mapped and recognize all the local cross streets.

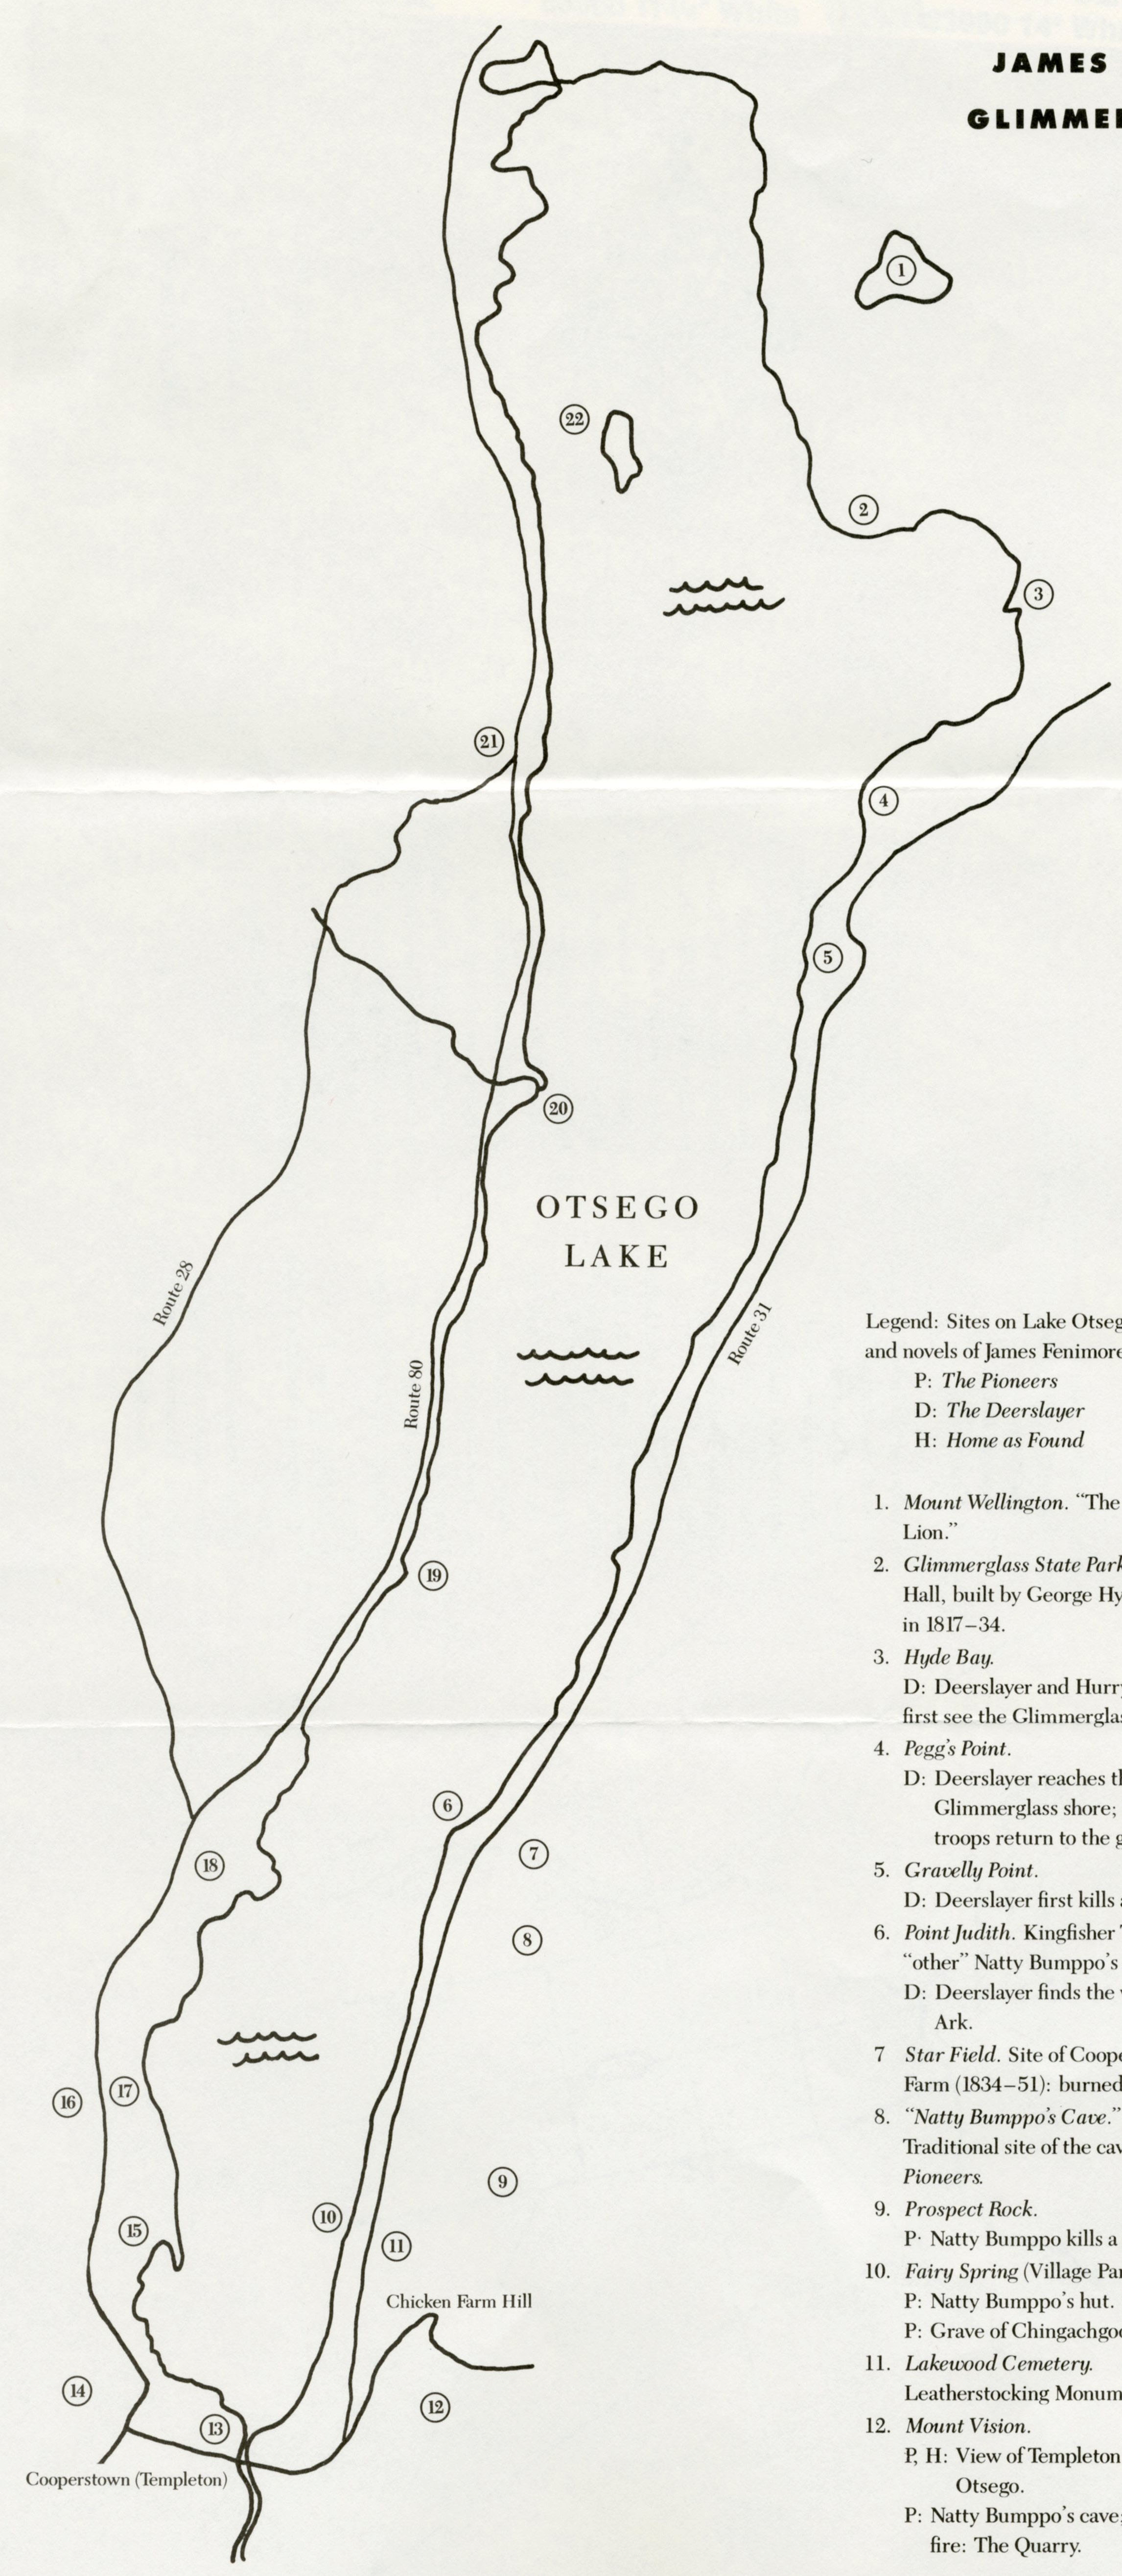
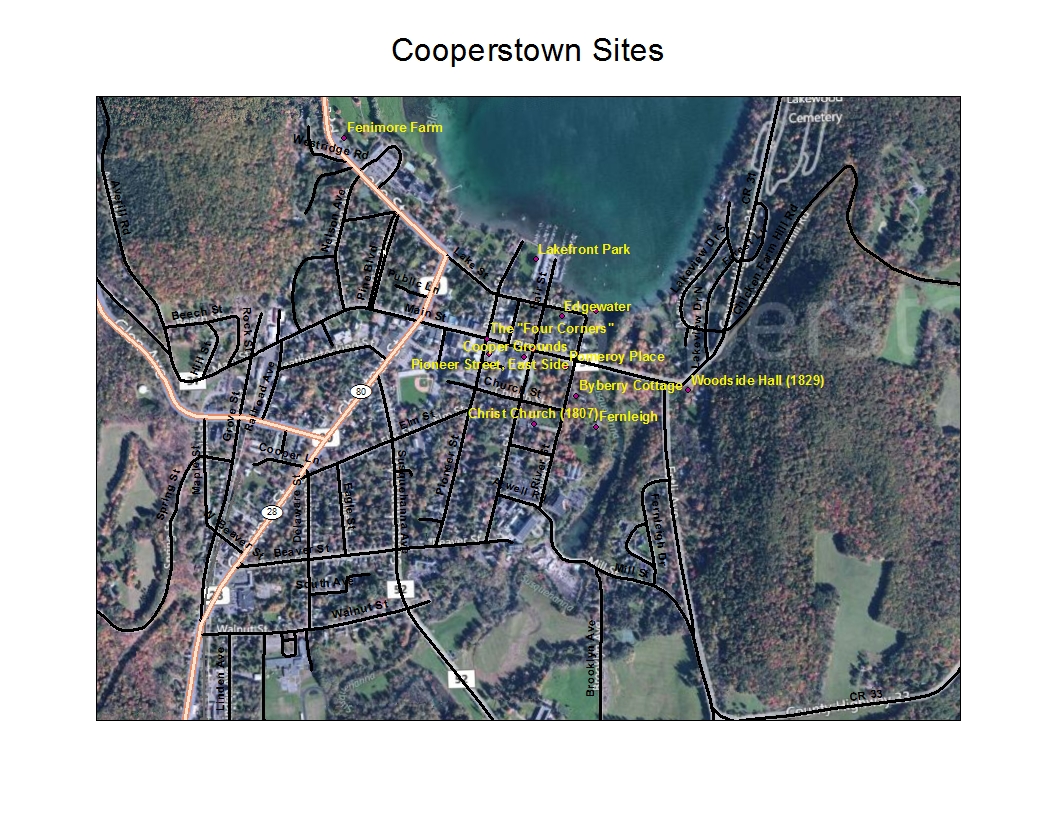
Lake Otsego is located in Otsego County, New York, and is known for three things: Cooperstown (the location of the Major League Baseball Hall of Fame, the headwaters ofthe Susquehanna, and the setting for James Fenimore Cooper’s novels, most notably Last of the Mohicans).  It is these last two facts that interest Alf Siewers, Professor of English.  He gave me a pamphlet titled “James Fenimore Cooper’s Otsego County” and asked me to vectorize the two maps on it.  One map focused on Cooperstown and the other on the whole lake.  Both displayed points important to Cooper and his family, or featured in his literature.  I georeferenced the lake image and then recorded all the points on the map by creating a new shapefile.  To vectorize Coopersburg, I didn’t need to georeference the given map.  I just used roads and local landmarks on a basefile to correctly place points in a new shapefile.  I edited the tables for each new shapefile to add information about every point, including names and known literary references from Cooper’s novels.  Finally, I created an exported final maps with BingMap hybrid basefiles, street layers, a transparent rectified original map, and my new shapefiles.


Categories
Bucknell/Local Interest Data Digital Humanities Environment General GIS GIS in Biology GIS in Computer Science GIS in Engineering GIS in Environmental Studies GIS in Geography GIS in Geology GIS in History GIS in Humanities GIS in Psychology GIS in Sociology Map Apps Marcellus Shale Miller Run Restoration Project Slideshow

What we’re up to this summer (and why we’re not posting)

Thanks to the Mellon grant and a huge number of faculty teaching and research projects it’s been a very busy summer of GIS work at Bucknell.  Over the coming weeks I’ll write detailed posts about the work we’re doing on each of the projects.  If I’m really ambitious I might try to post some interviews with faculty and students – and some footage of the aerial drone flights that Nick Urban ’12 is doing. But for now here’s a short overview of who’s doing GIS work at Bucknell this summer and what we’re doing:

GIS Student Assistants:

  • Chad Lawlis, Environmental Studies ’11
  • Dan Dougherty, Geography/History ’12
  • Max Stiss, Geography/Anthropology ’12
  • Nick Urban, Computer Science ’12
  • Mike Grasso, Environmental Studies ’13
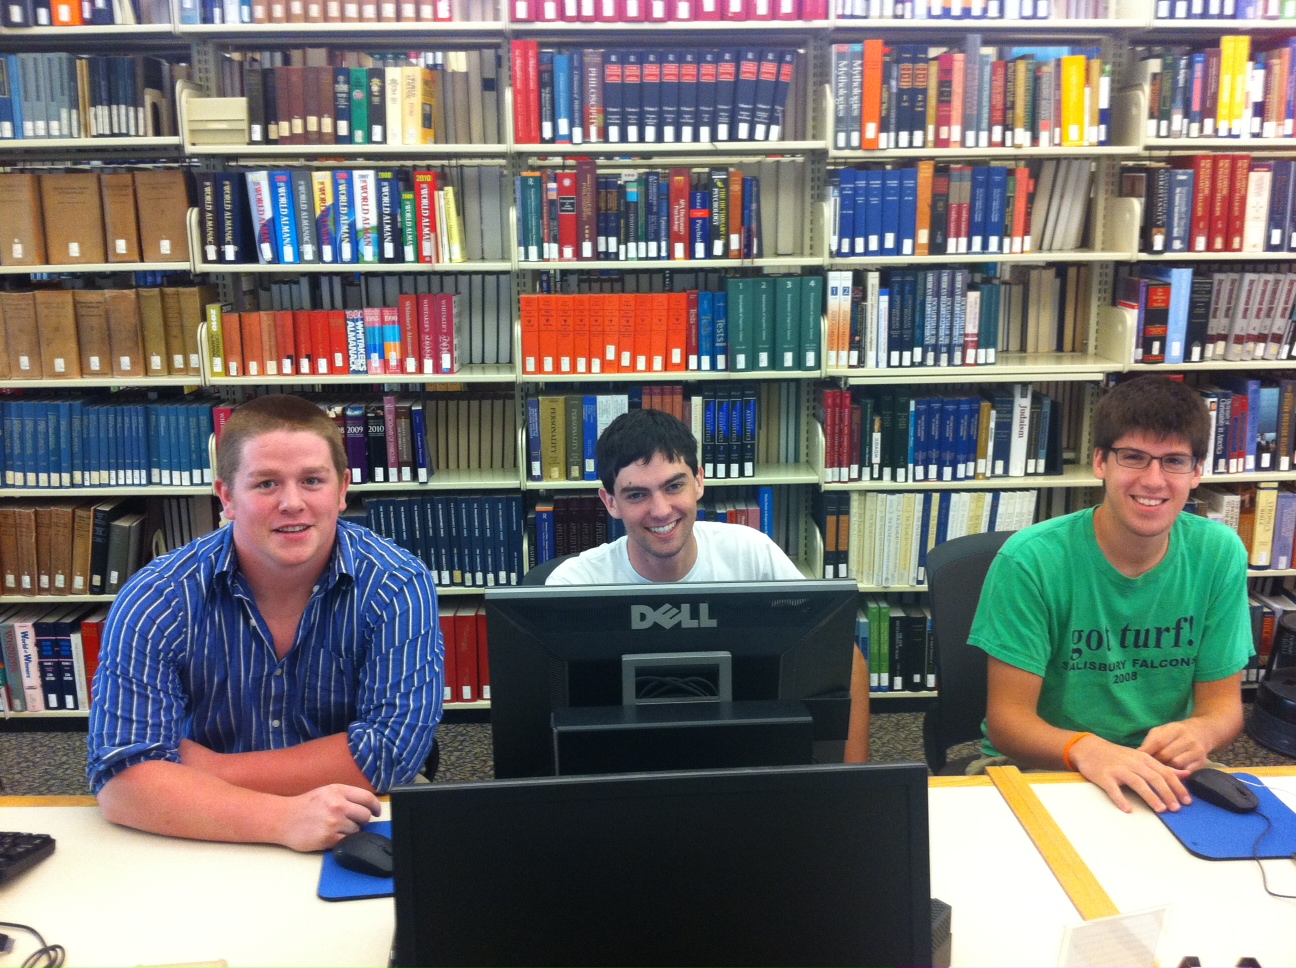
  • Robby Holler, Geography/International Relations ’13 (pictured below)
  • Darin Rockwell, Geography/Geology ’13 (pictured below)
  • Dan Ladd, Middlebury College ’14 (pictured below)

Key Projects:

  • Maps for Sudan field guide atlas to mammals
  • GPS data collection for Lewisburg Cemetary
  • GPS data collection for Miller Run restoration project
  • Aerial drone data collection for Miller Run restoration project
  • Lycoming County/Williamsport community asset mapping
  • Mapping toxic contamination from Marcellus Shale natural gas wells
  • Mapping locations of Marcellus Shale water withdrawl permits
  • Georeferencing & vectorizing 19th century economic maps of Vietnam
  • Georeferencing & vectorizing maps of environmental hazards and resources in Kyrgyzstan
  • Georeferencing & vectorizing 1868 Historic Atlas of Union & Snyder Counties
  • Data development for Stories of the Susquehanna project
  • Support for student research projects – including GPS’ing dumpster locations on campus for an analysis of campus waste and recycling, and updating Arboretum tree dataset with location info for newly planted and felled trees
  • Develop pilot web map apps for showcasing faculty research
  • Develop pilot web map apps for use in teaching
  • Implement backend IT infrastructure to support ArcGIS server
  • Maps for Bucknell admin purposes, including: analysis of parking shortages on campus; maps for task force report on campus climate; maps for SBDC report on services by county; arts festival map.


Categories
Bucknell/Local Interest Digital Humanities General GIS GIS in Environmental Studies GIS in Geography GIS in History GIS in Humanities Map Apps Marcellus Shale Slideshow Videos

Uncovering the ‘Stories of the Susquehanna’ using GIS

Bucknell faculty have long had an interest in grounding their research efforts locally – using the physical, cultural, historical and sociological landscapes of the Susquehanna Valley region as a living laboratory. The two videos below feature Prof. Katherine Faull and student Emily Bitely ’11 talking about the role of GIS in two such projects – the Stories of the Susquehanna, and the John Smith Trail Extension project (both multi-year, inter-disciplinary projects involving faculty from across the campus).

Katie Faull discussing her use of GIS for the John Smith Trail Extension and Stories of the Susquehanna project:
httpv://www.youtube.com/watch?v=j2eG2v8FnOA

Emily Bitely ’11 discussing her use of GIS for the same projects:
httpv://www.youtube.com/watch?v=1uPcaaqSzII

More about the John Smith Trail:

  • To learn more about the John Smith Trail, click here or here.
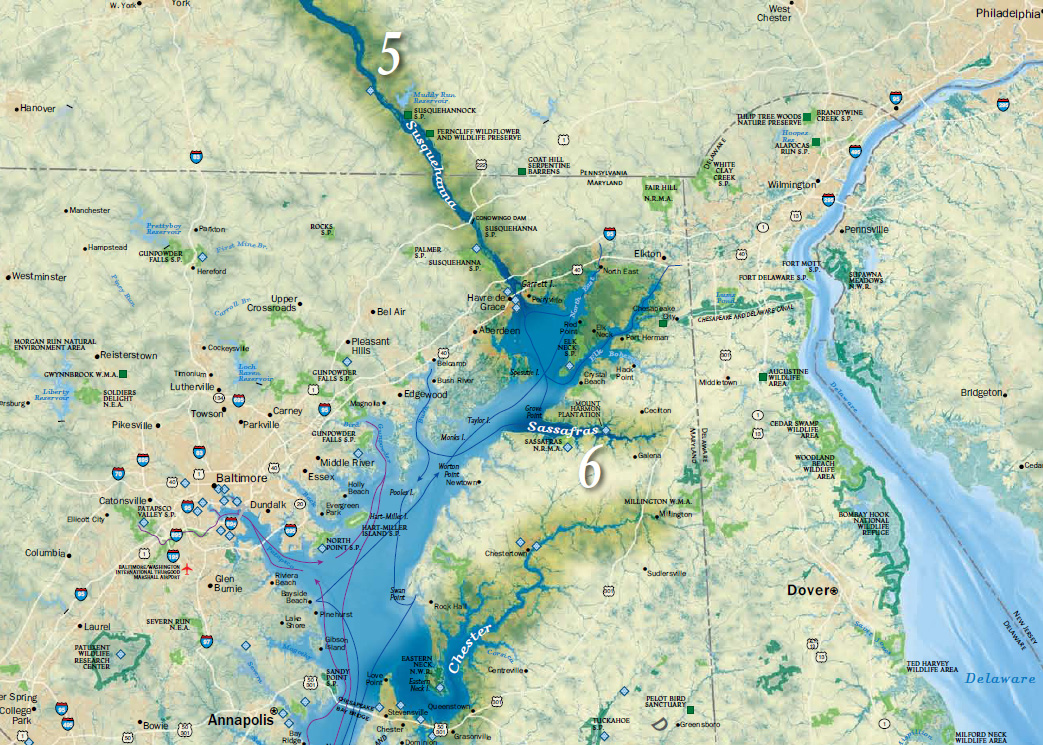
  • To view a National Geographic map detailing Captain John Smith’s voyage, click here.
  • To view a map of interpretive ‘smart’ buoys located in the river, click here.

More about the Stories of the Susquehanna project:

  • A pilot web mapping application featuring two of the ‘Stories of the Susquehanna’ is scheduled to launch this fall.  Stay tuned for more details.
  • Click here to read about the 2010 Susquehanna Valley Summer Writer’s Institute (SVSWI).  The SVSWI project is related to the Stories of the Susquehanna both in the type of local stories it explores and in its use of maps, audio, video, images and text to reflect on those stories in an interactive digital story-telling environment.
  • Click here to view the SVSWI’s interactive mapping application featuring students’ reflections on the impact of the Marcellus Shale gas boom on different populations in the Susquehanna Valley region.